Financing
The History of Interest Rates Over 670 Years
The History of Interest Rates Over 670 Years
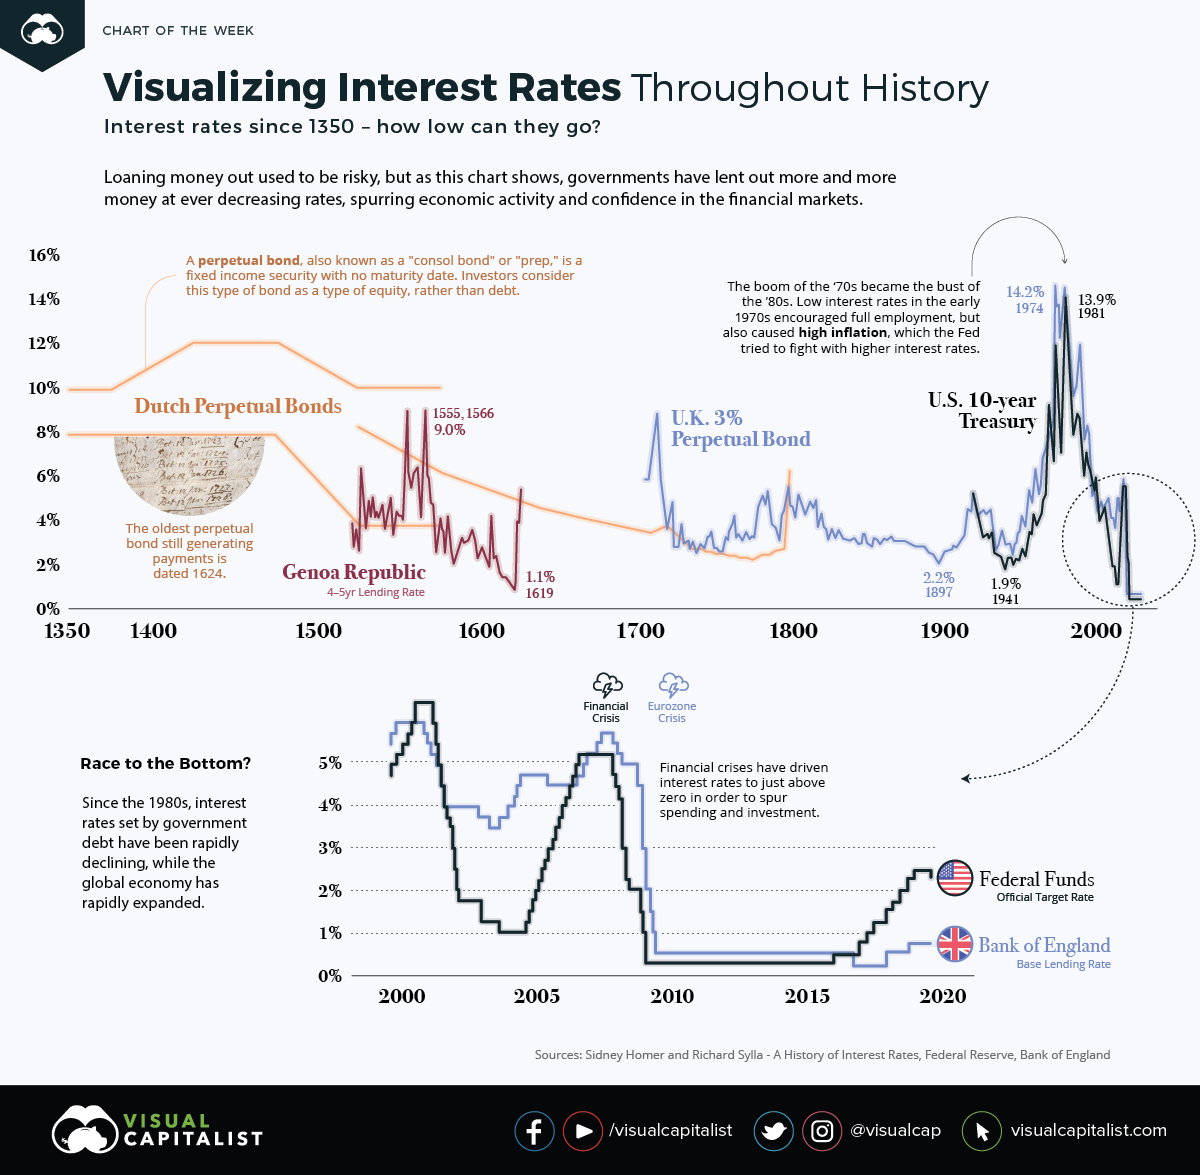
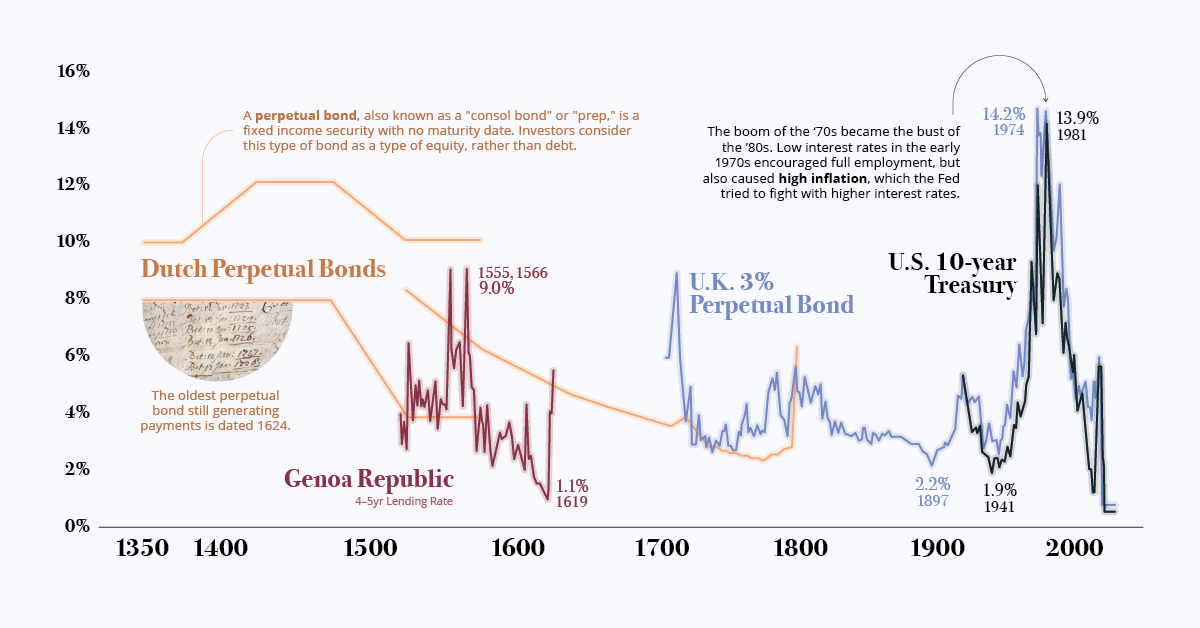
Today, we live in a low-interest-rate environment, where the cost of borrowing for governments and institutions is lower than the historical average. It is easy to see that interest rates are at generational lows, but did you know that they are also at 670-year lows?
This week’s chart outlines the interest rates attached to loans dating back to the 1350s. Take a look at the diminishing history of the cost of debt—money has never been cheaper for governments to borrow than it is today.
The Birth of an Investing Class
Trade brought many good ideas to Europe, while helping spur the Renaissance and the development of the money economy.
Key European ports and trading nations, such as the Republic of Genoa or the Netherlands during the Renaissance period, help provide a good indication of the cost of borrowing in the early history of interest rates.
The Republic of Genoa: 4-5 year Lending Rate
Genoa became a junior associate of the Spanish Empire, with Genovese bankers financing many of the Spanish crown’s foreign endeavors.
Genovese bankers provided the Spanish royal family with credit and regular income. The Spanish crown also converted unreliable shipments of New World silver into capital for further ventures through bankers in Genoa.
Dutch Perpetual Bonds
A perpetual bond is a bond with no maturity date. Investors can treat this type of bond as an equity, not as debt. Issuers pay a coupon on perpetual bonds forever, and do not have to redeem the principal—much like the dividend from a blue-chip company.
By 1640, there was so much confidence in Holland’s public debt, that it made the refinancing of outstanding debt with a much lower interest rate of 5% possible.
Dutch provincial and municipal borrowers issued three types of debt:
- Promissory notes (Obligatiën): Short-term debt, in the form of bearer bonds, that was readily negotiable
- Redeemable bonds (Losrenten): Paid an annual interest to the holder, whose name appeared in a public-debt ledger until the loan was paid off
- Life annuities (Lijfrenten): Paid interest during the life of the buyer, where death cancels the principal
Unlike other countries where private bankers issued public debt, Holland dealt directly with prospective bondholders. They issued many bonds of small coupons that attracted small savers, like craftsmen and often women.
Rule Britannia: British Consols
In 1752, the British government converted all its outstanding debt into one bond, the Consolidated 3.5% Annuities, in order to reduce the interest rate it paid. Five years later, the annual interest rate on the stock dropped to 3%, adjusting the stock as Consolidated 3% Annuities.
The coupon rate remained at 3% until 1888, when the finance minister converted the Consolidated 3% Annuities, along with Reduced 3% Annuities (1752) and New 3% Annuities (1855), into a new bond─the 2.75% Consolidated Stock. The interest rate was further reduced to 2.5% in 1903.
Interest rates briefly went back up in 1927 when Winston Churchill issued a new government stock, the 4% Consols, as a partial refinancing of WWI war bonds.
American Ascendancy: The U.S. Treasury Notes
The United States Congress passed an act in 1870 authorizing three separate consol issues with redemption privileges after 10, 15, and 30 years. This was the beginning of what became known as Treasury Bills, the modern benchmark for interest rates.
The Great Inflation of the 1970s
In the 1970s, the global stock market was a mess. Over an 18-month period, the market lost 40% of its value. For close to a decade, few people wanted to invest in public markets. Economic growth was weak, resulting in double-digit unemployment rates.
The low interest policies of the Federal Reserve in the early ‘70s encouraged full employment, but also caused high inflation. Under new leadership, the central bank would later reverse its policies, raising interest rates to 20% in an effort to reset capitalism and encourage investment.
Looking Forward: Cheap Money
Since then, interest rates set by government debt have been rapidly declining, while the global economy has rapidly expanded. Further, financial crises have driven interest rates to just above zero in order to spur spending and investment.
It is clear that the arc of lending bends towards ever-decreasing interest rates, but how low can they go?


Finance
Charted: How Long Does it Take Unicorns to Exit?
There are roughly 1,400 unicorns—startups worth $1 billion or more. How many years does it take these giants to get acquired or go public?
 Creator Program
How Long Does it Take For Unicorns to Exit?
For most unicorns—startups with a $1 billion valuation or more—it can take years to see a liquidity event.
Take Twitter, which went public seven years after its 2006 founding. Or Uber, which had an IPO after a decade of operation in 2019. After all, companies first have to succeed and build up their valuation in order to not go bankrupt or dissolve. Few are able to succeed and capitalize in a quick and tidy manner.
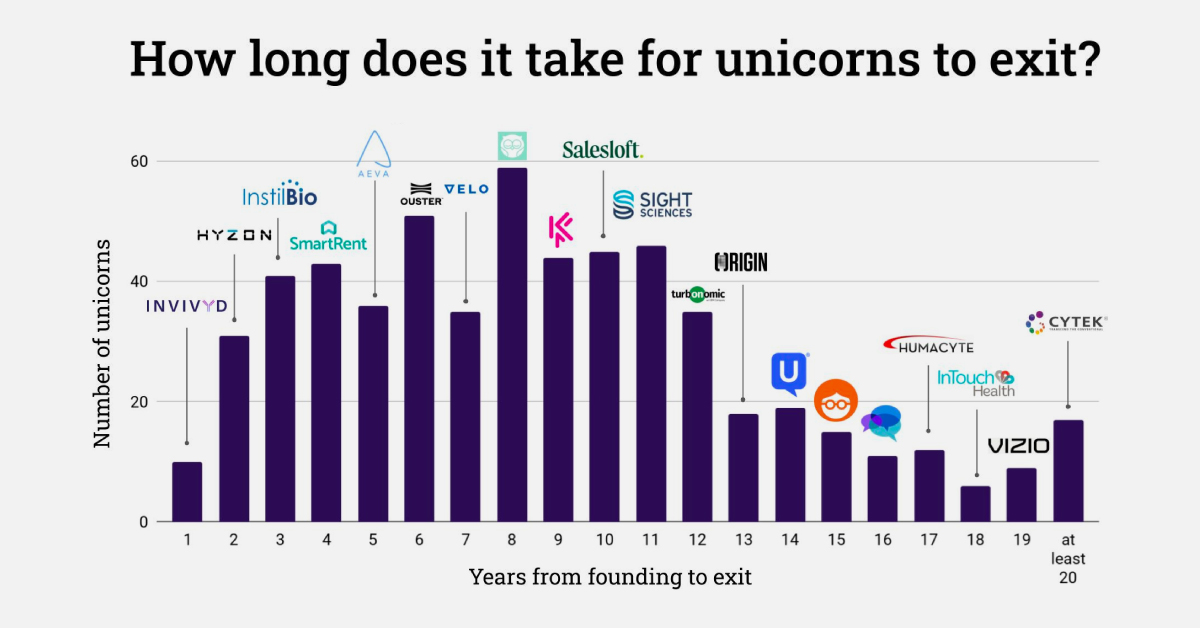
So when do unicorns exit, either successfully through an IPO or acquisition, or unsuccessfully through bankruptcy or liquidation? The above visualization from Ilya Strebulaev breaks down the time it took for 595 unicorns to exit from 1997 to 2022.
Unicorns: From Founding to Exit
Here’s how unicorn exits broke down over the last 25 years. Data was collected by Strebulaev at the Venture Capital Initiative in Stanford and covers exits up to October 2022:
| Years (Founding to Exit) | Unicorn Example | Number of Unicorns 1997‒2022 |
|---|---|---|
| 1 | YouTube | 10 |
| 2 | 31 | |
| 3 | Groupon | 41 |
| 4 | Zynga | 43 |
| 5 | Salesforce | 36 |
| 6 | Alphabet (Google) | 51 |
| 7 | Tesla | 35 |
| 8 | Zoom | 59 |
| 9 | Coursera | 44 |
| 10 | Uber Technologies | 45 |
| 11 | WeWork | 46 |
| 12 | Airbnb | 35 |
| 13 | Credit Karma | 18 |
| 14 | SimilarWeb | 19 |
| 15 | 23andMe | 15 |
| 16 | Sonos | 11 |
| 17 | Roblox | 12 |
| 18 | Squarespace | 6 |
| 19 | Vizio | 9 |
| >20 | Cytek | 17 |
Overall, unicorns exited after a median of eight years in business.
Companies like Facebook, LinkedIn, and Indeed are among the unicorns that exited in exactly eight years, which in total made up 10% of tracked exits. Another major example is Zoom, which launched in 2011 and went public in 2019 at a $9.2 billion valuation.
There were also many earlier exits, such as YouTube’s one-year turnaround from 2005 founding to 2006 acquisition by Google. Groupon also had an early exit just three years after its founding in 2008, after turning down an even earlier acquisition exit (also through Google).
In total, unicorn exits within 11 years or less accounted for just over three-quarters of tracked exits from 1997 to 2022. Many of the companies that took longer to exit also took longer to reach unicorn status, including website company Squarespace, which was founded in 2003 but didn’t reach a billion-dollar valuation until 2017 (and listed on the NYSE in 2021).
Unicorns, by Exit Strategy
Broadly speaking, there are three main types of exits: going public through an IPO, SPAC, or direct listing, being acquired, or liquidation/bankruptcy.
The most well-known are IPOs, or initial public offerings. These are the most common types of unicorn exits in strong market conditions, with 2021 seeing 79 unicorn IPOs globally, with $83 billion in proceeds.
| 2021 | 2022 | % Change | |
|---|---|---|---|
| # Unicorn IPOs | 79 | 13 | -84% |
| Proceeds | $82.9B | $5.3B | -94% |
But the number of IPOs drops drastically given weaker market performance, as seen above. At the end of 2022, an estimated 91% of unicorn IPOs listed since 2021 had share prices fall below their IPO price.
A less common unicorn exit is an SPAC (special purpose acquisition company), although they’ve been gaining momentum and were used by WeWork and BuzzFeed. With an SPAC, a shell company raises money in an IPO and merges with a private company to take it public.
Finally, while an IPO lists new shares to the public with an underwriter, a direct listing sells existing shares without an underwriter. Though it was historically seen as a cheaper IPO alternative, some well-known unicorns have used direct listings including Roblox and Coinbase.
And as valuations for unicorns (and their public listings) have grown, acquisitions have become less frequent. Additionally, many major firms have been buying back shares since 2022 to shore up investor confidence instead of engaging in acquisitions.
Slower Exit Activity
While the growth of unicorns has been exponential over the last decade, exit activity has virtually ground to a halt in 2023.
Investor caution and increased conservation of capital have contributed to the lack of unicorn exits. As of the second quarter of 2023, just eight unicorns in the U.S. exited. These include Mosaic ML, an artificial intelligence startup, and carbon recycling firm LanzaTech.
As exit activity declines, companies may halt listing plans and eventually slow expansion and cut costs. What’s uncertain is whether or not this lull in unicorn exits—and declining influx of private capital influx—is temporary or part of a long-term readjustment.

-

 Education1 week ago
How Hard Is It to Get Into an Ivy League School?
-

 Technology2 weeks ago
Ranked: Semiconductor Companies by Industry Revenue Share
-

 Markets2 weeks ago
Ranked: The World’s Top Flight Routes, by Revenue
-

 Demographics2 weeks ago
Population Projections: The World’s 6 Largest Countries in 2075
-

 Markets2 weeks ago
The Top 10 States by Real GDP Growth in 2023
-

 Demographics2 weeks ago
The Smallest Gender Wage Gaps in OECD Countries
-

 Economy2 weeks ago
Where U.S. Inflation Hit the Hardest in March 2024
-

 Green2 weeks ago
Top Countries By Forest Growth Since 2001