Finance
Charted: How Long Does it Take Unicorns to Exit?
Article/Editing:
How Long Does it Take For Unicorns to Exit?
For most unicorns—startups with a $1 billion valuation or more—it can take years to see a liquidity event.
Take Twitter, which went public seven years after its 2006 founding. Or Uber, which had an IPO after a decade of operation in 2019. After all, companies first have to succeed and build up their valuation in order to not go bankrupt or dissolve. Few are able to succeed and capitalize in a quick and tidy manner.
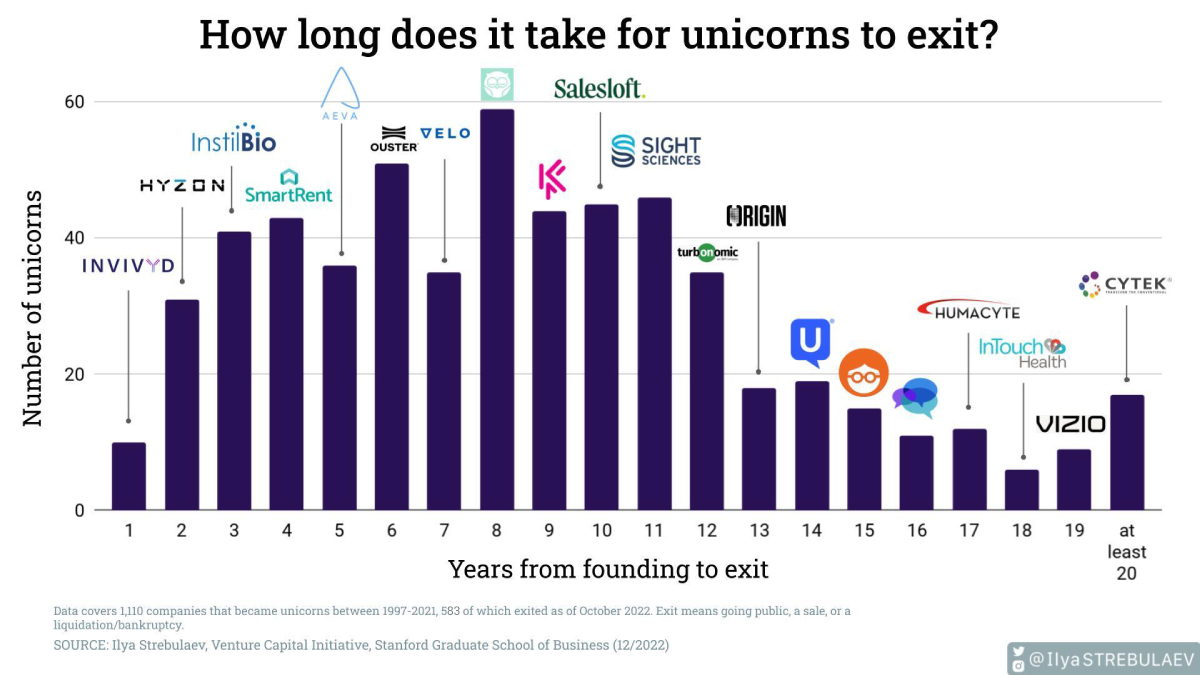
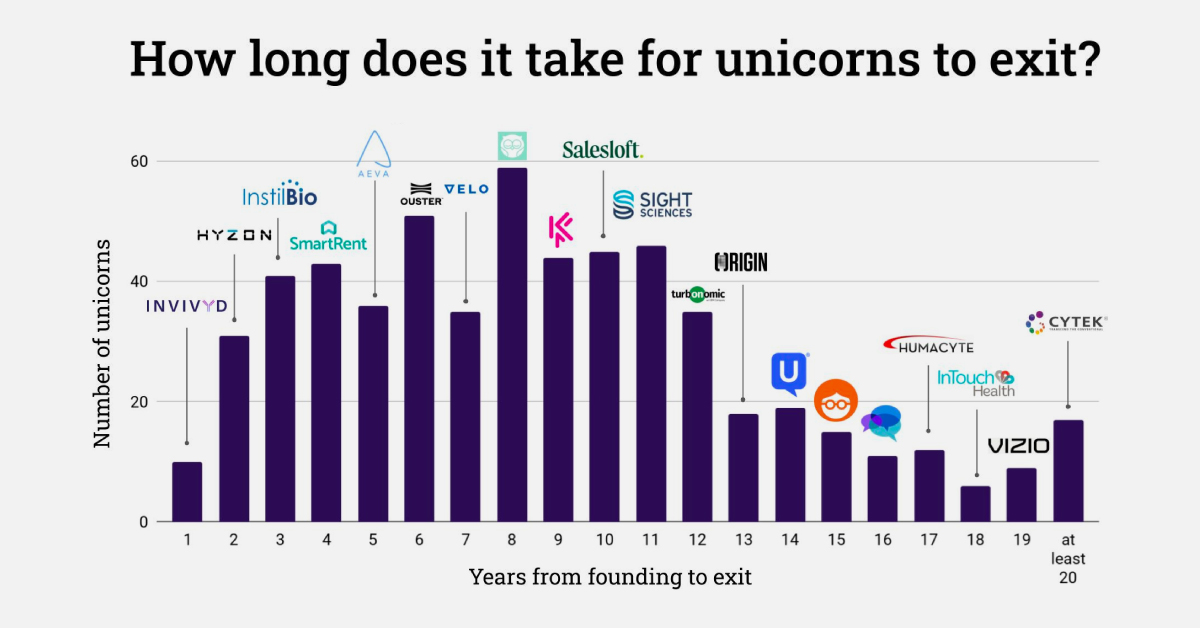
So when do unicorns exit, either successfully through an IPO or acquisition, or unsuccessfully through bankruptcy or liquidation? The above visualization from Ilya Strebulaev breaks down the time it took for 595 unicorns to exit from 1997 to 2022.
Unicorns: From Founding to Exit
Here’s how unicorn exits broke down over the last 25 years. Data was collected by Strebulaev at the Venture Capital Initiative in Stanford and covers exits up to October 2022:
| Years (Founding to Exit) | Unicorn Example | Number of Unicorns 1997‒2022 |
|---|---|---|
| 1 | YouTube | 10 |
| 2 | 31 | |
| 3 | Groupon | 41 |
| 4 | Zynga | 43 |
| 5 | Salesforce | 36 |
| 6 | Alphabet (Google) | 51 |
| 7 | Tesla | 35 |
| 8 | Zoom | 59 |
| 9 | Coursera | 44 |
| 10 | Uber Technologies | 45 |
| 11 | WeWork | 46 |
| 12 | Airbnb | 35 |
| 13 | Credit Karma | 18 |
| 14 | SimilarWeb | 19 |
| 15 | 23andMe | 15 |
| 16 | Sonos | 11 |
| 17 | Roblox | 12 |
| 18 | Squarespace | 6 |
| 19 | Vizio | 9 |
| >20 | Cytek | 17 |
Overall, unicorns exited after a median of eight years in business.
Companies like Facebook, LinkedIn, and Indeed are among the unicorns that exited in exactly eight years, which in total made up 10% of tracked exits. Another major example is Zoom, which launched in 2011 and went public in 2019 at a $9.2 billion valuation.
There were also many earlier exits, such as YouTube’s one-year turnaround from 2005 founding to 2006 acquisition by Google. Groupon also had an early exit just three years after its founding in 2008, after turning down an even earlier acquisition exit (also through Google).
In total, unicorn exits within 11 years or less accounted for just over three-quarters of tracked exits from 1997 to 2022. Many of the companies that took longer to exit also took longer to reach unicorn status, including website company Squarespace, which was founded in 2003 but didn’t reach a billion-dollar valuation until 2017 (and listed on the NYSE in 2021).
Unicorns, by Exit Strategy
Broadly speaking, there are three main types of exits: going public through an IPO, SPAC, or direct listing, being acquired, or liquidation/bankruptcy.
The most well-known are IPOs, or initial public offerings. These are the most common types of unicorn exits in strong market conditions, with 2021 seeing 79 unicorn IPOs globally, with $83 billion in proceeds.
| 2021 | 2022 | % Change | |
|---|---|---|---|
| # Unicorn IPOs | 79 | 13 | -84% |
| Proceeds | $82.9B | $5.3B | -94% |
But the number of IPOs drops drastically given weaker market performance, as seen above. At the end of 2022, an estimated 91% of unicorn IPOs listed since 2021 had share prices fall below their IPO price.
A less common unicorn exit is an SPAC (special purpose acquisition company), although they’ve been gaining momentum and were used by WeWork and BuzzFeed. With an SPAC, a shell company raises money in an IPO and merges with a private company to take it public.
Finally, while an IPO lists new shares to the public with an underwriter, a direct listing sells existing shares without an underwriter. Though it was historically seen as a cheaper IPO alternative, some well-known unicorns have used direct listings including Roblox and Coinbase.
And as valuations for unicorns (and their public listings) have grown, acquisitions have become less frequent. Additionally, many major firms have been buying back shares since 2022 to shore up investor confidence instead of engaging in acquisitions.
Slower Exit Activity
While the growth of unicorns has been exponential over the last decade, exit activity has virtually ground to a halt in 2023.
Investor caution and increased conservation of capital have contributed to the lack of unicorn exits. As of the second quarter of 2023, just eight unicorns in the U.S. exited. These include Mosaic ML, an artificial intelligence startup, and carbon recycling firm LanzaTech.
As exit activity declines, companies may halt listing plans and eventually slow expansion and cut costs. What’s uncertain is whether or not this lull in unicorn exits—and declining influx of private capital influx—is temporary or part of a long-term readjustment.

This article was published as a part of Visual Capitalist's Creator Program, which features data-driven visuals from some of our favorite Creators around the world.


Business
Visualizing the Revenue of the Big Four Accounting Firms
The Big Four accounting firms amassed over $200 billion in combined revenue in 2023.
Visualizing the Revenue of the Big Four Accounting Firms
This was originally posted on our Voronoi app. Download the app for free on iOS or Android and discover incredible data-driven charts from a variety of trusted sources.
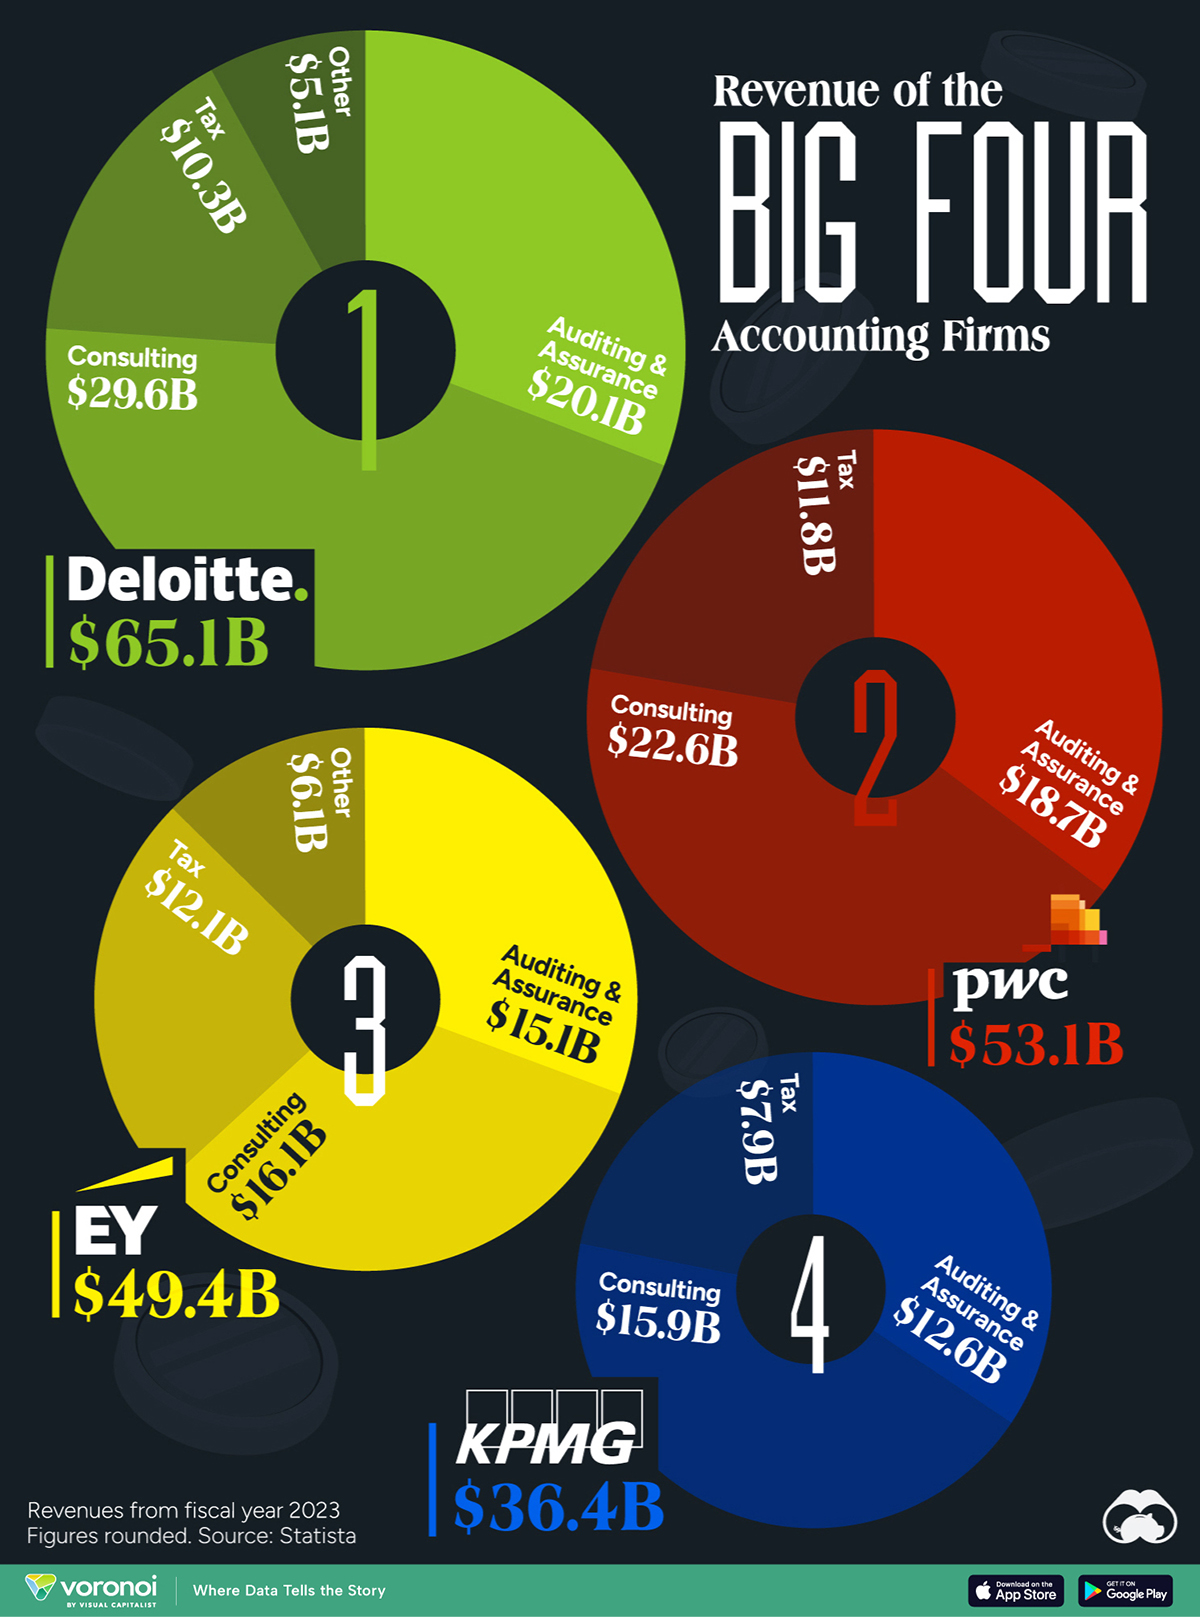
The Big Four accounting firms – Deloitte, Ernst & Young (EY), PricewaterhouseCoopers (PwC), and KPMG – have solidified their positions as global industry leaders, boasting a combined revenue exceeding $200 billion in 2023.
Together, these firms audit the majority of publicly traded companies worldwide.
This infographic details the revenues of the “Big Four” accounting firms for the fiscal year 2023, based on data from Statista.
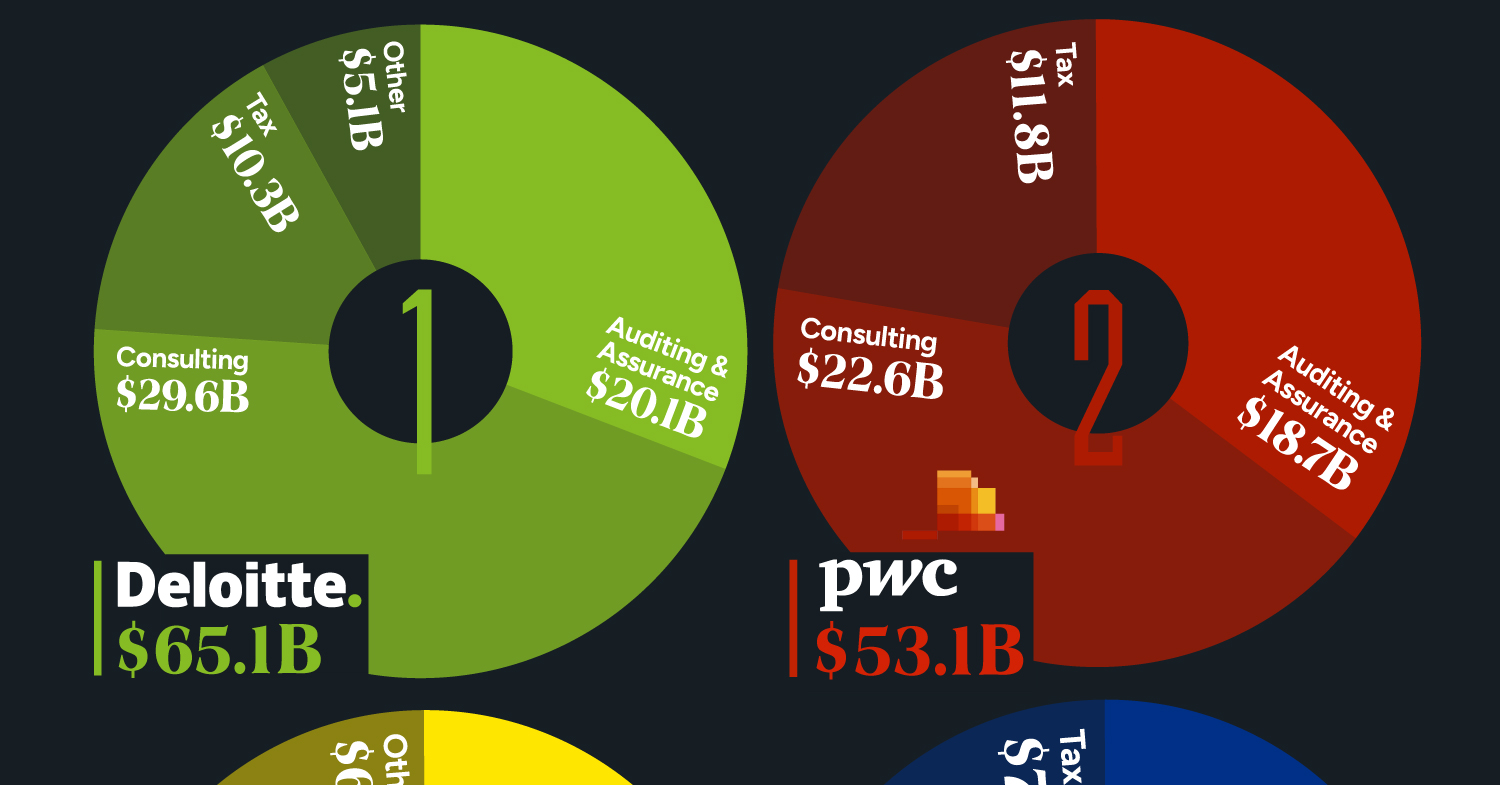
Deloitte Leads the Big Four in 2023 Revenues
Offering diverse services, the Big Four specialize in auditing and assurance, ensuring financial transparency, and regulatory compliance for their clients. Additionally, they provide strategic consulting services. All four are legally headquartered in the UK and command a dominant global market share.
| Company | Auditing & Assurance | Consulting | Tax | Other | Total ($ billions) |
|---|---|---|---|---|---|
| Deloitte | $20.1 | $29.6 | $10.3 | $5.1 | $65.1 |
| PwC | $18.7 | $22.6 | $11.8 | $53.1 | |
| EY | $15.1 | $16.1 | $12.1 | $6.1 | $49.4 |
| KPMG | $12.6 | $15.9 | $7.9 | $36.4 |
Interestingly, the largest accounting firms were formerly known as the “Big Eight,” but mergers and closures starting in the late 1980s have reduced their number to four.
The original group consisted of Arthur Andersen, Arthur Young, Coopers & Lybrand, Deloitte Haskin & Sells, Ernst & Whinney, Peat Marwick Mitchell, Price Waterhouse, and Touche Ross, all headquartered in the U.S. or UK.
Arthur Young merged with Ernst & Whinney, and Deloitte Haskin & Sells combined with Touche Ross. Subsequently, Price Waterhouse and Coopers & Lybrand merged their practices, reducing the count to five. However, following the collapse of Arthur Andersen due to its involvement in the Enron scandal, the “Big Five” became the present-day four.
The Scale of the Big Four
Deloitte is the largest in terms of headcount, with over 456,000 employees as of FY2023, followed by Ernst & Young with more than 395,000 workers, and PwC with 364,000. Despite being the smallest among the four, KPMG still has 298,356 employees.

-

 Debt1 week ago
How Debt-to-GDP Ratios Have Changed Since 2000
-

 Markets2 weeks ago
Ranked: The World’s Top Flight Routes, by Revenue
-

 Countries2 weeks ago
Population Projections: The World’s 6 Largest Countries in 2075
-

 Markets2 weeks ago
The Top 10 States by Real GDP Growth in 2023
-

 Demographics2 weeks ago
The Smallest Gender Wage Gaps in OECD Countries
-

 United States2 weeks ago
Where U.S. Inflation Hit the Hardest in March 2024
-

 Green2 weeks ago
Top Countries By Forest Growth Since 2001
-

 United States2 weeks ago
Ranked: The Largest U.S. Corporations by Number of Employees