Stocks
The 50 Most Valuable Companies in the World in 2023


The 50 Most Valuable Companies in the World
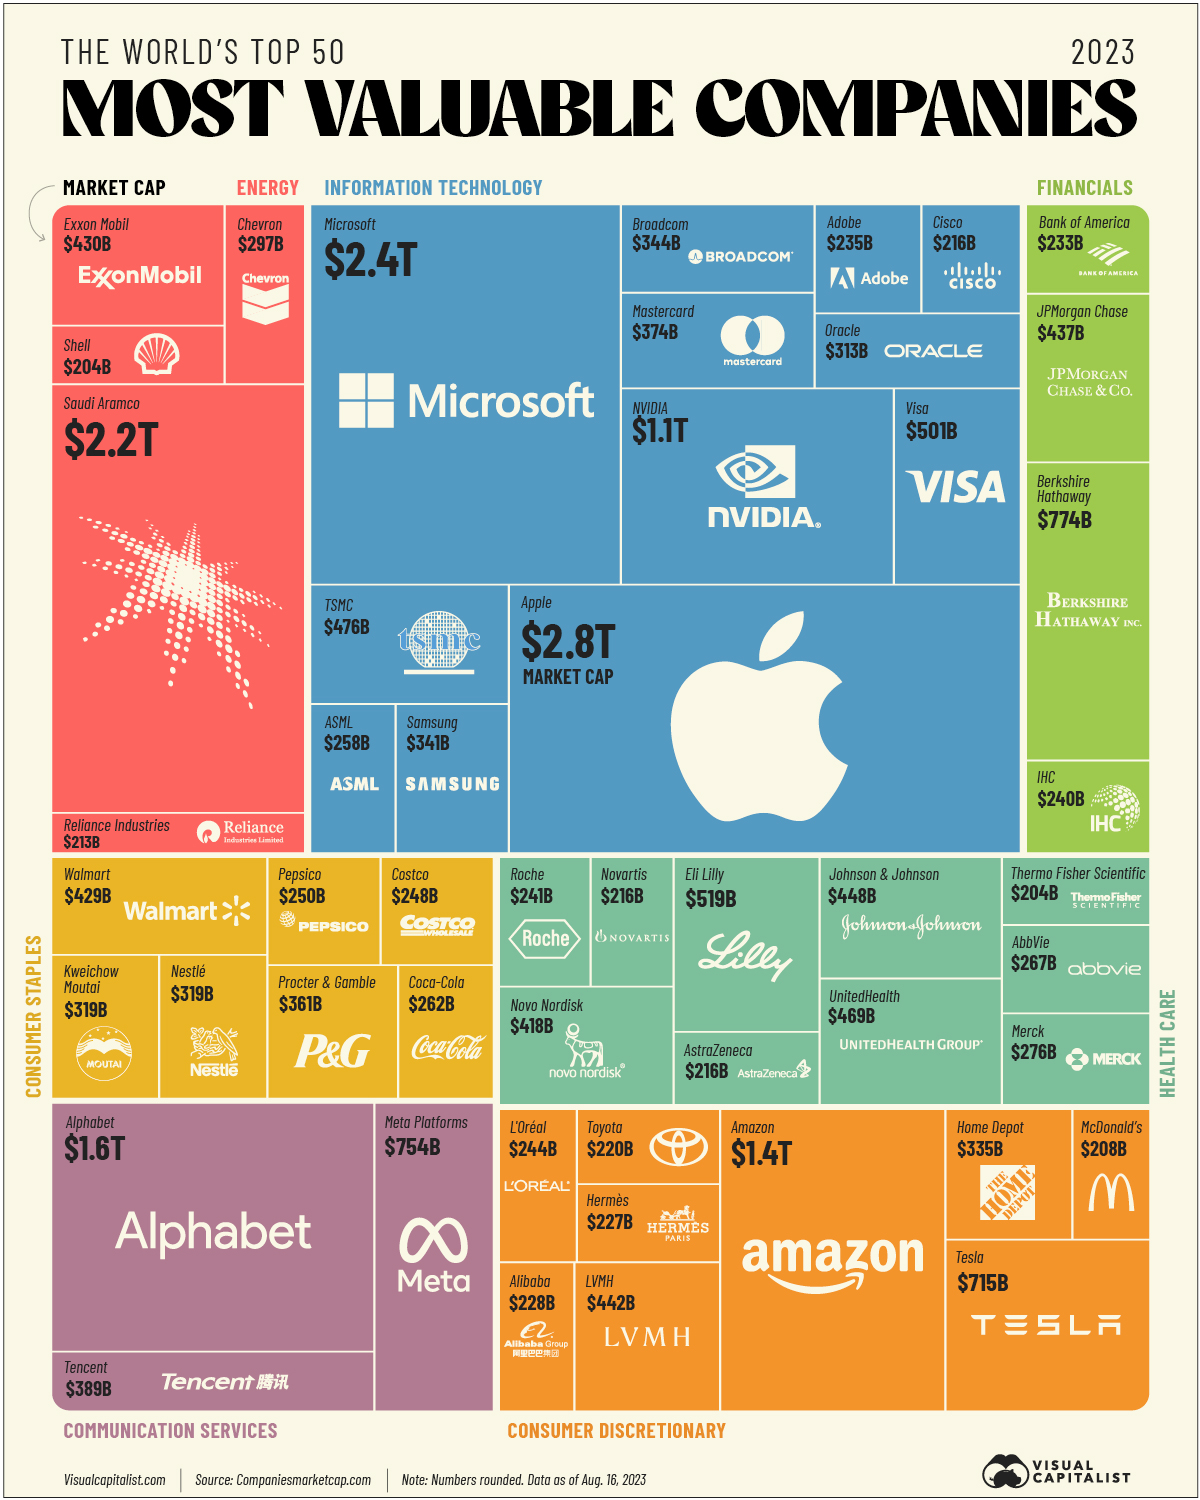
Market capitalization, or market cap, is one measure of a company’s value as determined by the stock market. It is easily calculated by multiplying the company’s outstanding shares by its current share price.
In this graphic, we present a treemap chart that visualizes the world’s top 50 publicly-traded companies by market cap, using data as of Aug. 16, 2023.
Editor’s note: While market capitalization is a simple way to compare publicly-traded companies, it does have some limitations. Most importantly, it does not include debt or cash in the calculation.
Data and Highlights
All of the data we used to create this graphic is included in the table below.
| Company | Sector | Country | Market Cap (USD billions) |
|---|---|---|---|
| Apple | Information Technology | 🇺🇸 US | $2,777 |
| Microsoft | Information Technology | 🇺🇸 US | $2,382 |
| Saudi Aramco | Energy | 🇸🇦 Saudi Arabia | $2,222 |
| Alphabet | Communication Services | 🇺🇸 US | $1,636 |
| Amazon | Consumer Discretionary | 🇺🇸 US | $1,385 |
| NVIDIA | Information Technology | 🇺🇸 US | $1,074 |
| Berkshire Hathaway | Financials | 🇺🇸 US | $774 |
| Meta Platforms | Communication Services | 🇺🇸 US | $754 |
| Tesla | Consumer Discretionary | 🇺🇸 US | $715 |
| Eli Lilly | Health Care | 🇺🇸 US | $519 |
| Visa | Information Technology | 🇺🇸 US | $501 |
| TSMC | Information Technology | 🇹🇼 Taiwan | $476 |
| UnitedHealth | Health Care | 🇺🇸 US | $469 |
| Johnson & Johnson | Health Care | 🇺🇸 US | $448 |
| LVMH | Consumer Discretionary | 🇫🇷 France | $442 |
| JPMorgan Chase | Financials | 🇺🇸 US | $436 |
| Exxon Mobil | Energy | 🇺🇸 US | $430 |
| Walmart | Consumer Staples | 🇺🇸 US | $429 |
| Novo Nordisk | Health Care | 🇩🇰 Denmark | $418 |
| Tencent | Communication Services | 🇨🇳 China | $389 |
| Mastercard | Information Technology | 🇺🇸 US | $374 |
| Procter & Gamble | Consumer Staples | 🇺🇸 US | $361 |
| Broadcom | Information Technology | 🇺🇸 US | $344 |
| Samsung | Information Technology | 🇰🇷 South Korea | $341 |
| Home Depot | Consumer Discretionary | 🇺🇸 US | $335 |
| Kweichow Moutai | Consumer Staples | 🇨🇳 China | $319 |
| Nestlé | Consumer Staples | 🇨🇭 Switzerland | $319 |
| Oracle | Information Technology | 🇺🇸 US | $313 |
| Chevron | Energy | 🇺🇸 US | $297 |
| Merck | Health Care | 🇺🇸 US | $276 |
| AbbVie | Health Care | 🇺🇸 US | $267 |
| Coca-Cola | Consumer Staples | 🇺🇸 US | $262 |
| ASML | Information Technology | 🇳🇱 Netherlands | $258 |
| Pepsico | Consumer Staples | 🇺🇸 US | $249 |
| Costco | Consumer Staples | 🇺🇸 US | $248 |
| L'Oréal | Consumer Discretionary | 🇫🇷 France | $244 |
| Roche | Health Care | 🇨🇭 Switzerland | $241 |
| International Holding Company | Financials | 🇦🇪 UAE | $240 |
| Adobe | Information Technology | 🇺🇸 US | $235 |
| Bank of America | Financials | 🇺🇸 US | $233 |
| Alibaba | Consumer Discretionary | 🇨🇳 China | $228 |
| Hermès | Consumer Discretionary | 🇫🇷 France | $227 |
| Toyota | Consumer Discretionary | 🇯🇵 Japan | $220 |
| Novartis | Health Care | 🇨🇭 Switzerland | $216 |
| AstraZeneca | Health Care | 🇬🇧 UK | $216 |
| Cisco | Information Technology | 🇺🇸 US | $216 |
| Reliance Industries | Energy | 🇮🇳 India | $213 |
| McDonald | Consumer Discretionary | 🇺🇸 US | $208 |
| Thermo Fisher Scientific | Health Care | 🇺🇸 US | $204 |
| Shell | Energy | 🇬🇧 UK | $204 |
From this data, we can see that there are only a handful of trillion dollar companies in the world, including Apple, Microsoft, Saudi Aramco, Amazon, Alphabet, and Nvidia.
Two former members of the trillion dollar club are Meta and Tesla, but both companies currently hover around the $700 billion range in terms of market capitalization. In 2022, Meta lost significant value as its earnings fell, while Tesla suffered from demand concerns.
Altogether, the 50 most valuable companies represent over $26.5 trillion in shareholder value. At a sector level, Information Technology is the most represented in the top 50, with $9.3 trillion in combined market cap. The next biggest sectors are Consumer Discretionary ($4.0 trillion) and Health Care ($3.3 trillion).
Geographical Breakdown
At a geographical level, the majority of the 50 most valuable companies are American. The following chart shows each country’s tally.
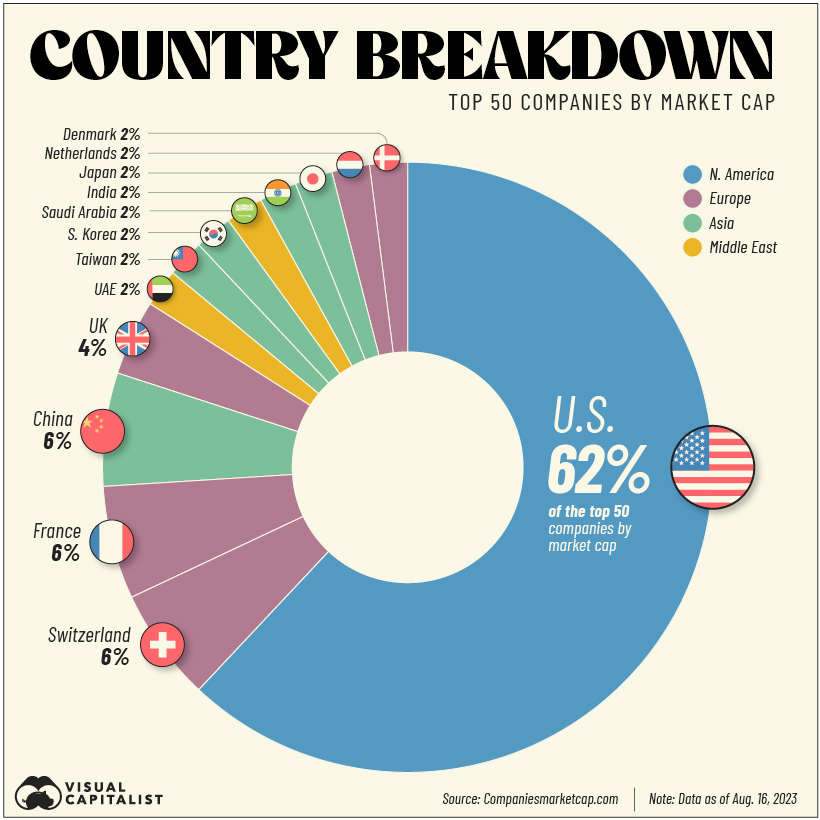
After the U.S., the three most represented countries are Switzerland, France, and China, with three companies apiece.
From Switzerland are companies such as Nestlé, Roche, and Novartis. The latter two are major players in the healthcare industry.
France’s companies in the top 50 list all belong to the Consumer Discretionary sector, and include fashion giants LVMH and Hermès, as well as L’Oréal, a global leader in cosmetics. Earlier this year, LVMH CEO Bernard Arnault was officially the richest person in the world with a fortune of $215 billion.
Finally, from the Chinese side are two globally-recognized names in Tencent and Alibaba. China’s third company on this list is Kweichow Moutai, a partially state-owned producer of alcoholic beverages.


Markets
Visualizing the Biggest Companies on Major Stock Exchanges
With trillion dollar valuations becoming more common, we’ve compared the five biggest companies by stock exchange.
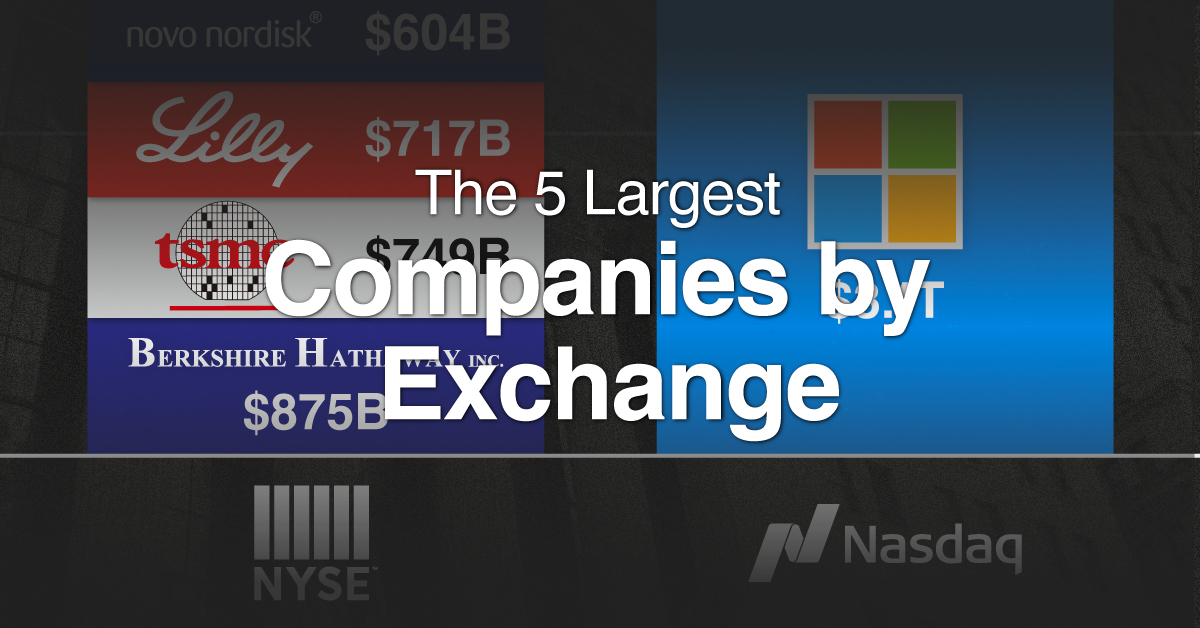
Comparing the Top Five Companies on Major Stock Exchanges
This was originally posted on our Voronoi app. Download the app for free on iOS or Android and discover incredible data-driven charts from a variety of trusted sources.
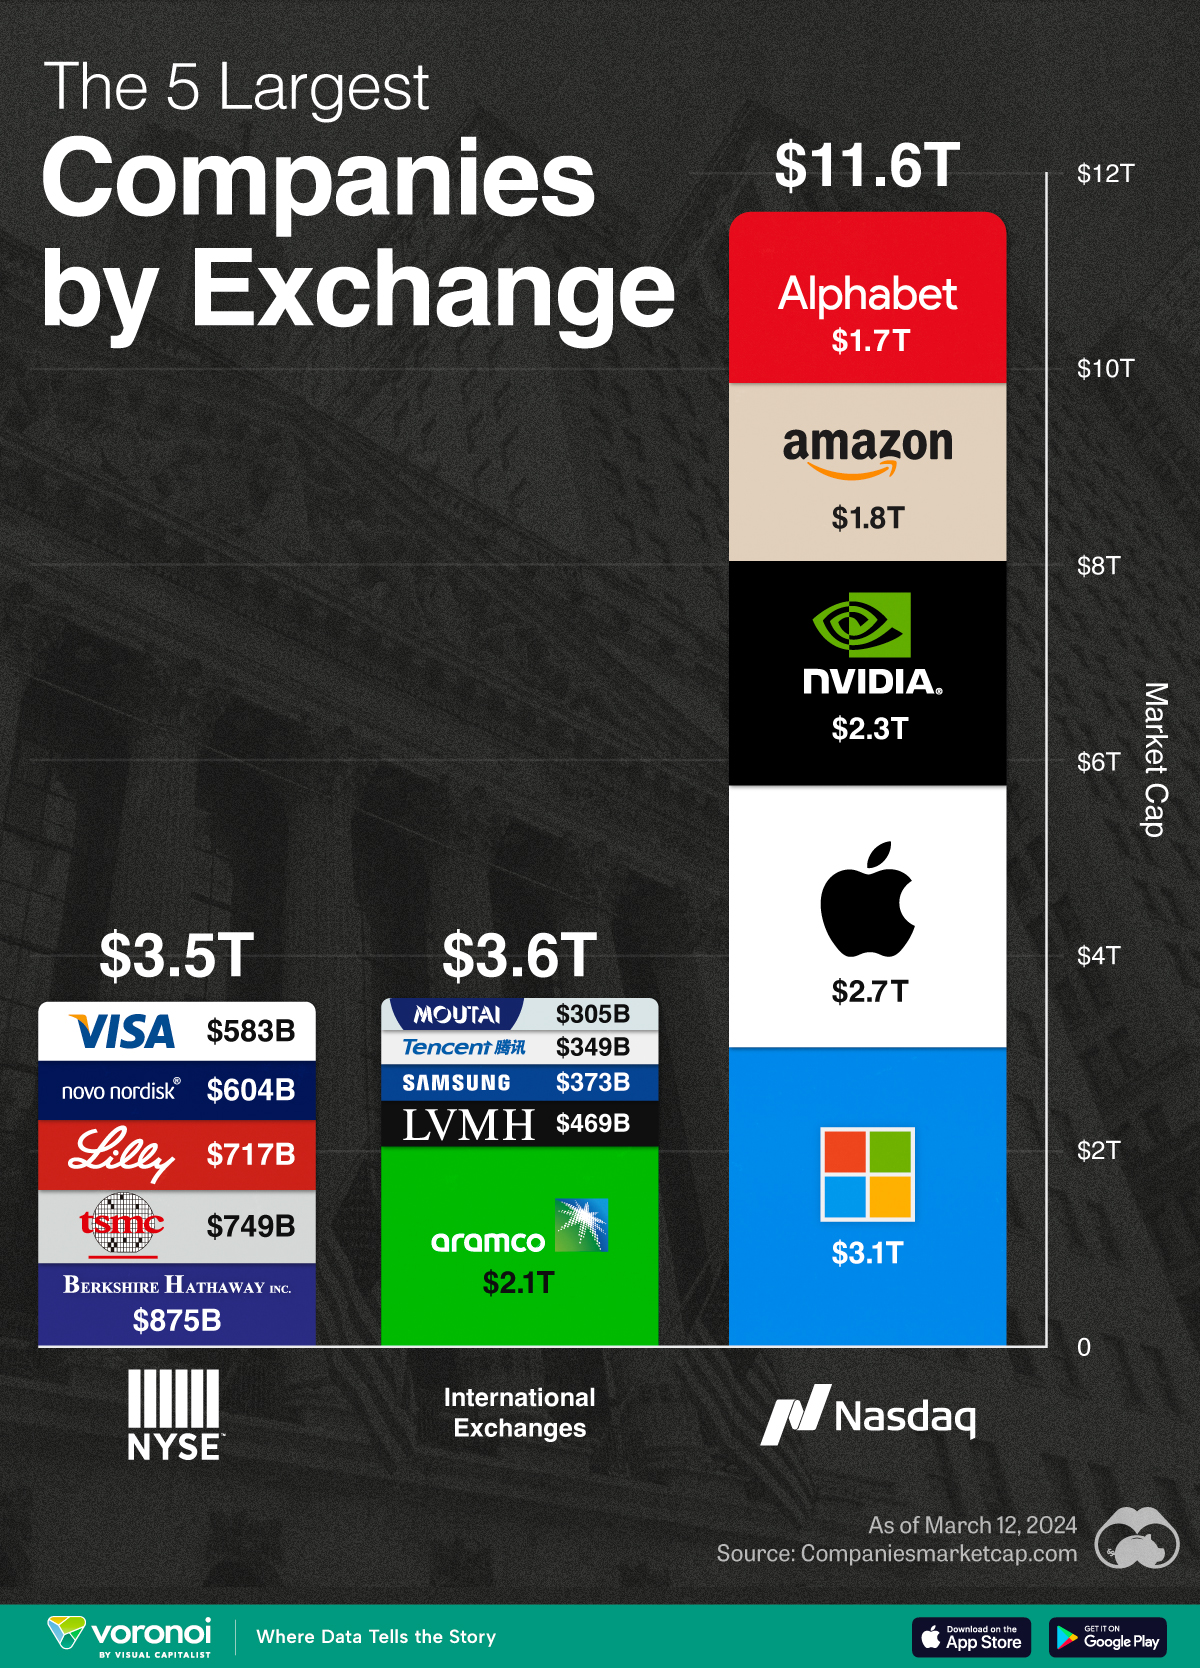
With many companies nearing or surpassing the $1 trillion market capitalization milestone, we’ve put together a graphic that visualizes the five largest companies trading on the Nasdaq, New York Stock Exchange (NYSE), and international exchanges.
These figures come from Companiesmarketcap.com, and are as of March 12, 2024.
Biggest Companies on the Nasdaq
The Nasdaq is largely dominated by the tech industry, with all of its top five companies belonging to the Magnificent Seven group of U.S. tech stocks.
| Company | Market Cap (USD) |
|---|---|
| 🇺🇸 Microsoft | $3.1T |
| 🇺🇸 Apple | $2.7T |
| 🇺🇸 Nvidia | $2.3T |
| 🇺🇸 Amazon | $1.8T |
| $1.7T |
Altogether, these five companies have a combined market capitalization of nearly $12 trillion. To put this figure into context, the entire U.S. equity market is worth around $53 trillion.
Biggest Companies on the NYSE
The NYSE’s largest companies are more diversified, with a combination of tech, financial services, and healthcare names present. Among this list, Warren Buffett’s Berkshire Hathaway is the closest to becoming the next trillion dollar company.
| Company | Market Cap (USD) |
|---|---|
| 🇺🇸 Berkshire Hathaway | $875B |
| 🇹🇼 TSMC | $749B |
| 🇺🇸 Eli Lilly | $717B |
| 🇩🇰 Novo Nordisk | $604B |
| 🇺🇸 Visa | $583B |
Biggest Companies on International Exchanges
Saudi Aramco is the largest public company listed outside of the U.S., with a mammoth $2.1 trillion valuation.
| Company | Market Cap (USD) |
|---|---|
| 🇸🇦 Saudi Aramco | $2.1T |
| 🇫🇷 LVMH | $469B |
| 🇰🇷 Samsung | $373B |
| 🇨🇳 Tencent | $349B |
| 🇨🇳 Kweichow Moutai | $305B |
It should be noted, however, that the Saudi government directly owns 90% of the company, while another 8% is held by the country’s sovereign wealth fund.
This means that only 2% of shares are actually available to the public, prompting one Bloomberg columnist to call the firm’s valuation an “illusion”.

-

 Education1 week ago
How Hard Is It to Get Into an Ivy League School?
-

 Technology2 weeks ago
Ranked: Semiconductor Companies by Industry Revenue Share
-

 Markets2 weeks ago
Ranked: The World’s Top Flight Routes, by Revenue
-

 Demographics2 weeks ago
Population Projections: The World’s 6 Largest Countries in 2075
-

 Markets2 weeks ago
The Top 10 States by Real GDP Growth in 2023
-

 Demographics2 weeks ago
The Smallest Gender Wage Gaps in OECD Countries
-

 Economy2 weeks ago
Where U.S. Inflation Hit the Hardest in March 2024
-

 Green2 weeks ago
Top Countries By Forest Growth Since 2001