Markets
Charted: The Rise and Fall of WeWork


Charted: The Rise and Fall of WeWork
Despite its recommitment to core business fundamentals in the last few years, WeWork’s management—which saw a shakeup in May 2023 when CEO Sandeep Mathrani departed—is setting off a signal flare about the company’s future.
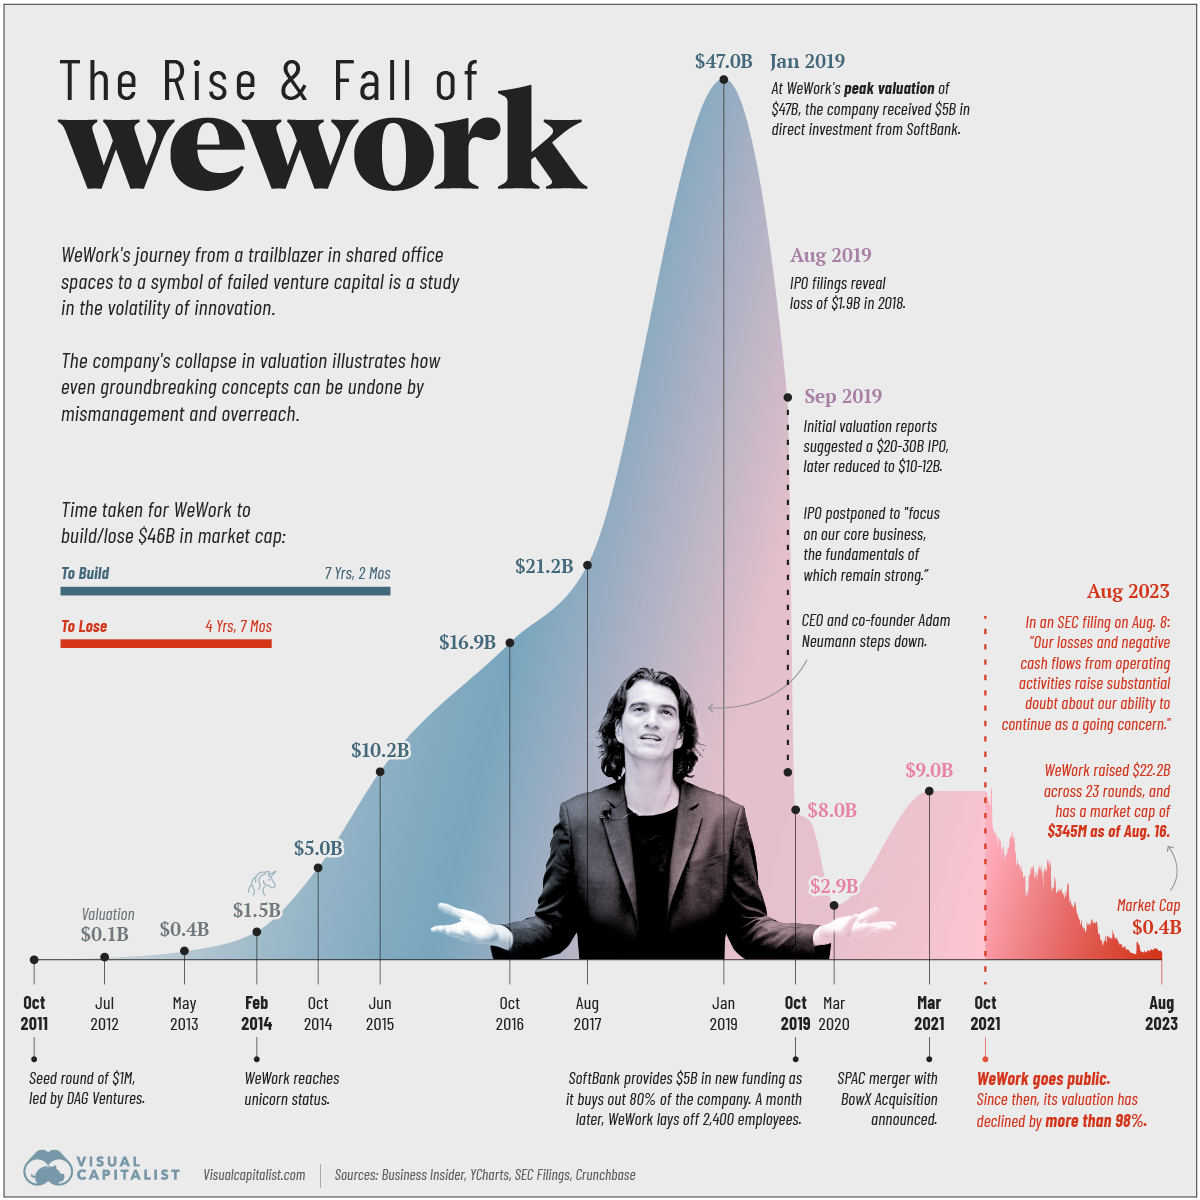
“Our losses and negative cash flows from operating activities raise substantial doubt about our ability to continue as a going concern.” — WeWork, SEC filing, August 8th, 2023.
But how did the once-poster child of Silicon Valley end up seeing its valuation collapse more than 99% from its peak?
Pulling together data from Business Insider, YCharts, SEC Filings, and Crunchbase we follow the rise and fall of WeWork since 2011.
The Rise of WeWork: 2010–2019
WeWork was founded in 2010 by Adam Neumann and Miguel McKelvey with the primary objective of providing shared workspaces catered to freelancers, startups, and companies seeking “flexible office solutions.”
The business model, which rested on renting space from developers long-term, renovating and parceling the property, and subsequently leasing it out to short-term clients, thrived in a decade of low interest rates.
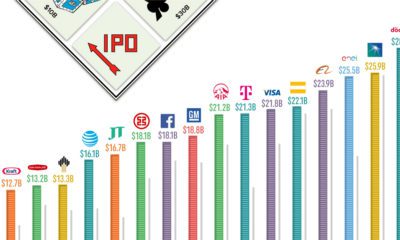
Its valuation surpassed $1 billion in 2014, earning the coveted “unicorn” status. In 2017, SoftBank Group made the first of its total $18.5 billion investment in the company. Two years later, WeWork hit a peak valuation of $47 billion with SoftBank’s continued investments, raising expectations for an imminent IPO.
| Date | WeWork's Valuation |
|---|---|
| October, 2011 | n/a |
| July, 2012 | $97 million |
| May, 2013 | $440 million |
| February, 2014 | $1.5 billion |
| October, 2014 | $5.0 billion |
| June, 2015 | $10.2 billion |
| October, 2016 | $16.9 billion |
| August, 2017 | $21.2 billion |
| January, 2019 | $47.0 billion |
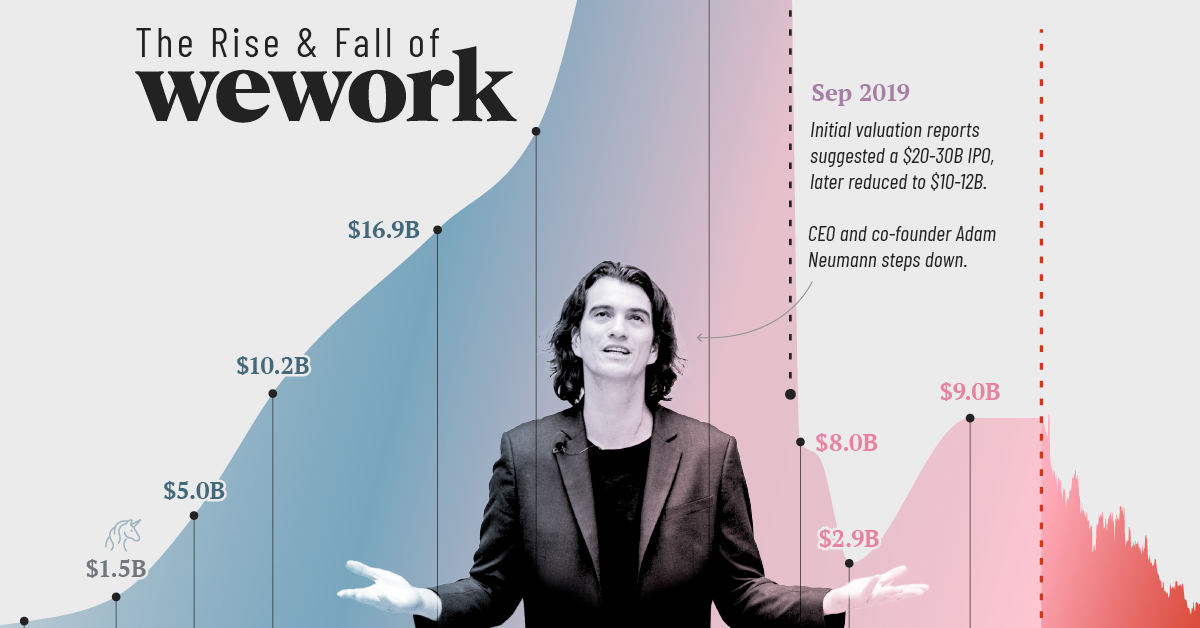
| August, 2019 | $20-30 billion |
| September, 2019 | $10-12 billion |
| October, 2019 | $8.0 billion |
| December, 2019 | $7.3 billion* |
| March, 2020 | $2.9 billion* |
| March, 2021 | $9.0 billion |
| October, 2021 | $9.0 billion |
| August, 2023 | $0.4 billion |
Footnote: *SoftBank valuation is based on discounted cash flow method.
The Fall of WeWork: 2019–2023
Intensive scrutiny fueled by the impending IPO raised several questions for the company. These included concerns around Neumann’s leadership style, excessive spending, creative accounting, and conflicts of interest leading to Neumann’s resignation and delay of the IPO.
In October 2019, SoftBank Group acquired 80% of the company with $5 billion of additional funding. A month later WeWork laid off 2,400 employees, nearly one-fifth of its workforce.
Real estate veteran Sandeep Mathrani was made CEO in 2020, tasked with turning the company around by eliminating recurring costs and restructuring its debt.
That same year the COVID-19 pandemic forced a significant shift to remote work, causing a decline in office space demand. WeWork’s business model, focused on shared physical spaces, faced a substantial challenge.
In 2021, WeWork went public through a SPAC merger, aiming to regain investor trust. The listing reflected a revised strategy focusing on key markets, cost optimization, and a pivot toward catering to larger corporate clients with hybrid work needs.
Over the past two years, its market capitalization as a publicly-traded company has plummeted from $9 billion to under half a billion dollars. WeWork disclosed $11.4 billion in net losses from 2020 through to June 30th, 2023 in their recent SEC filing.
What Happened to WeWork?
Aside from the trials and tribulations of former CEO Adam Neumann, the company’s sustainability itself has been questioned several times over the past decade. In 2019, the Guardian summarized the criticism succinctly by saying, the company was “renting long and subleasing short,” which left it “exposed to risk.”
Post-pandemic, the proliferation of work-from-home policies, along with the rapid rise in global interest rates in the last year—which can reduce cash flows for the commercial real estate industry—have magnified those risks.
WeWork is now battling an environment of excess supply, softer demand, increased competition and macroeconomic volatility, according to interim CEO David Tolley.
“It was foolish of me to invest in WeWork. I was wrong.” — Masayoshi Son, SoftBank Group founder.
The New York Times says that WeWork has more than 18 million square feet of rentable office space in the U.S. and Canada alone and that its failure could have a “sizable impact” on the commercial real estate industry.
At the same time, the Times notes that reporting the “substantial doubt” on continued business operations might help the company buy time with lenders to seek additional capital through issuance of debt, equity, or the sale of assets.


Markets
The European Stock Market: Attractive Valuations Offer Opportunities
On average, the European stock market has valuations that are nearly 50% lower than U.S. valuations. But how can you access the market?


European Stock Market: Attractive Valuations Offer Opportunities
Europe is known for some established brands, from L’Oréal to Louis Vuitton. However, the European stock market offers additional opportunities that may be lesser known.
The above infographic, sponsored by STOXX, outlines why investors may want to consider European stocks.
Attractive Valuations
Compared to most North American and Asian markets, European stocks offer lower or comparable valuations.
| Index | Price-to-Earnings Ratio | Price-to-Book Ratio |
|---|---|---|
| EURO STOXX 50 | 14.9 | 2.2 |
| STOXX Europe 600 | 14.4 | 2 |
| U.S. | 25.9 | 4.7 |
| Canada | 16.1 | 1.8 |
| Japan | 15.4 | 1.6 |
| Asia Pacific ex. China | 17.1 | 1.8 |
Data as of February 29, 2024. See graphic for full index names. Ratios based on trailing 12 month financials. The price to earnings ratio excludes companies with negative earnings.
On average, European valuations are nearly 50% lower than U.S. valuations, potentially offering an affordable entry point for investors.
Research also shows that lower price ratios have historically led to higher long-term returns.
Market Movements Not Closely Connected
Over the last decade, the European stock market had low-to-moderate correlation with North American and Asian equities.
The below chart shows correlations from February 2014 to February 2024. A value closer to zero indicates low correlation, while a value of one would indicate that two regions are moving in perfect unison.
| EURO STOXX 50 | STOXX EUROPE 600 | U.S. | Canada | Japan | Asia Pacific ex. China |
|
|---|---|---|---|---|---|---|
| EURO STOXX 50 | 1.00 | 0.97 | 0.55 | 0.67 | 0.24 | 0.43 |
| STOXX EUROPE 600 | 1.00 | 0.56 | 0.71 | 0.28 | 0.48 | |
| U.S. | 1.00 | 0.73 | 0.12 | 0.25 | ||
| Canada | 1.00 | 0.22 | 0.40 | |||
| Japan | 1.00 | 0.88 | ||||
| Asia Pacific ex. China | 1.00 |
Data is based on daily USD returns.
European equities had relatively independent market movements from North American and Asian markets. One contributing factor could be the differing sector weights in each market. For instance, technology makes up a quarter of the U.S. market, but health care and industrials dominate the broader European market.
Ultimately, European equities can enhance portfolio diversification and have the potential to mitigate risk for investors.
Tracking the Market
For investors interested in European equities, STOXX offers a variety of flagship indices:
| Index | Description | Market Cap |
|---|---|---|
| STOXX Europe 600 | Pan-regional, broad market | €10.5T |
| STOXX Developed Europe | Pan-regional, broad-market | €9.9T |
| STOXX Europe 600 ESG-X | Pan-regional, broad market, sustainability focus | €9.7T |
| STOXX Europe 50 | Pan-regional, blue-chip | €5.1T |
| EURO STOXX 50 | Eurozone, blue-chip | €3.5T |
Data is as of February 29, 2024. Market cap is free float, which represents the shares that are readily available for public trading on stock exchanges.
The EURO STOXX 50 tracks the Eurozone’s biggest and most traded companies. It also underlies one of the world’s largest ranges of ETFs and mutual funds. As of November 2023, there were €27.3 billion in ETFs and €23.5B in mutual fund assets under management tracking the index.
“For the past 25 years, the EURO STOXX 50 has served as an accurate, reliable and tradable representation of the Eurozone equity market.”
— Axel Lomholt, General Manager at STOXX
Partnering with STOXX to Track the European Stock Market
Are you interested in European equities? STOXX can be a valuable partner:
- Comprehensive, liquid and investable ecosystem
- European heritage, global reach
- Highly sophisticated customization capabilities
- Open architecture approach to using data
- Close partnerships with clients
- Part of ISS STOXX and Deutsche Börse Group
With a full suite of indices, STOXX can help you benchmark against the European stock market.
Learn how STOXX’s European indices offer liquid and effective market access.

-

 Economy3 days ago
Economic Growth Forecasts for G7 and BRICS Countries in 2024
The IMF has released its economic growth forecasts for 2024. How do the G7 and BRICS countries compare?
-

 Markets2 weeks ago
U.S. Debt Interest Payments Reach $1 Trillion
U.S. debt interest payments have surged past the $1 trillion dollar mark, amid high interest rates and an ever-expanding debt burden.
-

 United States2 weeks ago
Ranked: The Largest U.S. Corporations by Number of Employees
We visualized the top U.S. companies by employees, revealing the massive scale of retailers like Walmart, Target, and Home Depot.
-

 Markets2 weeks ago
The Top 10 States by Real GDP Growth in 2023
This graphic shows the states with the highest real GDP growth rate in 2023, largely propelled by the oil and gas boom.
-

 Markets2 weeks ago
Ranked: The World’s Top Flight Routes, by Revenue
In this graphic, we show the highest earning flight routes globally as air travel continued to rebound in 2023.
-

 Markets3 weeks ago
Ranked: The Most Valuable Housing Markets in America
The U.S. residential real estate market is worth a staggering $47.5 trillion. Here are the most valuable housing markets in the country.


-

 Debt1 week ago
How Debt-to-GDP Ratios Have Changed Since 2000
-
Markets2 weeks ago
Ranked: The World’s Top Flight Routes, by Revenue
-

 Countries2 weeks ago
Population Projections: The World’s 6 Largest Countries in 2075
-
Markets2 weeks ago
The Top 10 States by Real GDP Growth in 2023
-

 Demographics2 weeks ago
The Smallest Gender Wage Gaps in OECD Countries
-

 United States2 weeks ago
Where U.S. Inflation Hit the Hardest in March 2024
-

 Green2 weeks ago
Top Countries By Forest Growth Since 2001
-
United States2 weeks ago
Ranked: The Largest U.S. Corporations by Number of Employees