Financing
Visualizing the Stages of Startup Funding
About 1,500 new companies are founded every day.
However, only a fraction of these entrepreneurial pursuits will eventually operate on a grand scale. With many of these companies propelled by venture capital funding, how do investors provide the cash—and get a piece of the startup pie?
Pie in the Sky
Today’s creative infographic from Fundera uses pie to visualize each stage of startup funding, from pre-seed funding to initial public offering.
It’s worth noting that numbers presented here are hypothetical in nature, and that startups can have all kinds of paths to success (or failure).
Pre-Seed Funding
In the pre-seed funding round, the founder(s) pitch their business idea to potential investors. These are typically friends, family, angel investors, or pre-seed venture capital firms.
Since there is likely no performance data or positive financials to show yet, potential investors must focus on two primary features: the strength of the idea and the team.
The biggest factor in our decision-making is always the founding team […] that’s what success lives or dies on in this industry: the ability for founders to make really quick, good decisions.
At this stage, both the level of risk and potential payoff are at their highest.
Seed Funding
After the initial stages, seed funding—the first official funding round for many companies—takes place. Entrepreneurs use the funds for market testing, product development, and bringing operations up to speed.
By this point, investors are generally looking for the company’s ability to solve a need for customers in a way that will achieve product-market fit. At this stage, ideally there is also some level of traction or consumer adoption, such as user or revenue growth. The level of risk is still quite high here, so investors tend to be angel investors or venture capitalists.
Series Funding
In each series funding, the startup generally raises more money and increases their valuation. Here’s what investors tend to expect in each round:
- Series A: Companies that not only have a great idea, but a strategy for creating long-term profit.
- Series B: Companies generating consistent revenue that must scale to meet growing demand.
- Series C (and beyond): Companies with strong financial performance that are looking to expand to new markets, develop new products, buy out businesses, or prepare for an Initial Public Offering (IPO).
Private equity firms and investment bankers are attracted to series C funding as it tends to be much less risky. In recent years, startups have been staying private longer. For example, Uber obtained Series G funding and debt financing before going public.
Initial Public Offering
Once a company is large and stable enough, it may choose to go public. An investment bank will commit to selling a certain amount of shares for a certain amount of money.
If the IPO goes well, investors will profit and the company’s reputation gets a boost—but if it doesn’t, investors lose money and the company’s reputation takes a hit.
Here’s how the example investment amounts break down at each stage:
| Pre-Seed | Seed | Series A | Series B | Series C | IPO | |
|---|---|---|---|---|---|---|
| Amount Invested | < $1M | <$1.7M | <$10.5M | <$24.9M | <$50M | <$10.5M |
| Average Equity Stake | 10-15% | 10-25% | 15-50% | 15-30% | 15-30% | 15-50% |
An investor’s equity is diluted as other investors come on board, but their “piece of the pie” usually becomes more valuable.
The Venture Capital Funnel
How likely is it that a startup makes its way through the entire process? In a study of over 1,110 U.S. seed tech companies, only 30% exited through an IPO, merger, or acquisition (M&A).
Companies that reach a private valuation of $1B or more, known as unicorns, are even more rare at just 1%.
At each stage, natural selection takes hold with fewer companies advancing. Here’s a look at the entire funnel, with the “second round” generally corresponding to a series A stage, a “third round” generally corresponding to a series B stage, and so on.
Source: CB Insights
Notably, 67% of the companies stalled out at some point in the funding process, becoming either dead or self-sustaining. While startups carry a high degree of risk, they also present opportunities for substantial rewards.


Finance
Charted: How Long Does it Take Unicorns to Exit?
There are roughly 1,400 unicorns—startups worth $1 billion or more. How many years does it take these giants to get acquired or go public?
 Creator Program
How Long Does it Take For Unicorns to Exit?
For most unicorns—startups with a $1 billion valuation or more—it can take years to see a liquidity event.
Take Twitter, which went public seven years after its 2006 founding. Or Uber, which had an IPO after a decade of operation in 2019. After all, companies first have to succeed and build up their valuation in order to not go bankrupt or dissolve. Few are able to succeed and capitalize in a quick and tidy manner.
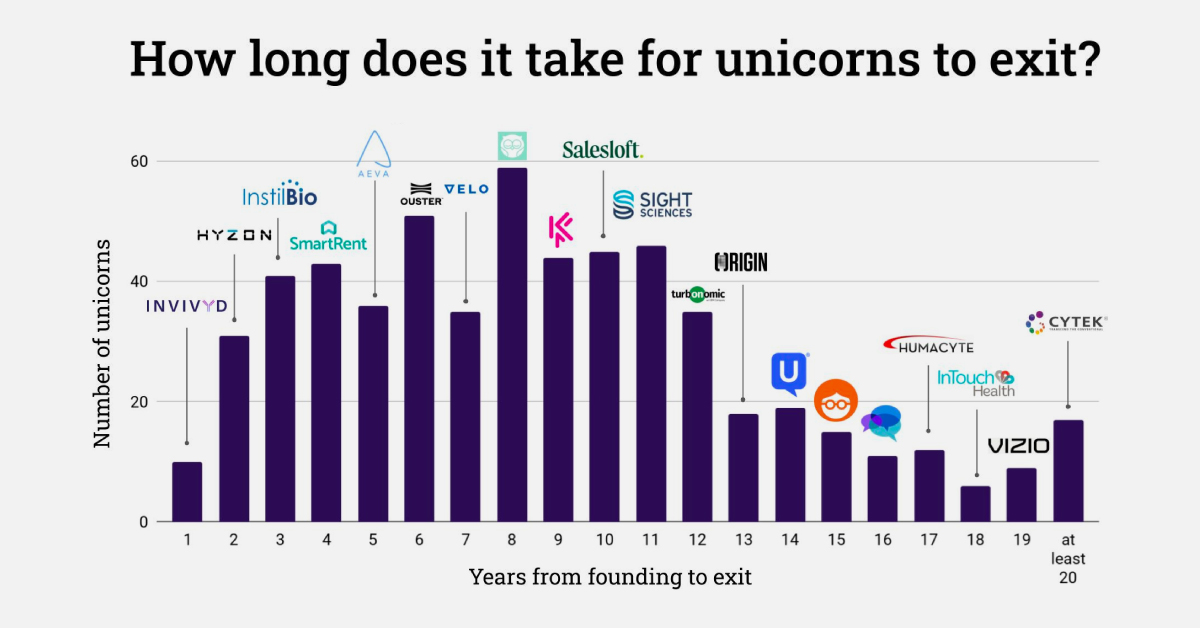
So when do unicorns exit, either successfully through an IPO or acquisition, or unsuccessfully through bankruptcy or liquidation? The above visualization from Ilya Strebulaev breaks down the time it took for 595 unicorns to exit from 1997 to 2022.
Unicorns: From Founding to Exit
Here’s how unicorn exits broke down over the last 25 years. Data was collected by Strebulaev at the Venture Capital Initiative in Stanford and covers exits up to October 2022:
| Years (Founding to Exit) | Unicorn Example | Number of Unicorns 1997‒2022 |
|---|---|---|
| 1 | YouTube | 10 |
| 2 | 31 | |
| 3 | Groupon | 41 |
| 4 | Zynga | 43 |
| 5 | Salesforce | 36 |
| 6 | Alphabet (Google) | 51 |
| 7 | Tesla | 35 |
| 8 | Zoom | 59 |
| 9 | Coursera | 44 |
| 10 | Uber Technologies | 45 |
| 11 | WeWork | 46 |
| 12 | Airbnb | 35 |
| 13 | Credit Karma | 18 |
| 14 | SimilarWeb | 19 |
| 15 | 23andMe | 15 |
| 16 | Sonos | 11 |
| 17 | Roblox | 12 |
| 18 | Squarespace | 6 |
| 19 | Vizio | 9 |
| >20 | Cytek | 17 |
Overall, unicorns exited after a median of eight years in business.
Companies like Facebook, LinkedIn, and Indeed are among the unicorns that exited in exactly eight years, which in total made up 10% of tracked exits. Another major example is Zoom, which launched in 2011 and went public in 2019 at a $9.2 billion valuation.
There were also many earlier exits, such as YouTube’s one-year turnaround from 2005 founding to 2006 acquisition by Google. Groupon also had an early exit just three years after its founding in 2008, after turning down an even earlier acquisition exit (also through Google).
In total, unicorn exits within 11 years or less accounted for just over three-quarters of tracked exits from 1997 to 2022. Many of the companies that took longer to exit also took longer to reach unicorn status, including website company Squarespace, which was founded in 2003 but didn’t reach a billion-dollar valuation until 2017 (and listed on the NYSE in 2021).
Unicorns, by Exit Strategy
Broadly speaking, there are three main types of exits: going public through an IPO, SPAC, or direct listing, being acquired, or liquidation/bankruptcy.
The most well-known are IPOs, or initial public offerings. These are the most common types of unicorn exits in strong market conditions, with 2021 seeing 79 unicorn IPOs globally, with $83 billion in proceeds.
| 2021 | 2022 | % Change | |
|---|---|---|---|
| # Unicorn IPOs | 79 | 13 | -84% |
| Proceeds | $82.9B | $5.3B | -94% |
But the number of IPOs drops drastically given weaker market performance, as seen above. At the end of 2022, an estimated 91% of unicorn IPOs listed since 2021 had share prices fall below their IPO price.
A less common unicorn exit is an SPAC (special purpose acquisition company), although they’ve been gaining momentum and were used by WeWork and BuzzFeed. With an SPAC, a shell company raises money in an IPO and merges with a private company to take it public.
Finally, while an IPO lists new shares to the public with an underwriter, a direct listing sells existing shares without an underwriter. Though it was historically seen as a cheaper IPO alternative, some well-known unicorns have used direct listings including Roblox and Coinbase.
And as valuations for unicorns (and their public listings) have grown, acquisitions have become less frequent. Additionally, many major firms have been buying back shares since 2022 to shore up investor confidence instead of engaging in acquisitions.
Slower Exit Activity
While the growth of unicorns has been exponential over the last decade, exit activity has virtually ground to a halt in 2023.
Investor caution and increased conservation of capital have contributed to the lack of unicorn exits. As of the second quarter of 2023, just eight unicorns in the U.S. exited. These include Mosaic ML, an artificial intelligence startup, and carbon recycling firm LanzaTech.
As exit activity declines, companies may halt listing plans and eventually slow expansion and cut costs. What’s uncertain is whether or not this lull in unicorn exits—and declining influx of private capital influx—is temporary or part of a long-term readjustment.

-

 Mining2 weeks ago
Charted: The Value Gap Between the Gold Price and Gold Miners
-

 Real Estate1 week ago
Ranked: The Most Valuable Housing Markets in America
-

 Business1 week ago
Charted: Big Four Market Share by S&P 500 Audits
-

 AI1 week ago
The Stock Performance of U.S. Chipmakers So Far in 2024
-

 Misc1 week ago
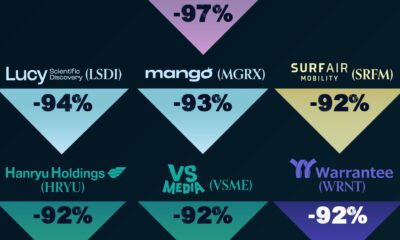
Almost Every EV Stock is Down After Q1 2024
-

 Money2 weeks ago
Where Does One U.S. Tax Dollar Go?
-

 Green2 weeks ago
Ranked: Top Countries by Total Forest Loss Since 2001
-

 Real Estate2 weeks ago
Visualizing America’s Shortage of Affordable Homes