Markets
The Economic Impact of COVID-19, According to Business Leaders
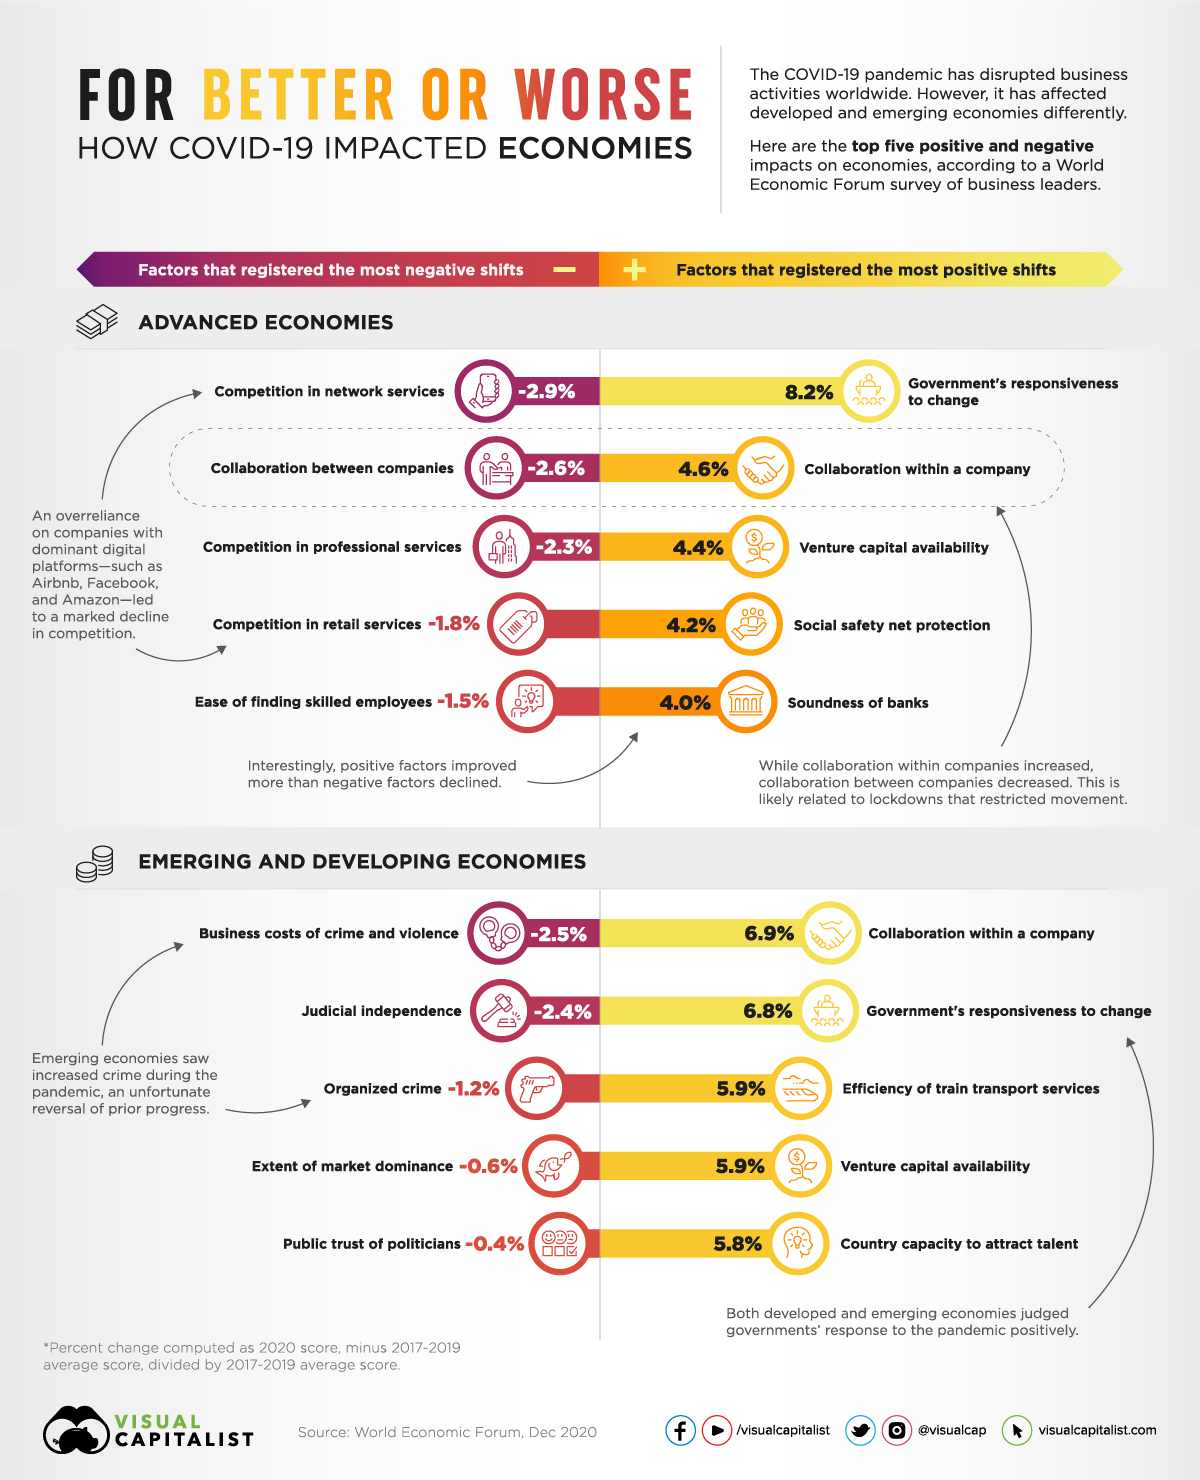


The Economic Impact of COVID-19: Positives and Negatives
The global pandemic has disrupted business activities worldwide. But COVID-19’s economic impact has varied across regions, and the consequences have been largely dependent on a region’s economic position.
Using survey data from the World Economic Forum’s 20th Global Competitiveness Report, this graphic showcases the economic impact of COVID-19 worldwide. This year’s survey was conducted between February and July 2020 and includes responses from 11,866 business executives across 126 economies.
As you’ll see, the data was collected with the specific focus of contrasting the pandemic’s effects on developing economies compared to advanced economies.
Top Negative Impacts of COVID-19
By comparing business leaders’ responses in 2020 to their answers over the last three years, some clear trends have emerged.
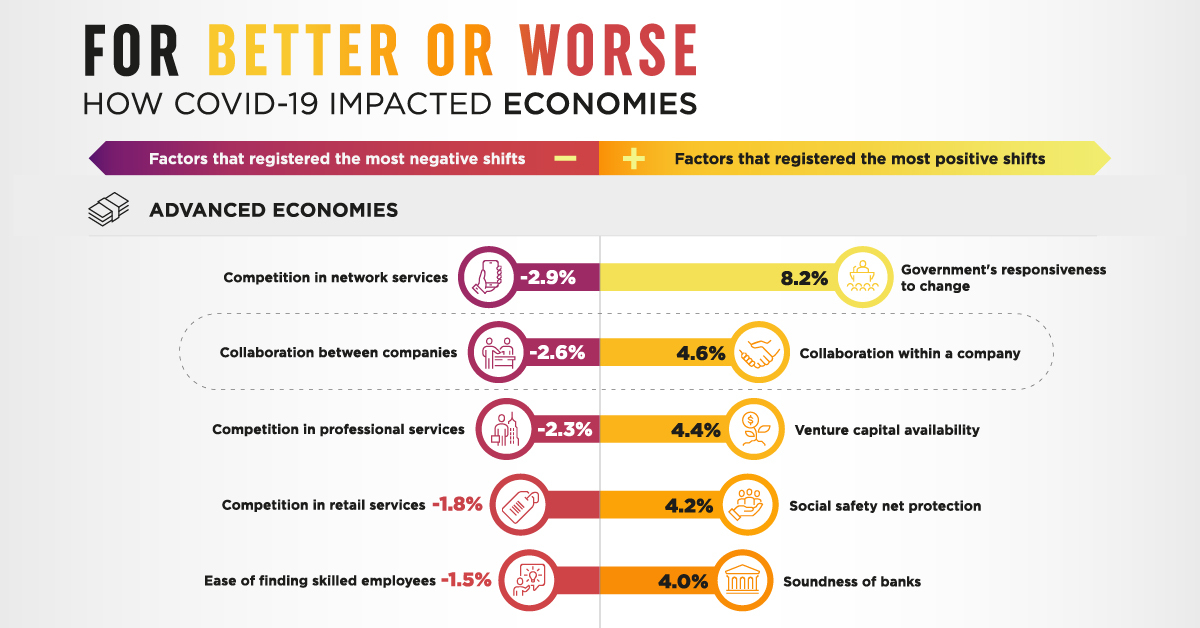
In advanced economies, the top negative economic impact of COVID-19 has been a decline in competition, followed by reduced collaboration between companies and a growing challenge in finding and hiring skilled workers:
| Rank | Factor | % Change (2020 vs. 3-Yr Avg) |
|---|---|---|
| 1 | Competition in network services | -2.9% |
| 2 | Collaboration between companies | -2.6% |
| 3 | Competition in professional services | -2.3% |
| 4 | Competition in retail services | -1.8% |
| 5 | Ease of finding skilled employees | -1.5% |
What’s driving this reduced competition in advanced economies?
One factor could be the increased use of online platforms. Ecommerce is heavily dominated by a select number of retailers. Because of this, bigger retailers like Amazon have seen massive boosts in their online sales, while many smaller brick-and-mortar businesses have been struggling.
While negative impacts on advanced economies are centered around market concentration and talent gaps, developing countries have faced different problems this year, like increased crime and governance issues:
| Rank | Factor | % Change (2020 vs. 3-Yr Avg) |
|---|---|---|
| 1 | Business costs of crime and violence | -2.5% |
| 2 | Judicial independence | -2.4% |
| 3 | Organized crime | -1.2% |
| 4 | Extent of market dominance | -0.6% |
| 5 | Public trust of politicians | -0.4% |
It’s important to note that in the 2018 and 2019 surveys, organized crime and business costs related to crime and violence were trending downward. Because of this, the World Economic Forum suggests that we consider this year’s increase in these areas as as a temporary COVID-induced setback rather than a long-term issue.
Top Positive Impacts of COVID-19
Despite the struggles brought on by COVID-19, the pandemic has also triggered positive change. In fact, business leaders perceived more positive developments this year than negative ones.
In advanced economies, the top positive impacts were government responsiveness to change, followed by internal collaboration within companies:
| Rank | Factor | % Change (2020 vs. 3-Yr Avg) |
|---|---|---|
| 1 | Government's responsiveness to change | 8.2% |
| 2 | Collaboration within a company | 4.6% |
| 3 | Venture capital availability | 4.4% |
| 4 | Social safety net protection | 4.2% |
| 5 | Soundness of banks | 4.0% |
Interestingly, internal collaboration improved while external collaboration got worse. This is likely because companies had to adapt to changing work environments, while also learning how to collaborate with one another through remote working.
Internal collaboration didn’t just improve in advanced economies. In fact, developing economies experienced several of the top positive impacts that advanced economies saw as well:
| Rank | Factor | % Change (2020 vs. 3-Yr Avg) |
|---|---|---|
| 1 | Collaboration within a company | 6.9% |
| 2 | Government's responsiveness to change | 6.8% |
| 3 | Efficiency of train transport services | 5.9% |
| 4 | Venture capital availability | 5.9% |
| 5 | Country capacity to attract talent | 5.8% |
While perceptions on official responsiveness to change increased, public trust in politicians decreased slightly. This indicates that, while government responses to COVID-19 may have been received well in developing economies, overall feelings towards political leaders did not waiver.
How Have Countries Stayed Strong During the Pandemic?
While the impacts of COVID-19 varied between advanced and developing economies, business leaders across the board identified some common features that helped countries remain resilient:
- Economic digitization and digital skills
Social distancing has been a key response to the pandemic. Because of this, countries that were set up for remote work have fared better than others. Netherlands, New Zealand, and Finland are a few examples. - Safety nets and financial soundness
Countries with established support systems for companies and citizens were in a better position to keep their economies afloat. Denmark and Norway provided much-needed support to their households, while Taiwan and the U.S. were able to aid businesses thanks to strong financial systems. - Governance and planning
Balancing health priorities with economic and fiscal policies was a delicate dance this year. Countries that provided relatively stable political frameworks were Singapore, Luxembourg, Austria, and the United Arab Emirates. - Healthcare system and R&D
A strong healthcare system meant widespread access to health services needed during the pandemic, as well as established public health protocols. Japan, Spain, and Taiwan were good examples of this.
Will these key features of competitiveness remain effective measures of a strong economy in 2021, or will our benchmarks for success evolve post-pandemic?


Markets
The European Stock Market: Attractive Valuations Offer Opportunities
On average, the European stock market has valuations that are nearly 50% lower than U.S. valuations. But how can you access the market?


European Stock Market: Attractive Valuations Offer Opportunities
Europe is known for some established brands, from L’Oréal to Louis Vuitton. However, the European stock market offers additional opportunities that may be lesser known.
The above infographic, sponsored by STOXX, outlines why investors may want to consider European stocks.
Attractive Valuations
Compared to most North American and Asian markets, European stocks offer lower or comparable valuations.
| Index | Price-to-Earnings Ratio | Price-to-Book Ratio |
|---|---|---|
| EURO STOXX 50 | 14.9 | 2.2 |
| STOXX Europe 600 | 14.4 | 2 |
| U.S. | 25.9 | 4.7 |
| Canada | 16.1 | 1.8 |
| Japan | 15.4 | 1.6 |
| Asia Pacific ex. China | 17.1 | 1.8 |
Data as of February 29, 2024. See graphic for full index names. Ratios based on trailing 12 month financials. The price to earnings ratio excludes companies with negative earnings.
On average, European valuations are nearly 50% lower than U.S. valuations, potentially offering an affordable entry point for investors.
Research also shows that lower price ratios have historically led to higher long-term returns.
Market Movements Not Closely Connected
Over the last decade, the European stock market had low-to-moderate correlation with North American and Asian equities.
The below chart shows correlations from February 2014 to February 2024. A value closer to zero indicates low correlation, while a value of one would indicate that two regions are moving in perfect unison.
| EURO STOXX 50 | STOXX EUROPE 600 | U.S. | Canada | Japan | Asia Pacific ex. China |
|
|---|---|---|---|---|---|---|
| EURO STOXX 50 | 1.00 | 0.97 | 0.55 | 0.67 | 0.24 | 0.43 |
| STOXX EUROPE 600 | 1.00 | 0.56 | 0.71 | 0.28 | 0.48 | |
| U.S. | 1.00 | 0.73 | 0.12 | 0.25 | ||
| Canada | 1.00 | 0.22 | 0.40 | |||
| Japan | 1.00 | 0.88 | ||||
| Asia Pacific ex. China | 1.00 |
Data is based on daily USD returns.
European equities had relatively independent market movements from North American and Asian markets. One contributing factor could be the differing sector weights in each market. For instance, technology makes up a quarter of the U.S. market, but health care and industrials dominate the broader European market.
Ultimately, European equities can enhance portfolio diversification and have the potential to mitigate risk for investors.
Tracking the Market
For investors interested in European equities, STOXX offers a variety of flagship indices:
| Index | Description | Market Cap |
|---|---|---|
| STOXX Europe 600 | Pan-regional, broad market | €10.5T |
| STOXX Developed Europe | Pan-regional, broad-market | €9.9T |
| STOXX Europe 600 ESG-X | Pan-regional, broad market, sustainability focus | €9.7T |
| STOXX Europe 50 | Pan-regional, blue-chip | €5.1T |
| EURO STOXX 50 | Eurozone, blue-chip | €3.5T |
Data is as of February 29, 2024. Market cap is free float, which represents the shares that are readily available for public trading on stock exchanges.
The EURO STOXX 50 tracks the Eurozone’s biggest and most traded companies. It also underlies one of the world’s largest ranges of ETFs and mutual funds. As of November 2023, there were €27.3 billion in ETFs and €23.5B in mutual fund assets under management tracking the index.
“For the past 25 years, the EURO STOXX 50 has served as an accurate, reliable and tradable representation of the Eurozone equity market.”
— Axel Lomholt, General Manager at STOXX
Partnering with STOXX to Track the European Stock Market
Are you interested in European equities? STOXX can be a valuable partner:
- Comprehensive, liquid and investable ecosystem
- European heritage, global reach
- Highly sophisticated customization capabilities
- Open architecture approach to using data
- Close partnerships with clients
- Part of ISS STOXX and Deutsche Börse Group
With a full suite of indices, STOXX can help you benchmark against the European stock market.
Learn how STOXX’s European indices offer liquid and effective market access.

-

 Economy2 days ago
Economic Growth Forecasts for G7 and BRICS Countries in 2024
The IMF has released its economic growth forecasts for 2024. How do the G7 and BRICS countries compare?
-

 Markets2 weeks ago
U.S. Debt Interest Payments Reach $1 Trillion
U.S. debt interest payments have surged past the $1 trillion dollar mark, amid high interest rates and an ever-expanding debt burden.
-

 United States2 weeks ago
Ranked: The Largest U.S. Corporations by Number of Employees
We visualized the top U.S. companies by employees, revealing the massive scale of retailers like Walmart, Target, and Home Depot.
-

 Markets2 weeks ago
The Top 10 States by Real GDP Growth in 2023
This graphic shows the states with the highest real GDP growth rate in 2023, largely propelled by the oil and gas boom.
-

 Markets2 weeks ago
Ranked: The World’s Top Flight Routes, by Revenue
In this graphic, we show the highest earning flight routes globally as air travel continued to rebound in 2023.
-

 Markets3 weeks ago
Ranked: The Most Valuable Housing Markets in America
The U.S. residential real estate market is worth a staggering $47.5 trillion. Here are the most valuable housing markets in the country.


-

 Debt1 week ago
How Debt-to-GDP Ratios Have Changed Since 2000
-
Markets2 weeks ago
Ranked: The World’s Top Flight Routes, by Revenue
-

 Countries2 weeks ago
Population Projections: The World’s 6 Largest Countries in 2075
-
Markets2 weeks ago
The Top 10 States by Real GDP Growth in 2023
-

 Demographics2 weeks ago
The Smallest Gender Wage Gaps in OECD Countries
-

 United States2 weeks ago
Where U.S. Inflation Hit the Hardest in March 2024
-

 Green2 weeks ago
Top Countries By Forest Growth Since 2001
-
United States2 weeks ago
Ranked: The Largest U.S. Corporations by Number of Employees