Currency
How Every Asset Class, Currency, and S&P 500 Sector Performed in 2020
Corresponding assets in the graphic top to bottom were measured using: XAGUSD, XAUUSD, Russell 2000, S&P 500, MSCI EM, Bloomberg Barclays Corporate Bonds Index, MSCI EAFE, iShares Trust US Treasury Bond ETF, S&P/TSX Composite, S&P GSCI, DXY, Dow Jones Real Estate Index, WTI U.S. Oil.


How Every Market Performed in 2020
It has been a volatile year for financial markets and their participants, with some of the largest price fluctuations imaginable across just about every single asset.
Despite the volatility, the combination of the Federal Reserve’s early stimulus interventions and positive vaccine news has rewarded dip-buyers and strong hands.
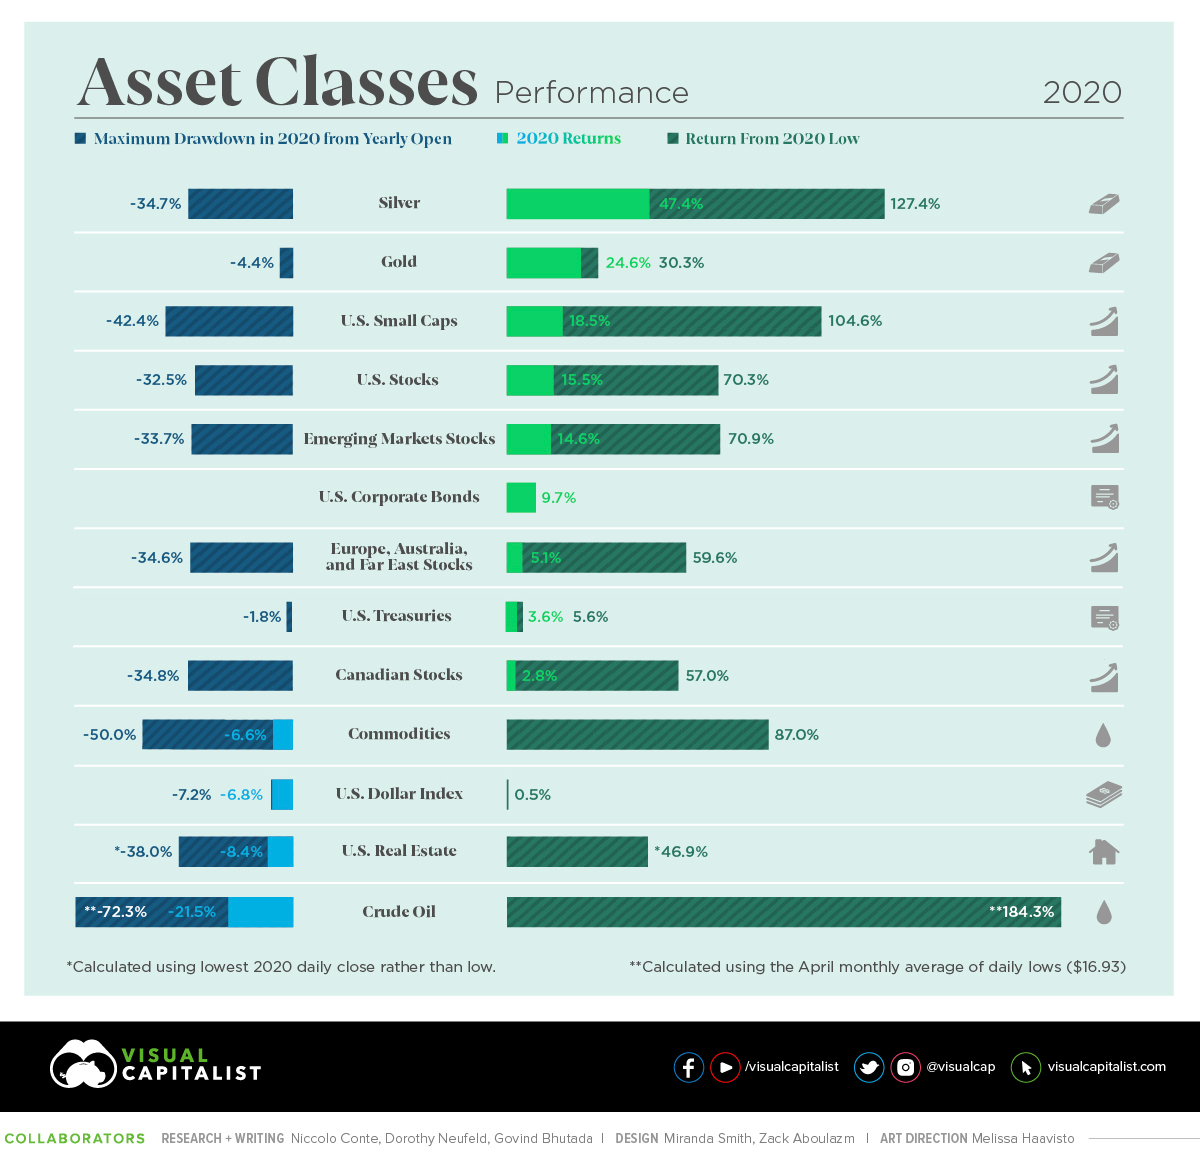
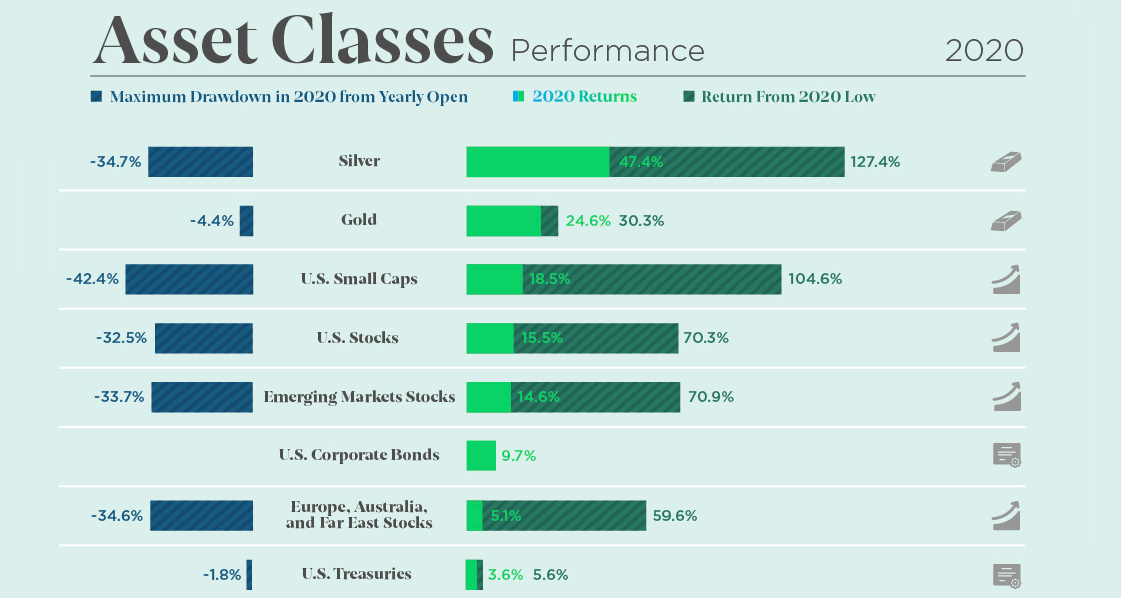
Along with visualizing the returns across asset classes, currencies, and S&P 500 sectors, we’ve included their maximum drawdown for the year—the drop from the 2020 open to the 2020 lows—along with the recovery from 2020 lows to the closing price.
This helps visualize 2020’s most resilient assets, along with the strength of their recovery.
Markets Roundup for 2020
Of all the major asset classes, precious metals provided the best returns last year.
- Gold finished the year up 24.6%, but down from its all-time highs of $2,075/oz achieved on August 7th.
- Gold was also a resilient asset. Thanks to its strong start in January (4.8%), when March came around gold held up and only fell 4.4% below the yearly open.
- Silver’s performance over the year was also sterling, offering investors 47.4% returns despite a -34.7% pullback in March.
Here’s a look at how all major asset classes performed over the course of the year:
| Asset Class | 2020 Return | Asset Type |
|---|---|---|
| Silver | 47.4% | Precious Metal |
| Gold | 24.6% | Precious Metal |
| U.S. Small Caps | 18.5% | Equities |
| U.S. Stocks | 15.5% | Equities |
| Emerging Markets | 14.6% | Equities |
| U.S. Corporate Bonds | 9.7% | Bonds |
| Europe, Australia, Far East | 5.1% | Equities |
| U.S. Treasuries | 3.6% | Bonds |
| Canadian Stocks | 2.8% | Equities |
| Commodities | -6.6% | Commodity |
| U.S. Dollar | -6.8% | Currency |
| U.S. Real Estate | -8.4% | Real Estate |
| Crude Oil | -21.5% | Commodity |
U.S. equities and emerging market equities had double-digit returns despite the tumultuous year. Small cap stocks in the Russell 2000 outpaced the S&P 500 by 3%, but also saw a steeper drawdown during times of volatility.
Although there were some wild drawdowns in 2020, nothing compared to the drop into negative prices for WTI crude oil that occurred in April. Futures traded all the way down to -$37.63 a barrel when travel cancellations brought oil demand to a standstill and supply cut agreements weren’t reached by OPEC members.
U.S. government and corporate bonds had a positive year, however their returns were primarily driven by support from the Federal Reserve’s monetary policy and market operations. The Federal Reserve increased its portfolio of Treasury notes and bonds by 79% since March, with its total assets reaching $7.3 trillion at the end of 2020.
Performance by S&P 500 Sector
Unsurprisingly, the energy sector was hit the hardest last year, with value sectors generally struggling to perform compared to growth sectors.
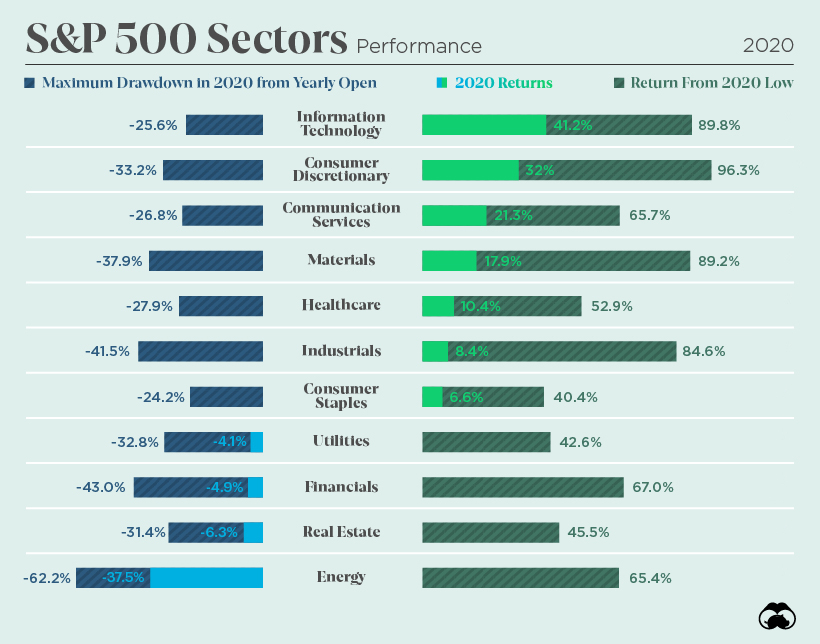
Information technology continued to outperform like in 2019, with Amazon (76%), Apple (81%), and Netflix (66%) the three best performing FAANG members. Other tech stocks like Nvidia (121%), Paypal (115%), and AMD (100%) comfortably sailed to new all-time highs with triple-digit returns for 2020.
As the communication services (21.3%) and consumer discretionary (32%) sectors also performed well, the latter saw the biggest bounce from the lows of any S&P 500 sector (96%).
Foreign Exchange Performance in 2020
Early on in the year, major currencies generally followed similar patterns as they all fell against the U.S. dollar in March’s flight to safety.
The Swiss franc was one of the most resilient currencies, drawing down only -2.1% from the 2020 open. It was also one of the best performers at the end of the year alongside the euro and Australian dollar with gains of 9% or more.
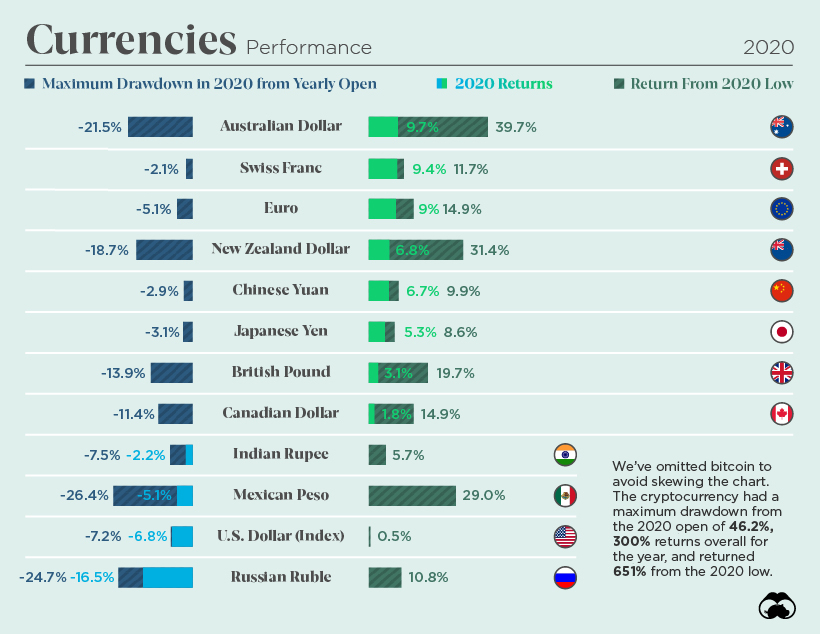
Timing the dip on the Australian or New Zealand dollar was the most rewarding opportunity for forex traders last year. Meanwhile, the Indian rupee, Mexican peso, and Russian ruble weren’t able to claw back the points they lost in March, with the ruble seeing double-digit losses.
All eyes have been on the U.S. dollar’s free-fall downwards since it spiked up in March, and as the Biden administration prepares to take office, speculative traders have returned to selling dollars.
Winners and Losers of 2020
The COVID-19 pandemic largely defined many of the winners and losers of 2020, as did the Federal Reserve’s expansion of the U.S. money supply.
Zoom became an essential communications service in lockdown and Moderna and Novavax shares skyrocketed in valuation as they announced their COVID-19 vaccines.
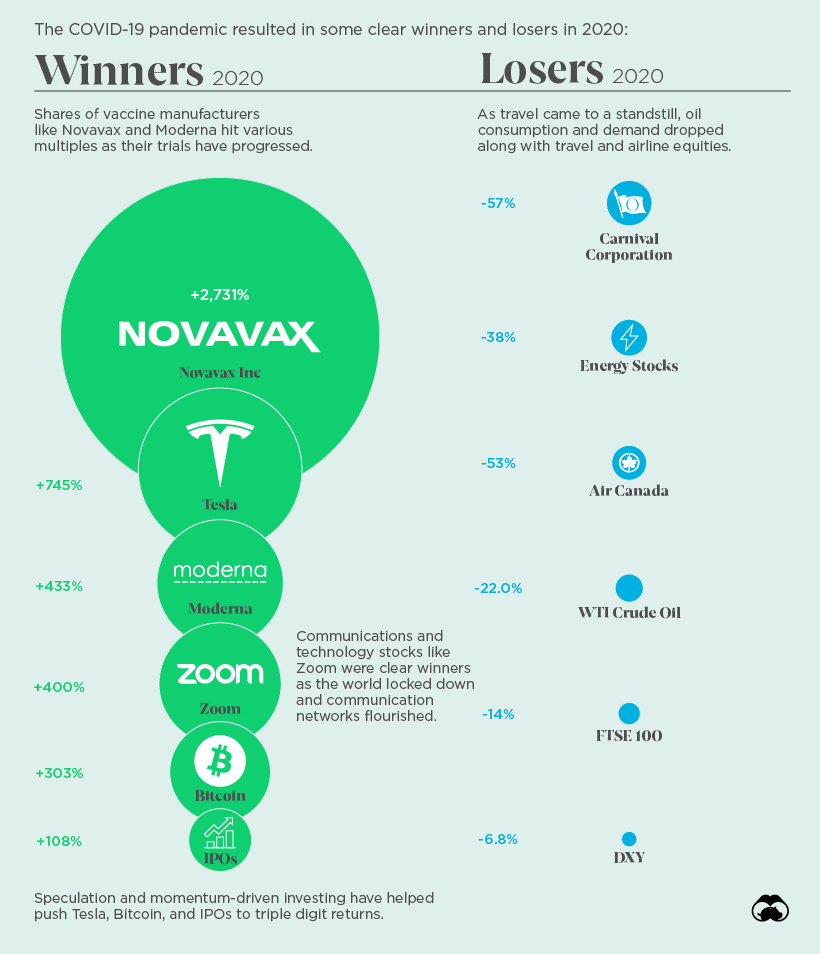
Bitcoin broke well beyond its previous all-time high, returning just over 300% from the 2020 open and more than 650% from the lows. Tesla had an even more spectacular run, returning 745% and making Elon Musk the second-richest man in the world.
Meanwhile, as global travel quickly came to a halt last year, Carnival Corporation (the world’s biggest cruise operator) and Air Canada suffered double-digit losses along with WTI crude oil and much of the energy sector and travel industry.
Vaccine rollouts and the U.S. stimulus bill are the current known-unknowns that the market is pricing in for this upcoming year, and investors will be watching to see if the dollar’s downturn will be reversed, or if the world’s major reserve currency will continue to decline in 2021.


Money
Visualizing All of the U.S. Currency in Circulation
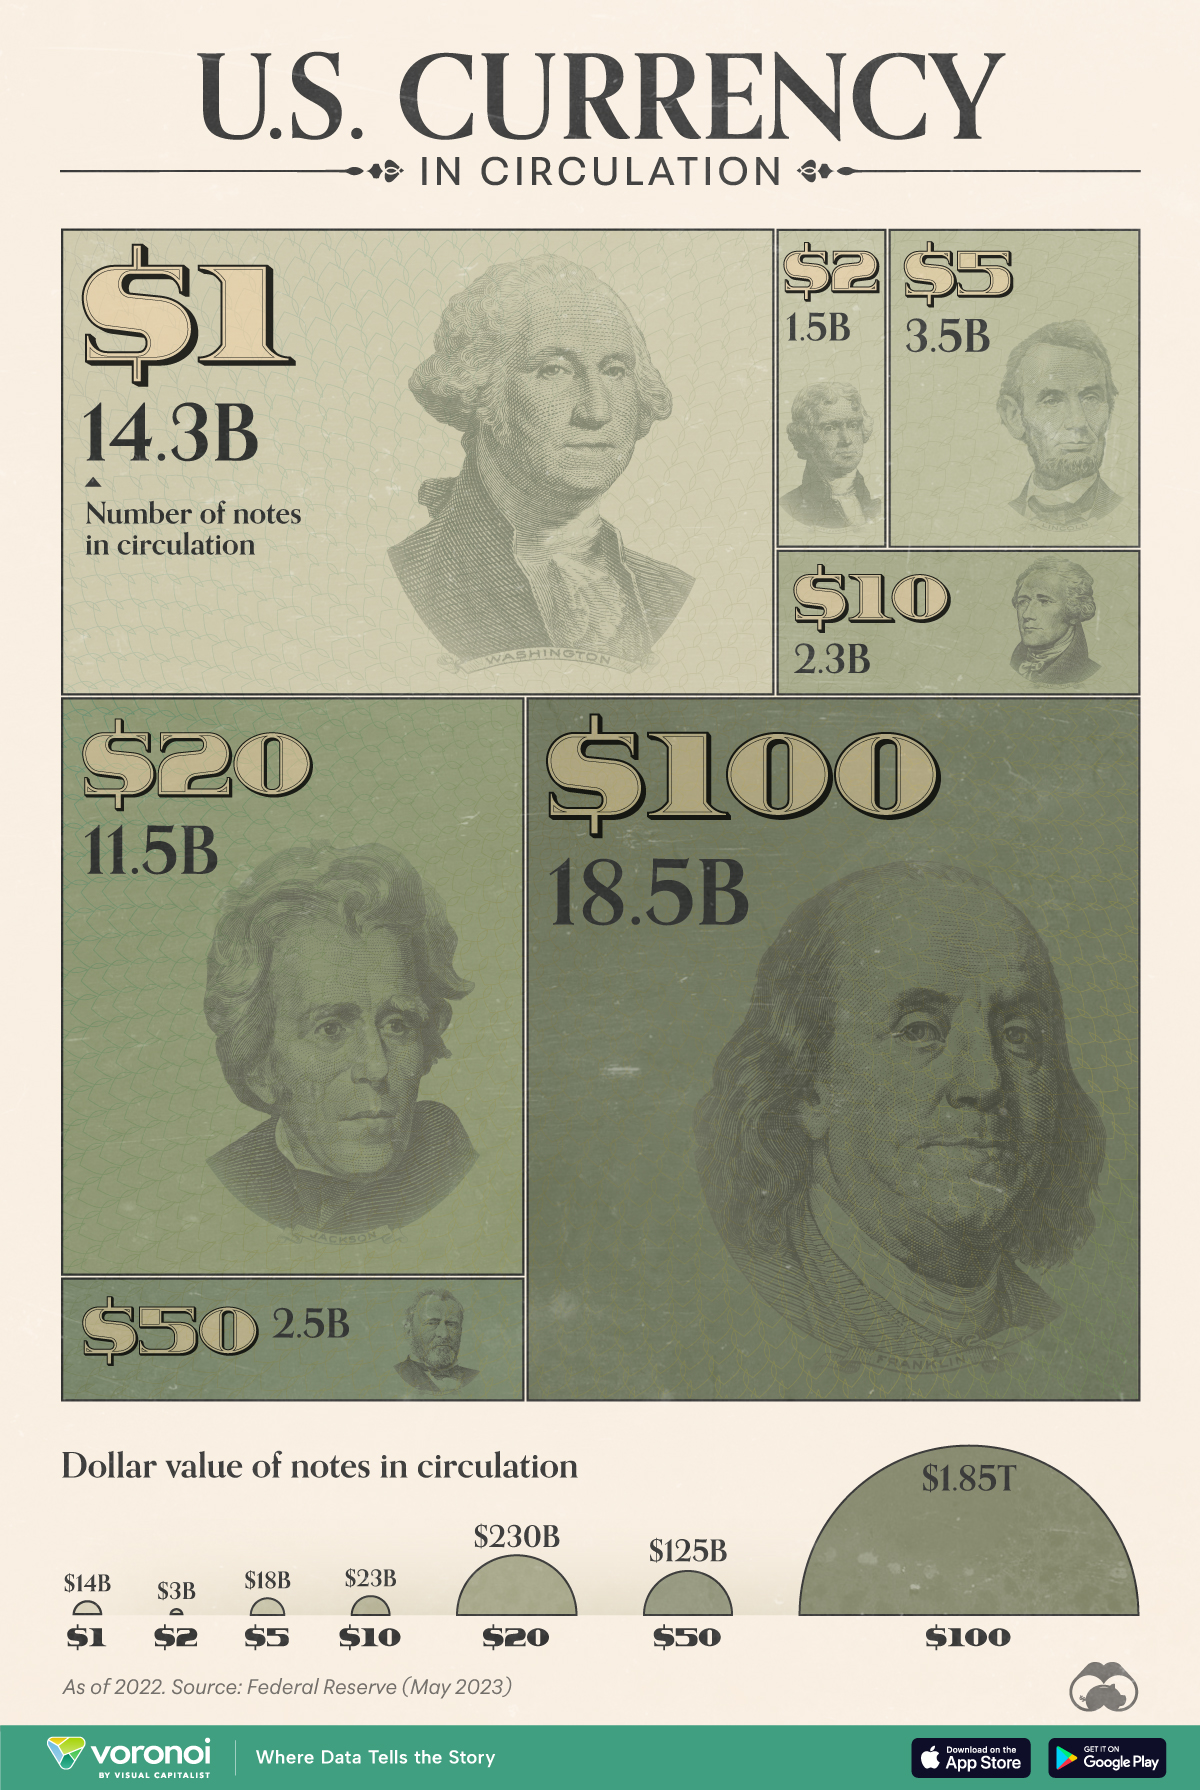
This graphic illustrates the amount of U.S. currency in circulation globally, by denomination, based on data from the Federal Reserve.
Visualizing All of the U.S. Currency in Circulation
This was originally posted on our Voronoi app. Download the app for free on iOS or Android and discover incredible data-driven charts from a variety of trusted sources.
Have you ever wondered how much U.S. currency is in circulation?
Every year, the U.S. Federal Reserve submits a print order for U.S. currency to the Treasury Department’s Bureau of Engraving and Printing (BEP). The BEP will then print billions of notes in various denominations, from $1 bills to $100 bills.
In this graphic, we’ve used the latest Federal Reserve data to visualize the approximate number of bills for each denomination globally, as of Dec. 31, 2022.
Breakdown of U.S. Currency in Circulation
The following table lists all of the data we used to create the visualization above. Note that value figures were rounded for simplicity.
| Type of Bill | Number of notes in circulation (billions) | Value ($B) |
|---|---|---|
| $1 | 14.3 | $14B |
| $2 | 1.5 | $3B |
| $5 | 3.5 | $18B |
| $10 | 2.3 | $23B |
| $20 | 11.5 | $230B |
| $50 | 2.5 | $125B |
| $100 | 18.5 | $1,850B |
| $500-10,000* | 0.0004 | n/a |
*$500-10,000 bills are listed as a range, and a total circulation of 0.0004 billion. Not included in graphic.
From these numbers, we can see that $100 bills are the most common bill in circulation, even ahead of $1 bills.
One reason for this is $100 bills have a longer lifespan than smaller denominations, due to people using $100 bills less often for transactions. Some businesses may also decline $100 bills as payment.
Based on 2018 estimates from the Federal Reserve, a $100 bill has a lifespan of over 20 years, which is significantly higher than $1 bills (7 years) and $5 bills (5 years).
If you’re interested in more visualizations on the U.S. dollar, consider this animated chart which shows how the dollar overtook the British pound as the world’s most prominent reserve currency.

-

 Debt1 week ago
How Debt-to-GDP Ratios Have Changed Since 2000
-

 Markets2 weeks ago
Ranked: The World’s Top Flight Routes, by Revenue
-

 Countries2 weeks ago
Population Projections: The World’s 6 Largest Countries in 2075
-

 Markets2 weeks ago
The Top 10 States by Real GDP Growth in 2023
-

 Demographics2 weeks ago
The Smallest Gender Wage Gaps in OECD Countries
-

 United States2 weeks ago
Where U.S. Inflation Hit the Hardest in March 2024
-

 Green2 weeks ago
Top Countries By Forest Growth Since 2001
-

 United States2 weeks ago
Ranked: The Largest U.S. Corporations by Number of Employees