Markets
Visualizing the Rise of the U.S. Dollar Since the 19th Century
Visualizing the Rise of the U.S. Dollar Since the 19th Century
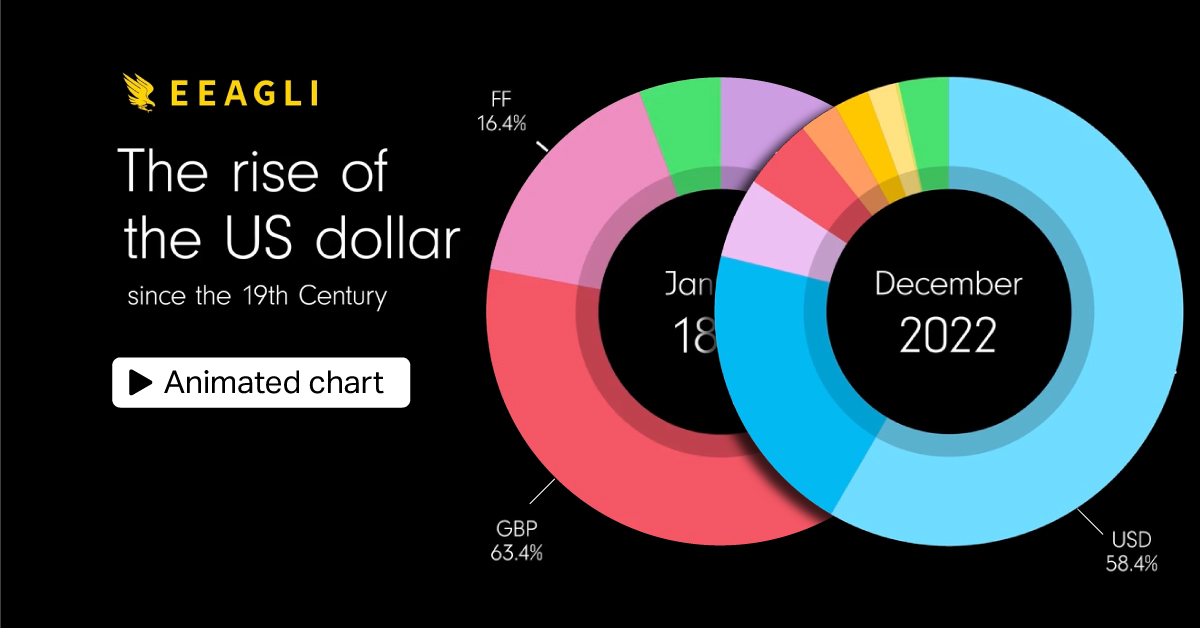
As the world’s reserve currency, the U.S. dollar made up 58.4% of foreign reserves held by central banks in 2022, falling near 25-year lows.
Today, emerging countries are slowly decoupling from the greenback, with foreign reserves shifting to currencies like the Chinese yuan.
At the same time, the steep appreciation of the U.S. dollar is leading countries to sell their U.S. foreign reserves to help prop up their currencies, in turn buying currencies such as the Australian and Canadian dollars to help generate higher yields.
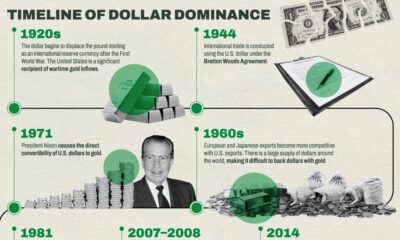
The above animated graphic from James Eagle shows the rapid ascent of the U.S. dollar over the last century, and its gradual decline in recent years.
Dollar Dominance: A Brief History
In 1944, the U.S. dollar became the world’s reserve currency under the Bretton Woods Agreement. Over the first half of the century, the U.S. ran budget surpluses while increasing trade and economic ties with war-torn countries, expanding its influence as the world’s store of value.
Later through the 1960s, the U.S. dollar share of global foreign reserves rapidly increased as political allies stockpiled the dollar.
By 2000, dollar dominance hit a peak of 71% of global reserves. With the creation of the European Union a year earlier, countries such as China began increasing the share of euros in reserves. Between 2000 and 2005, the share of the dollar in China’s foreign exchange reserves fell by an estimated 15 percentage points.
The dollar began a long rally after the global financial crisis, which drove central banks to cut their dollar reserves to help bolster their currencies.
Fast-forward to today, and dollar reserves have fallen roughly 13 percentage points from their historical peak.
The State of the World’s Reserve Currency
In 2022, 16% of Russia’s export transactions were in yuan, up from almost nothing before the war. Brazil and Argentina have also begun adopting the Chinese currency for trade or reserve purposes. Still, the U.S. dollar makes up 80% of Brazil’s reserves.
Yet while the U.S. dollar has decreased in share of foreign reserves, it still has an immense influence in the world economy.
The majority of trade is invoiced in the U.S. dollar globally, a trend that has stayed fairly consistent over many decades. Between 1999-2019, 74% of trade in Asia was invoiced in dollars and in the Americas, it made up 96% of all invoicing.
Furthermore, almost 90% of foreign exchange transactions involve the U.S. dollar thanks to its liquidity.
However, countries are increasingly finding alternative options than the dollar. Today, Western businesses have begun settling trade with China in renminbi. Looking further ahead, digital currencies could provide options that don’t include the U.S. dollar.
Even more so, if the U.S. share of global GDP continues to shrink, the shift to a multipolar system could progress over this century.

This article was published as a part of Visual Capitalist's Creator Program, which features data-driven visuals from some of our favorite Creators around the world.
Economy
Economic Growth Forecasts for G7 and BRICS Countries in 2024
The IMF has released its economic growth forecasts for 2024. How do the G7 and BRICS countries compare?

G7 & BRICS Real GDP Growth Forecasts for 2024
The International Monetary Fund’s (IMF) has released its real gross domestic product (GDP) growth forecasts for 2024, and while global growth is projected to stay steady at 3.2%, various major nations are seeing declining forecasts.
This chart visualizes the 2024 real GDP growth forecasts using data from the IMF’s 2024 World Economic Outlook for G7 and BRICS member nations along with Saudi Arabia, which is still considering an invitation to join the bloc.
Get the Key Insights of the IMF’s World Economic Outlook
Want a visual breakdown of the insights from the IMF’s 2024 World Economic Outlook report?
This visual is part of a special dispatch of the key takeaways exclusively for VC+ members.
Get the full dispatch of charts by signing up to VC+.
Mixed Economic Growth Prospects for Major Nations in 2024
Economic growth projections by the IMF for major nations are mixed, with the majority of G7 and BRICS countries forecasted to have slower growth in 2024 compared to 2023.
Only three BRICS-invited or member countries, Saudi Arabia, the UAE, and South Africa, have higher projected real GDP growth rates in 2024 than last year.
| Group | Country | Real GDP Growth (2023) | Real GDP Growth (2024P) |
|---|---|---|---|
| G7 | 🇺🇸 U.S. | 2.5% | 2.7% |
| G7 | 🇨🇦 Canada | 1.1% | 1.2% |
| G7 | 🇯🇵 Japan | 1.9% | 0.9% |
| G7 | 🇫🇷 France | 0.9% | 0.7% |
| G7 | 🇮🇹 Italy | 0.9% | 0.7% |
| G7 | 🇬🇧 UK | 0.1% | 0.5% |
| G7 | 🇩🇪 Germany | -0.3% | 0.2% |
| BRICS | 🇮🇳 India | 7.8% | 6.8% |
| BRICS | 🇨🇳 China | 5.2% | 4.6% |
| BRICS | 🇦🇪 UAE | 3.4% | 3.5% |
| BRICS | 🇮🇷 Iran | 4.7% | 3.3% |
| BRICS | 🇷🇺 Russia | 3.6% | 3.2% |
| BRICS | 🇪🇬 Egypt | 3.8% | 3.0% |
| BRICS-invited | 🇸🇦 Saudi Arabia | -0.8% | 2.6% |
| BRICS | 🇧🇷 Brazil | 2.9% | 2.2% |
| BRICS | 🇿🇦 South Africa | 0.6% | 0.9% |
| BRICS | 🇪🇹 Ethiopia | 7.2% | 6.2% |
| 🌍 World | 3.2% | 3.2% |
China and India are forecasted to maintain relatively high growth rates in 2024 at 4.6% and 6.8% respectively, but compared to the previous year, China is growing 0.6 percentage points slower while India is an entire percentage point slower.
On the other hand, four G7 nations are set to grow faster than last year, which includes Germany making its comeback from its negative real GDP growth of -0.3% in 2023.
Faster Growth for BRICS than G7 Nations
Despite mostly lower growth forecasts in 2024 compared to 2023, BRICS nations still have a significantly higher average growth forecast at 3.6% compared to the G7 average of 1%.
While the G7 countries’ combined GDP is around $15 trillion greater than the BRICS nations, with continued higher growth rates and the potential to add more members, BRICS looks likely to overtake the G7 in economic size within two decades.
BRICS Expansion Stutters Before October 2024 Summit
BRICS’ recent expansion has stuttered slightly, as Argentina’s newly-elected president Javier Milei declined its invitation and Saudi Arabia clarified that the country is still considering its invitation and has not joined BRICS yet.
Even with these initial growing pains, South Africa’s Foreign Minister Naledi Pandor told reporters in February that 34 different countries have submitted applications to join the growing BRICS bloc.
Any changes to the group are likely to be announced leading up to or at the 2024 BRICS summit which takes place October 22-24 in Kazan, Russia.
Get the Full Analysis of the IMF’s Outlook on VC+
This visual is part of an exclusive special dispatch for VC+ members which breaks down the key takeaways from the IMF’s 2024 World Economic Outlook.
For the full set of charts and analysis, sign up for VC+.
-

 Education1 week ago
How Hard Is It to Get Into an Ivy League School?
-

 Technology2 weeks ago
Ranked: Semiconductor Companies by Industry Revenue Share
-

 Markets2 weeks ago
Ranked: The World’s Top Flight Routes, by Revenue
-

 Demographics2 weeks ago
Population Projections: The World’s 6 Largest Countries in 2075
-

 Markets2 weeks ago
The Top 10 States by Real GDP Growth in 2023
-

 Demographics2 weeks ago
The Smallest Gender Wage Gaps in OECD Countries
-

 Economy2 weeks ago
Where U.S. Inflation Hit the Hardest in March 2024
-

 Green2 weeks ago
Top Countries By Forest Growth Since 2001

