

This graphic illustrates the amount of U.S. currency in circulation globally, by denomination, based on data from the Federal Reserve.
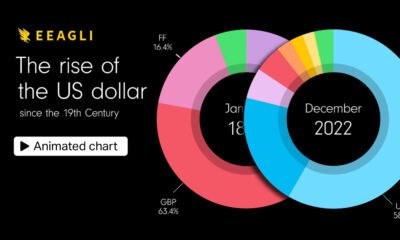

This animated graphic shows the U.S. dollar, the world's primary reserve currency, as a share of foreign reserves since 1900.
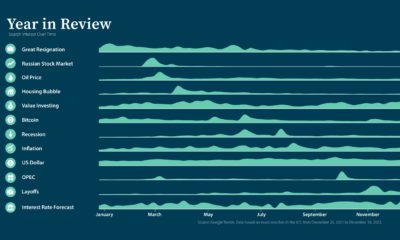

What was on investors' minds in 2022? Discover the top Google searches and how the dominant trends played out in portfolios.


Since 2008, the value of unrecorded dollar debt has doubled. Here's why this is increasing risk in global financial markets.
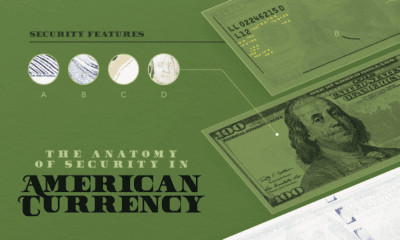

How can you tell a fake $100 bill from a real one? In this visual we break down the anatomy and security features of American money.
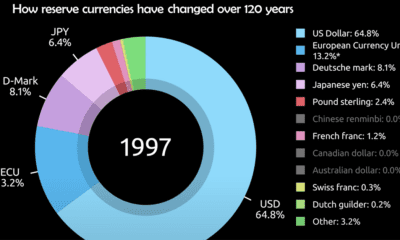

Today, the U.S. dollar makes up 60% of held reserve currency. See how global preferences have shifted since 1900.
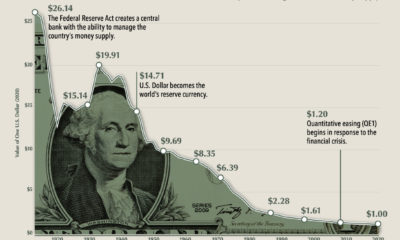

$1 in 1913 had the same purchasing power as $26 in 2020. This chart shows how the purchasing power of the dollar has changed over time.
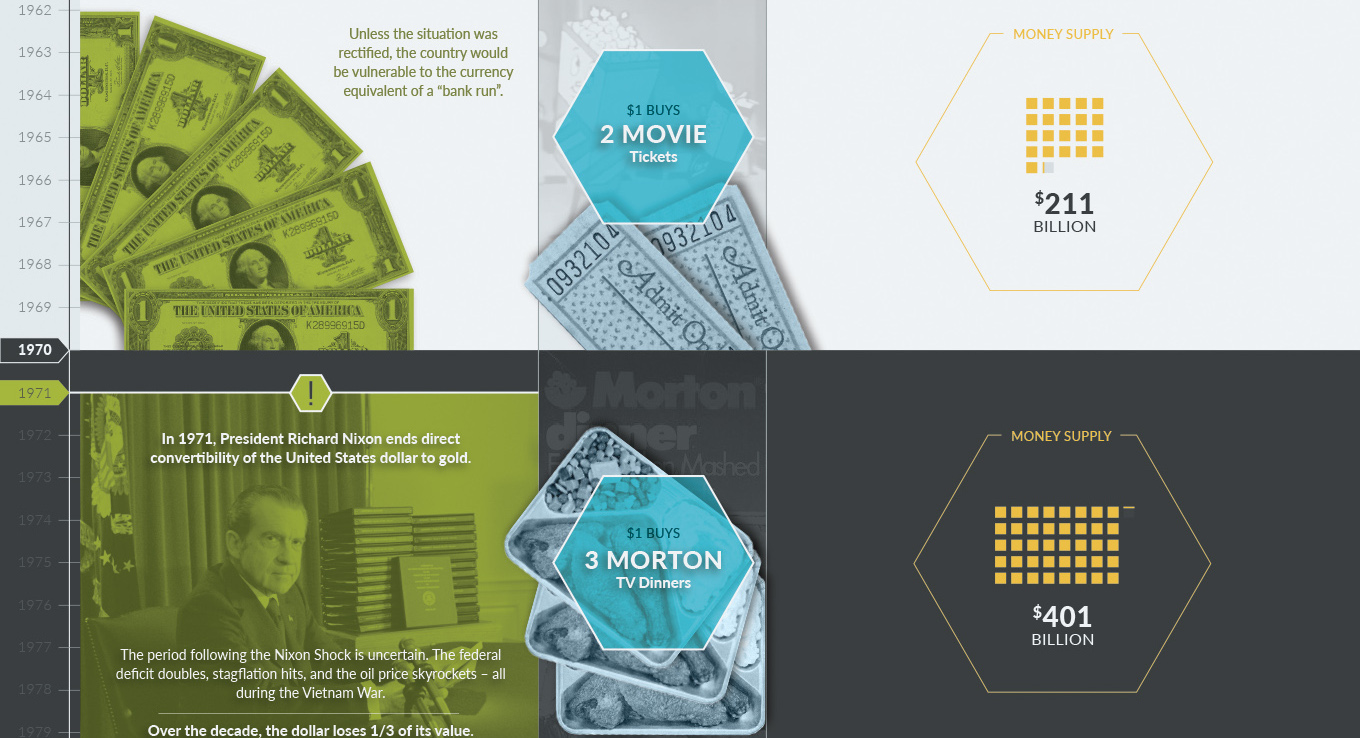
A timeline of U.S. monetary history shows the major events, the changing money supply, and the falling buying power of the U.S. dollar over time.
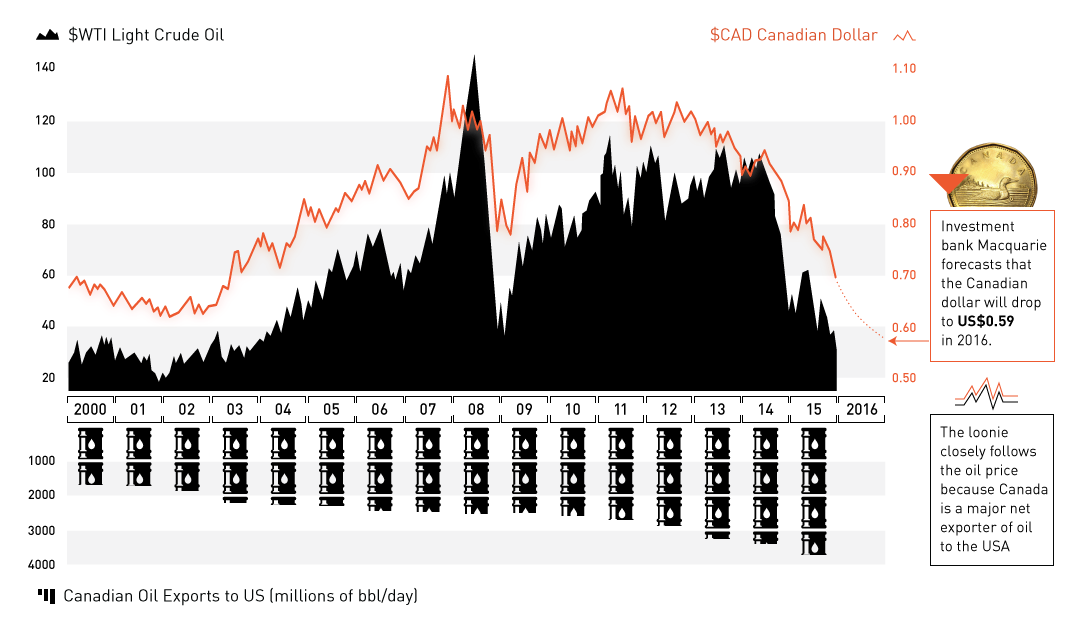
The oil plunge has wreaked havoc on the Canadian dollar. Now at 13-yr lows and expected to go lower, we explain the relationship between oil and...
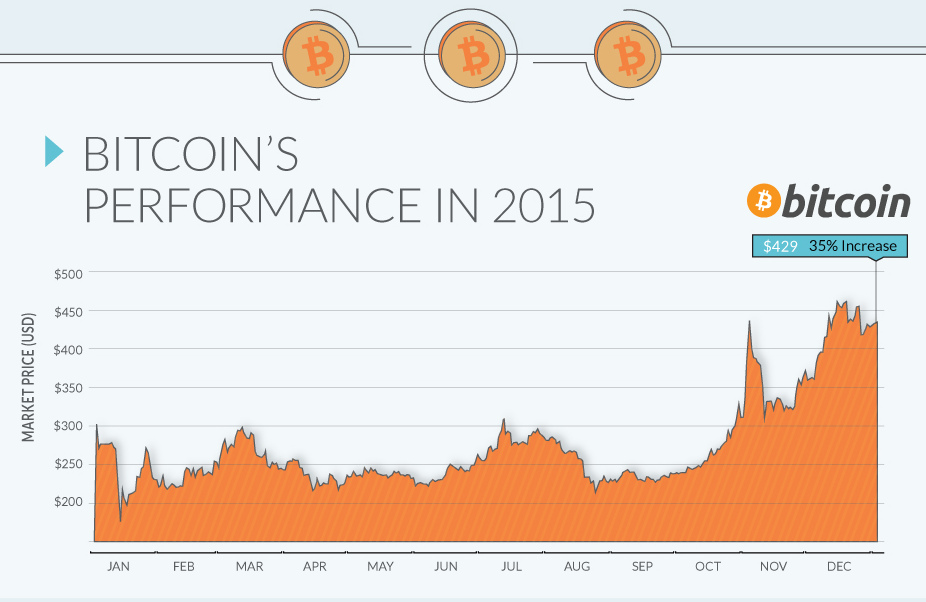
In a year that the US dollar gained on most currencies, it was the digital cryptocurrency Bitcoin that was the top performer by a significant margin.


 Creator Program