Currency
Charted: How Major Currencies Did in 2023
![]() See this visualization first on the Voronoi app.
See this visualization first on the Voronoi app.
Charted: How Major Currencies Performed in 2023
This was originally posted on our Voronoi app. Download the app for free on iOS or Android and discover incredible data-driven charts from a variety of trusted sources.
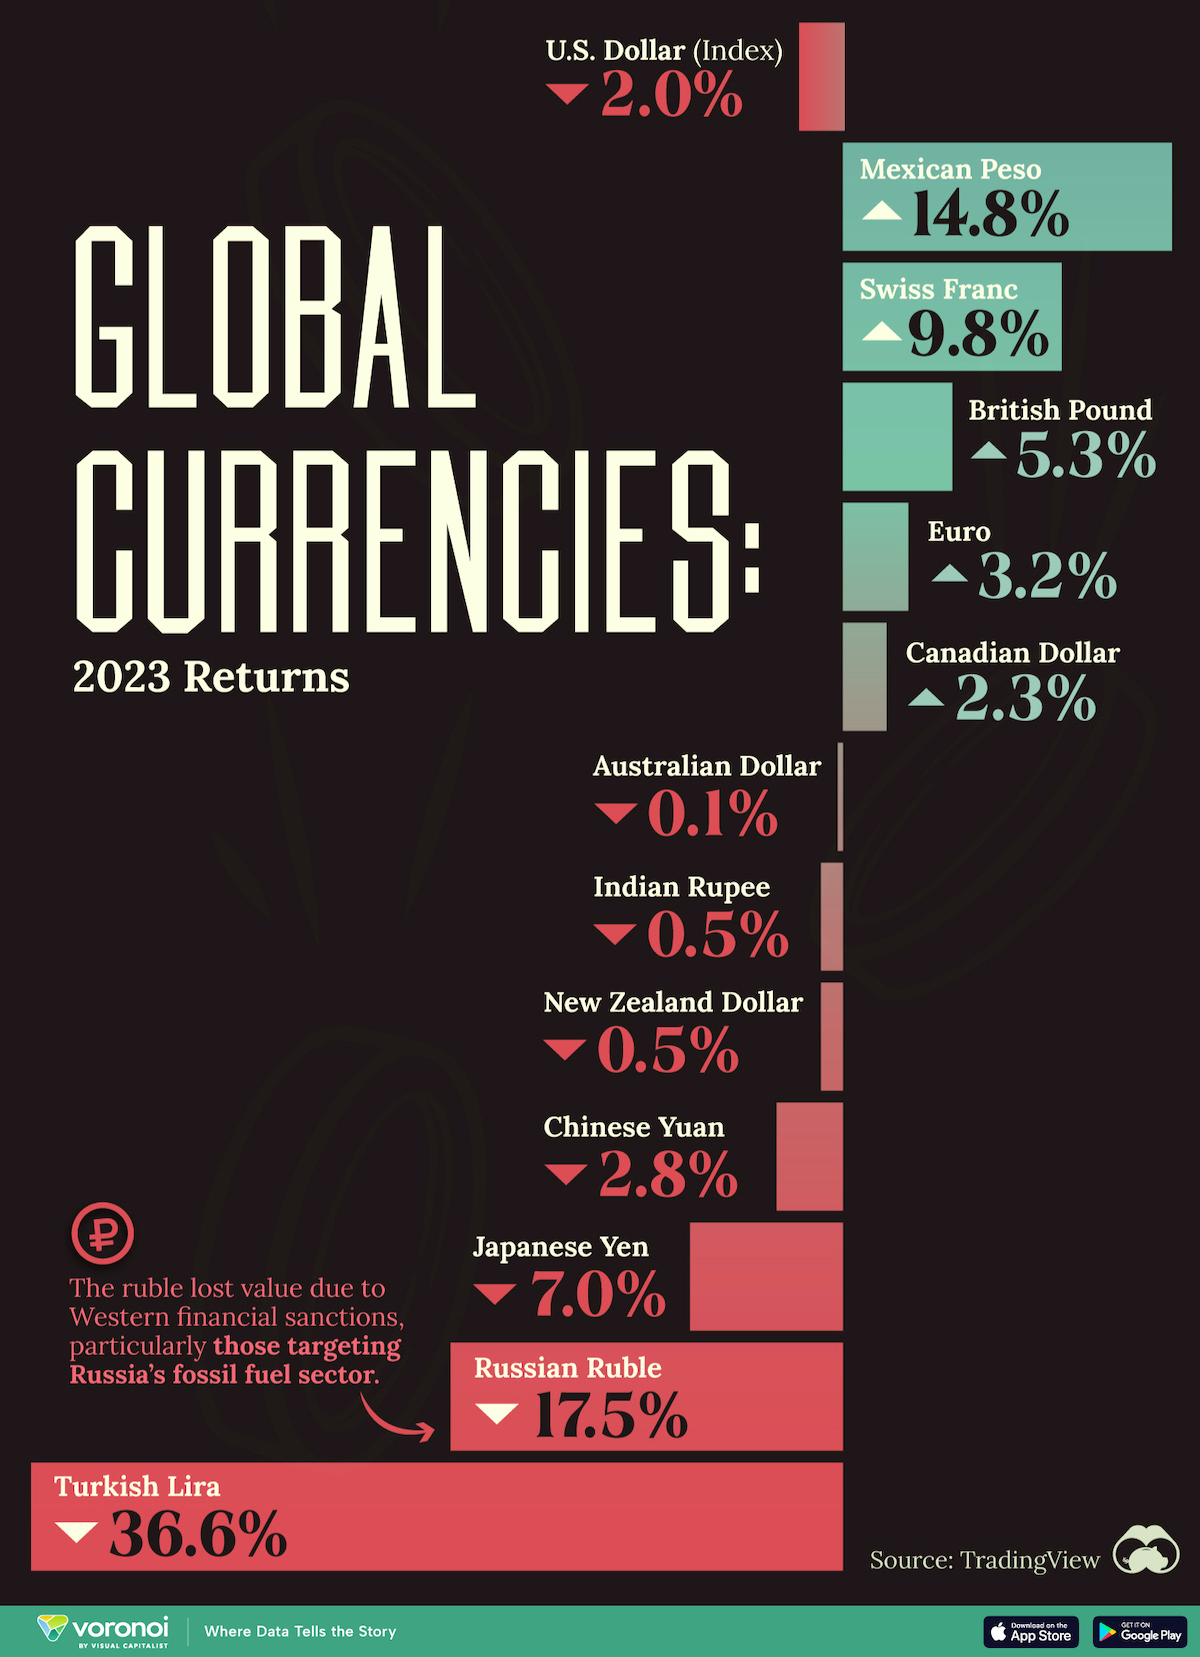
The U.S. Dollar Index peaked in fall 2022, the highest it had been in nearly two decades, rising in response to aggressive interest rate hikes.
The index measures the value of the U.S. dollar against a basket of major currencies from six countries. A gain indicates the dollar is appreciating against the basket and vice-versa. The euro is the biggest component on the index and thus sways the index value and return.
In 2023, the U.S. Dollar Index declined off its highs while still maintaining a fairly elevated level as interest rates have stayed steady.
But how have other major currencies fared against the dollar?
We visualize the returns of 12 currencies against the U.S. dollar, using data from TradingView.
Ranked: Best and Worst Performing Currencies in 2023?
By far, the best performing major currency of 2023 was the Mexican peso, which appreciated nearly 15% against the dollar.
The peso appreciated significantly thanks to aggressive interest rate hikes by its central bank (currently at 11.25%) which pulls money into the country as investors chase better returns.
However, the peso’s continued appreciation could negatively impact the competitiveness of Mexico’s exports. In tandem, Asian imports to the country become cheaper which can hurt the country’s domestic industrial sector.
Here’s how other major currencies performed in 2023.
| Rank | Currency | 2023 Returns |
|---|---|---|
| 1 | 🇲🇽 Mexican Peso | +14.8% |
| 2 | 🇨🇭 Swiss Franc | +9.8% |
| 3 | 🇬🇧 British Pound | +5.3% |
| 4 | 🇪🇺 Euro | +3.2% |
| 5 | 🇨🇦 Canadian Dollar | +2.3% |
| 6 | 🇦🇺 Australian Dollar | -0.1% |
| 7 | 🇮🇳 Indian Rupee | -0.5% |
| 8 | 🇳🇿 New Zealand Dollar | -0.5% |
| 9 | 🇨🇳 Chinese Yuan | -2.8% |
| 10 | 🇯🇵 Japanese Yen | -7.0% |
| 11 | 🇷🇺 Russian Ruble | -17.5% |
| 12 | 🇹🇷 Turkish Lira | -36.6% |
| N/A | 🇺🇸 U.S. Dollar Index | -2.0% |
From across the Atlantic, the Swiss franc, British pound, and euro all gained as well.
Meanwhile, the Japanese yen, while down 7% for 2023 has a much stronger outlook for 2024, with the Bank of Japan likely to raise rates to curb inflation, strengthening the currency.
At the bottom of the list, the Russian ruble and Turkish lira lost nearly one-fifth, and one-third of their value against the dollar, respectively.
The lira has been declining steadily for over a decade now (down 94%) as the country has witnessed several political upheavals that have shaken the economy as well as investor sentiment.
Meanwhile Russia’s economy relies heavily on fossil fuel exports, a sector hit hard by Western sanctions. With fewer buyers for its oil and gas, export revenue has declined, reducing the country’s trade surplus.


Money
Visualizing All of the U.S. Currency in Circulation
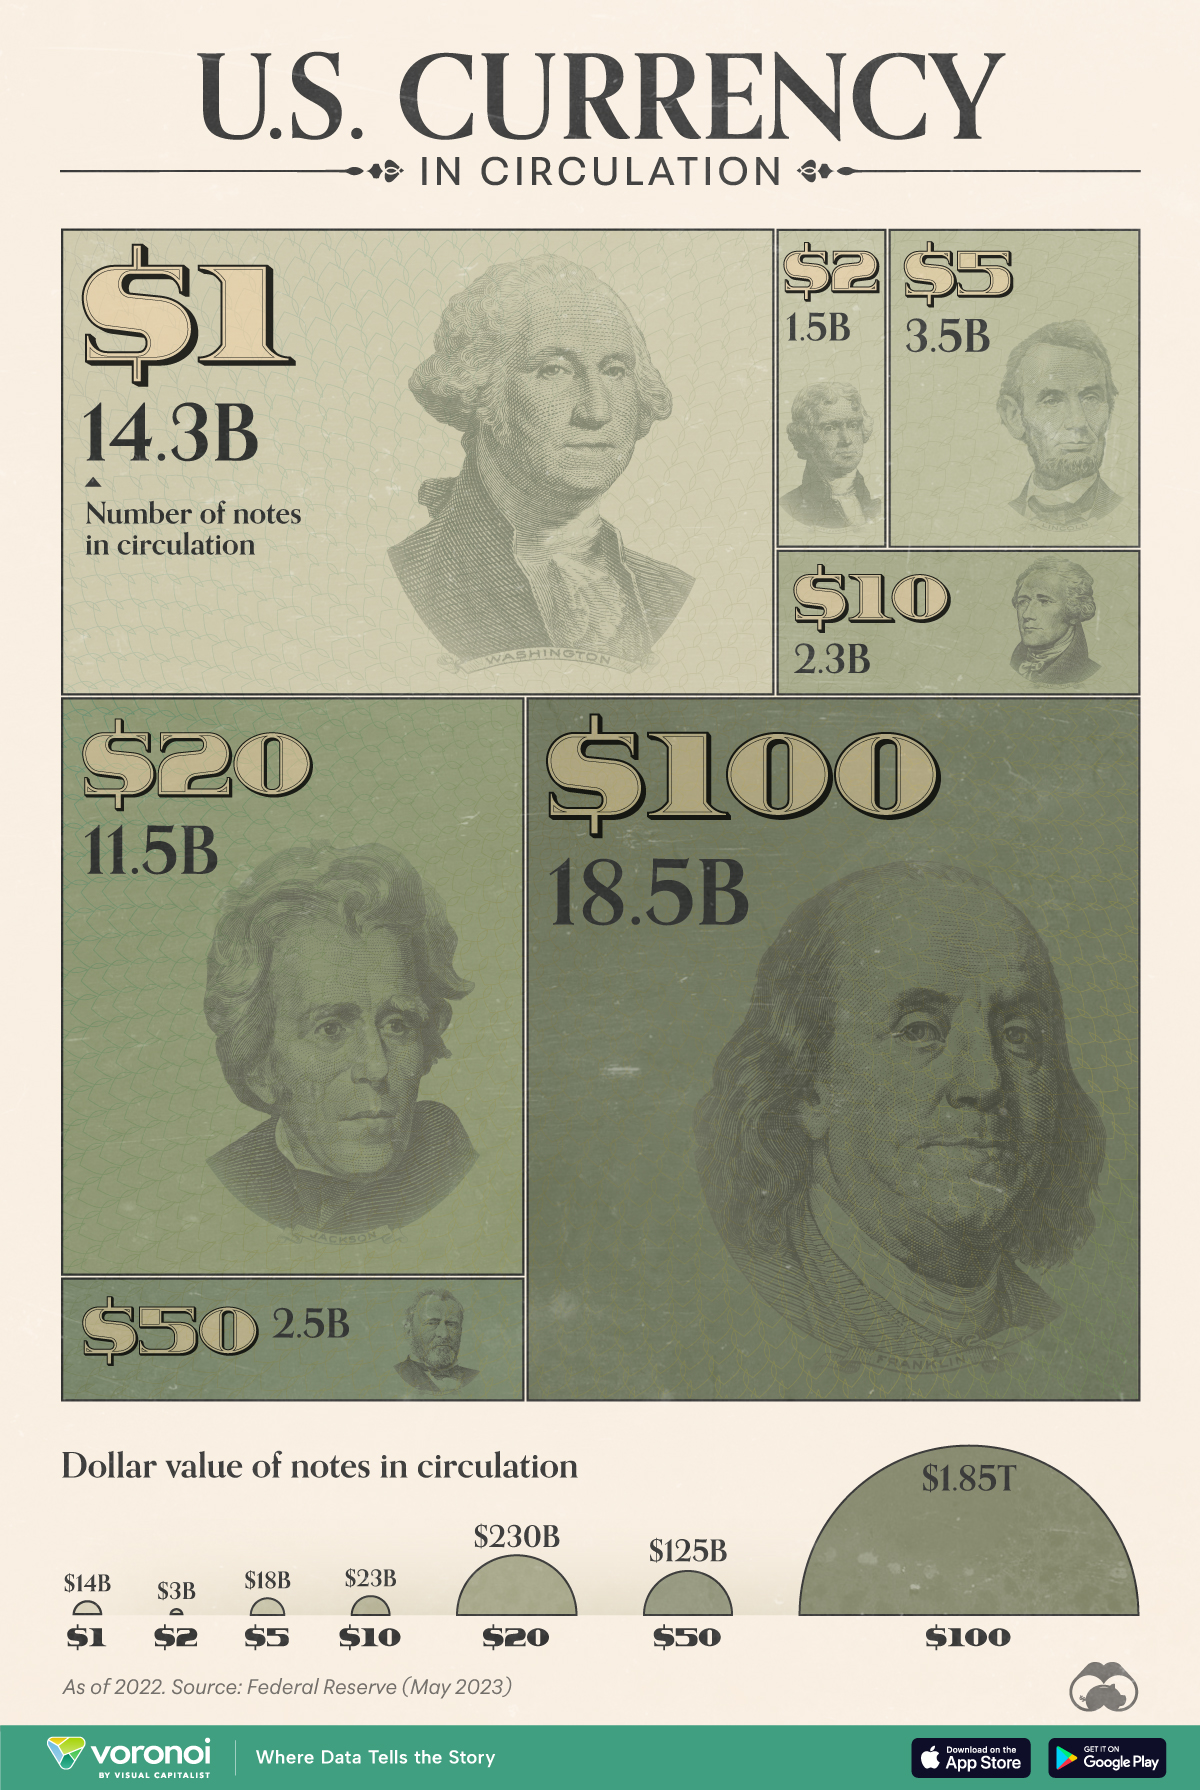
This graphic illustrates the amount of U.S. currency in circulation globally, by denomination, based on data from the Federal Reserve.
Visualizing All of the U.S. Currency in Circulation
This was originally posted on our Voronoi app. Download the app for free on iOS or Android and discover incredible data-driven charts from a variety of trusted sources.
Have you ever wondered how much U.S. currency is in circulation?
Every year, the U.S. Federal Reserve submits a print order for U.S. currency to the Treasury Department’s Bureau of Engraving and Printing (BEP). The BEP will then print billions of notes in various denominations, from $1 bills to $100 bills.
In this graphic, we’ve used the latest Federal Reserve data to visualize the approximate number of bills for each denomination globally, as of Dec. 31, 2022.
Breakdown of U.S. Currency in Circulation
The following table lists all of the data we used to create the visualization above. Note that value figures were rounded for simplicity.
| Type of Bill | Number of notes in circulation (billions) | Value ($B) |
|---|---|---|
| $1 | 14.3 | $14B |
| $2 | 1.5 | $3B |
| $5 | 3.5 | $18B |
| $10 | 2.3 | $23B |
| $20 | 11.5 | $230B |
| $50 | 2.5 | $125B |
| $100 | 18.5 | $1,850B |
| $500-10,000* | 0.0004 | n/a |
*$500-10,000 bills are listed as a range, and a total circulation of 0.0004 billion. Not included in graphic.
From these numbers, we can see that $100 bills are the most common bill in circulation, even ahead of $1 bills.
One reason for this is $100 bills have a longer lifespan than smaller denominations, due to people using $100 bills less often for transactions. Some businesses may also decline $100 bills as payment.
Based on 2018 estimates from the Federal Reserve, a $100 bill has a lifespan of over 20 years, which is significantly higher than $1 bills (7 years) and $5 bills (5 years).
If you’re interested in more visualizations on the U.S. dollar, consider this animated chart which shows how the dollar overtook the British pound as the world’s most prominent reserve currency.
-

 Education1 week ago
How Hard Is It to Get Into an Ivy League School?
-

 Technology2 weeks ago
Ranked: Semiconductor Companies by Industry Revenue Share
-

 Markets2 weeks ago
Ranked: The World’s Top Flight Routes, by Revenue
-

 Demographics2 weeks ago
Population Projections: The World’s 6 Largest Countries in 2075
-

 Markets2 weeks ago
The Top 10 States by Real GDP Growth in 2023
-

 Demographics2 weeks ago
The Smallest Gender Wage Gaps in OECD Countries
-

 Economy2 weeks ago
Where U.S. Inflation Hit the Hardest in March 2024
-

 Environment2 weeks ago
Top Countries By Forest Growth Since 2001