Money
Visualizing Currencies’ Decline Against the U.S. Dollar
![]() Subscribe to the Elements free mailing list for more like this
Subscribe to the Elements free mailing list for more like this
Visualizing Currencies’ Decline Against the U.S. Dollar
This was originally posted on Elements. Sign up to the free mailing list to get beautiful visualizations on natural resource megatrends in your email every week.
In a highly volatile and difficult year for many currencies and equities, the U.S. dollar has been a safe haven for investors.
The greenback has provided exceptional stability, with almost every currency around the world declining against the U.S. dollar in 2022.
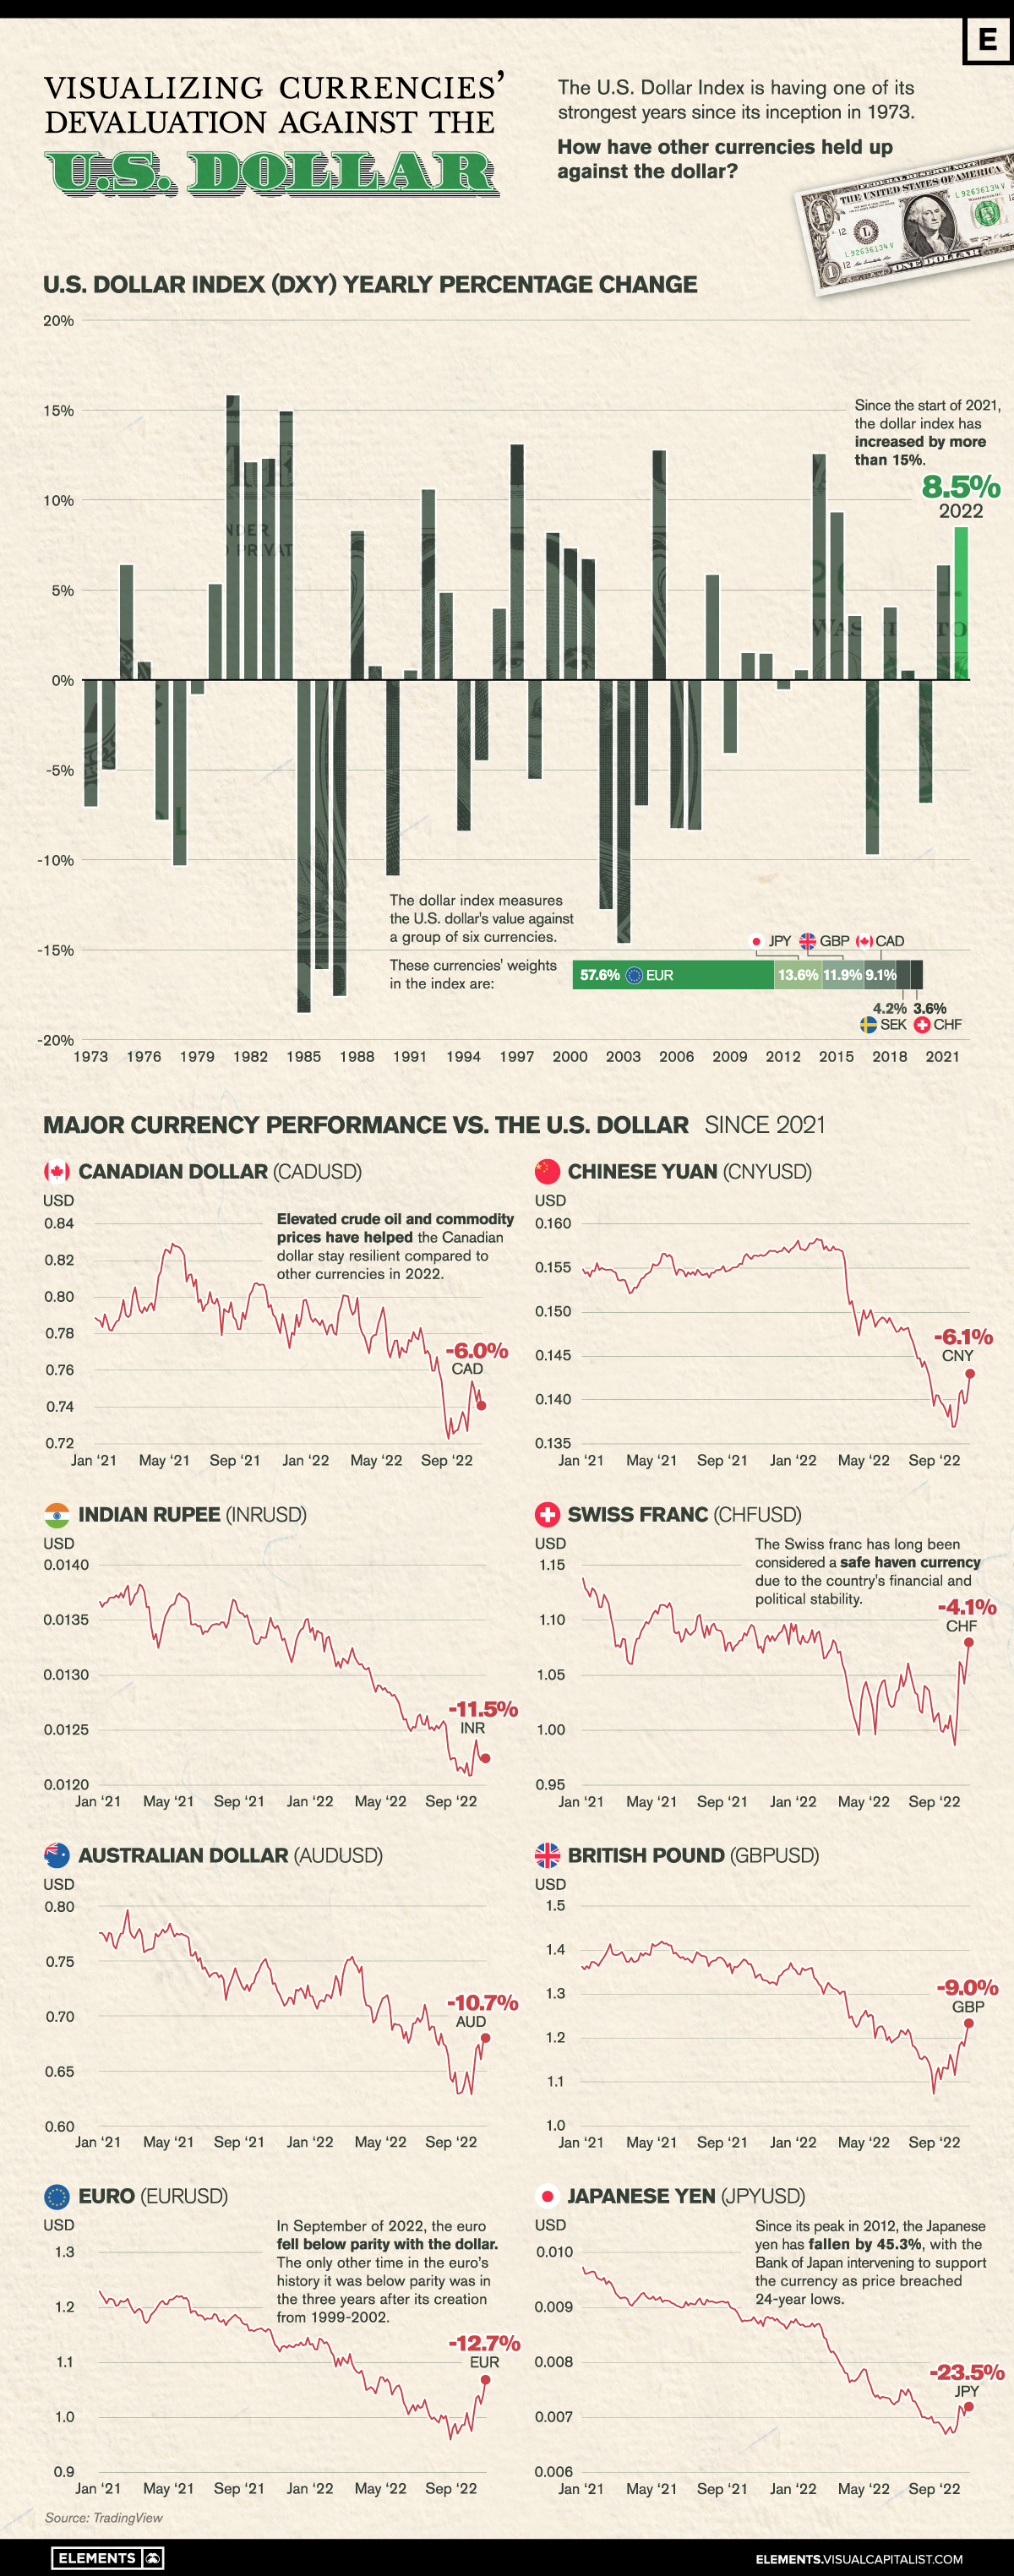
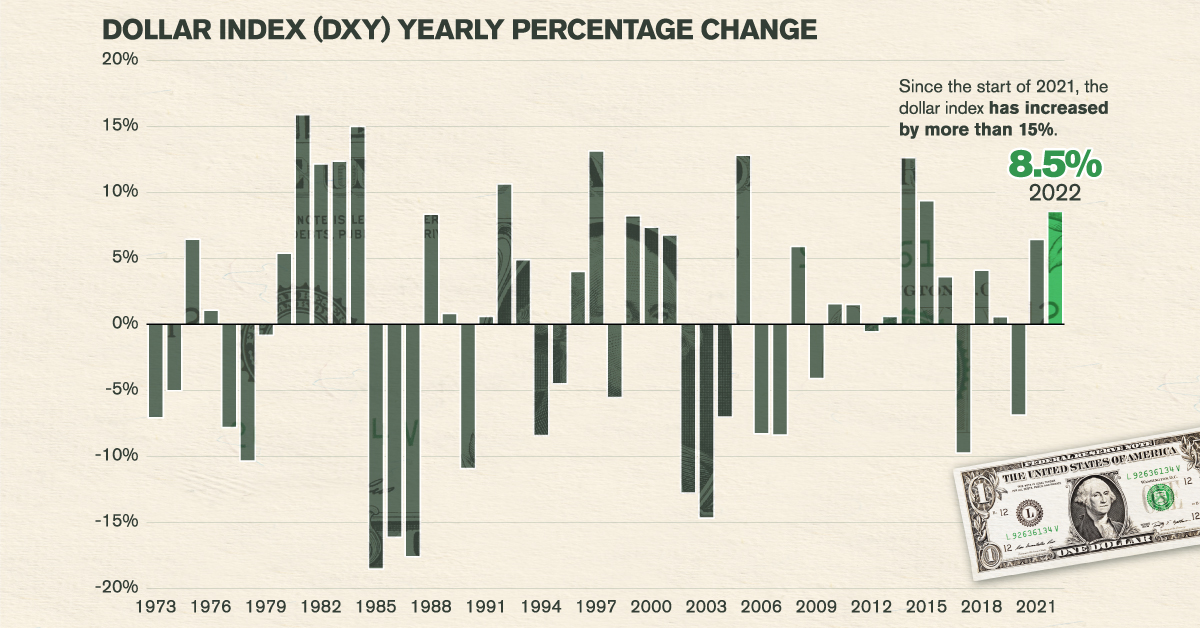
This graphic visualizes almost 50 years of the Dollar Index’s returns along with the decline of major currencies against the U.S. dollar in the past two years using price data from TradingView.
U.S. Dollar and Major Currencies’ Returns in 2022
As shown in the graphic above, the past two years have seen nearly every major currency lose value against the U.S. dollar.
One of the currencies hit hardest is the euro, which briefly fell below parity (meaning the euro was worth less than one U.S. dollar) in September and October of 2022, before recovering with a 5.3% rally in November.
| Currency | 2021 Returns | 2022 YTD Returns |
|---|---|---|
| Japanese Yen (JPYUSD) 🇯🇵 | -10.4% | -14.7% |
| Indian Rupee (INRUSD) 🇮🇳 | 2.0% | -9.6% |
| Pound Sterling (GBPUSD) 🇬🇧 | -1.1% | -8.0% |
| Chinese Yuan (CNYUSD) 🇨🇳 | 2.7% | -8.6% |
| Euro (EURUSD) 🇪🇺 | -7.0% | -6.0% |
| Canadian Dollar (CADUSD) 🇨🇦 | 0.7% | -6.6% |
| Australian Dollar (AUDUSD) 🇦🇺 | -5.7% | -5.2% |
| Swiss Franc (CHFUSD) 🇨🇭 | -3.0% | -1.1% |
2022 YTD Returns as of December 14th 2022. (Source: TradingView)
However, the Japanese yen was the major currency hit hardest, having fallen more than 25% since the start of 2021. At the yen’s lowest point this year in October, the currency breached 24-year lows, resulting in the Bank of Japan intervening with $42.8 billion to support the country’s falling currency.
The Swiss franc and Canadian dollar have been the most resilient major currencies against the U.S. dollar since 2021, largely due to the financial and political stability of those nations. Along with this, Canada has benefitted from surging crude oil prices in 2022, exporting the majority of its crude oil across its southern border to America.
Three Reasons for the U.S. Dollar’s Strength in 2022
A variety of factors have contributed to the U.S. dollar’s strength in 2022. The rapid raising of interest rates by the Federal Reserve and tightening of their balance sheet has resulted in U.S. dollars becoming a more scarce and valuable yield-bearing asset.
As interest rates have risen, so have yields for savings accounts and fixed-income securities like U.S. treasuries, making them a more attractive alternative for investors.
At the same time, falling equity prices (especially in the technology sector) only further incentivized investors to pull out of riskier equity markets into the safety of the dollar.
Lastly, compared to many other global economies, the U.S. economy has remained resilient with the fewest risks on its horizon. Europe continues to face an ongoing energy crunch with the Russia-Ukraine conflict nearby, while China’s zero-COVID policies have hampered the country’s manufacturing sector, as well as other industries.
How Will Currencies Fare in 2023?
While the U.S. dollar has surged for much of 2022, its rally has started losing steam in the final months of the year.
In September of 2022 the Dollar Index was up 20% on the year reaching a high of 114.8, but has since retreated and given back more than half its gains for this year so far.
Investors around the world will be watching closely to see if the U.S. dollar’s rise will continue, or if this end-of-year reversal will carry through and provide major currencies some relief going into 2023.


Money
Charted: Which City Has the Most Billionaires in 2024?
Just two countries account for half of the top 20 cities with the most billionaires. And the majority of the other half are found in Asia.


Charted: Which Country Has the Most Billionaires in 2024?
This was originally posted on our Voronoi app. Download the app for free on iOS or Android and discover incredible data-driven charts from a variety of trusted sources.
Some cities seem to attract the rich. Take New York City for example, which has 340,000 high-net-worth residents with investable assets of more than $1 million.
But there’s a vast difference between being a millionaire and a billionaire. So where do the richest of them all live?
Using data from the Hurun Global Rich List 2024, we rank the top 20 cities with the highest number of billionaires in 2024.
A caveat to these rich lists: sources often vary on figures and exact rankings. For example, in last year’s reports, Forbes had New York as the city with the most billionaires, while the Hurun Global Rich List placed Beijing at the top spot.
Ranked: Top 20 Cities with the Most Billionaires in 2024
The Chinese economy’s doldrums over the course of the past year have affected its ultra-wealthy residents in key cities.
Beijing, the city with the most billionaires in 2023, has not only ceded its spot to New York, but has dropped to #4, overtaken by London and Mumbai.
| Rank | City | Billionaires | Rank Change YoY |
|---|---|---|---|
| 1 | 🇺🇸 New York | 119 | +1 |
| 2 | 🇬🇧 London | 97 | +3 |
| 3 | 🇮🇳 Mumbai | 92 | +4 |
| 4 | 🇨🇳 Beijing | 91 | -3 |
| 5 | 🇨🇳 Shanghai | 87 | -2 |
| 6 | 🇨🇳 Shenzhen | 84 | -2 |
| 7 | 🇭🇰 Hong Kong | 65 | -1 |
| 8 | 🇷🇺 Moscow | 59 | No Change |
| 9 | 🇮🇳 New Delhi | 57 | +6 |
| 10 | 🇺🇸 San Francisco | 52 | No Change |
| 11 | 🇹🇭 Bangkok | 49 | +2 |
| 12 | 🇹🇼 Taipei | 45 | +2 |
| 13 | 🇫🇷 Paris | 44 | -2 |
| 14 | 🇨🇳 Hangzhou | 43 | -5 |
| 15 | 🇸🇬 Singapore | 42 | New to Top 20 |
| 16 | 🇨🇳 Guangzhou | 39 | -4 |
| 17T | 🇮🇩 Jakarta | 37 | +1 |
| 17T | 🇧🇷 Sao Paulo | 37 | No Change |
| 19T | 🇺🇸 Los Angeles | 31 | No Change |
| 19T | 🇰🇷 Seoul | 31 | -3 |
In fact all Chinese cities on the top 20 list have lost billionaires between 2023–24. Consequently, they’ve all lost ranking spots as well, with Hangzhou seeing the biggest slide (-5) in the top 20.
Where China lost, all other Asian cities—except Seoul—in the top 20 have gained ranks. Indian cities lead the way, with New Delhi (+6) and Mumbai (+3) having climbed the most.
At a country level, China and the U.S combine to make up half of the cities in the top 20. They are also home to about half of the world’s 3,200 billionaire population.
In other news of note: Hurun officially counts Taylor Swift as a billionaire, estimating her net worth at $1.2 billion.

-

 Debt1 week ago
How Debt-to-GDP Ratios Have Changed Since 2000
-

 Markets2 weeks ago
Ranked: The World’s Top Flight Routes, by Revenue
-

 Countries2 weeks ago
Population Projections: The World’s 6 Largest Countries in 2075
-

 Markets2 weeks ago
The Top 10 States by Real GDP Growth in 2023
-

 Demographics2 weeks ago
The Smallest Gender Wage Gaps in OECD Countries
-

 United States2 weeks ago
Where U.S. Inflation Hit the Hardest in March 2024
-

 Green2 weeks ago
Top Countries By Forest Growth Since 2001
-

 United States2 weeks ago
Ranked: The Largest U.S. Corporations by Number of Employees