Markets
Charted: Six Red Flags Pointing to China’s Economy Slowing Down
Six Red Flags Pointing to China’s Economy Slowing Down
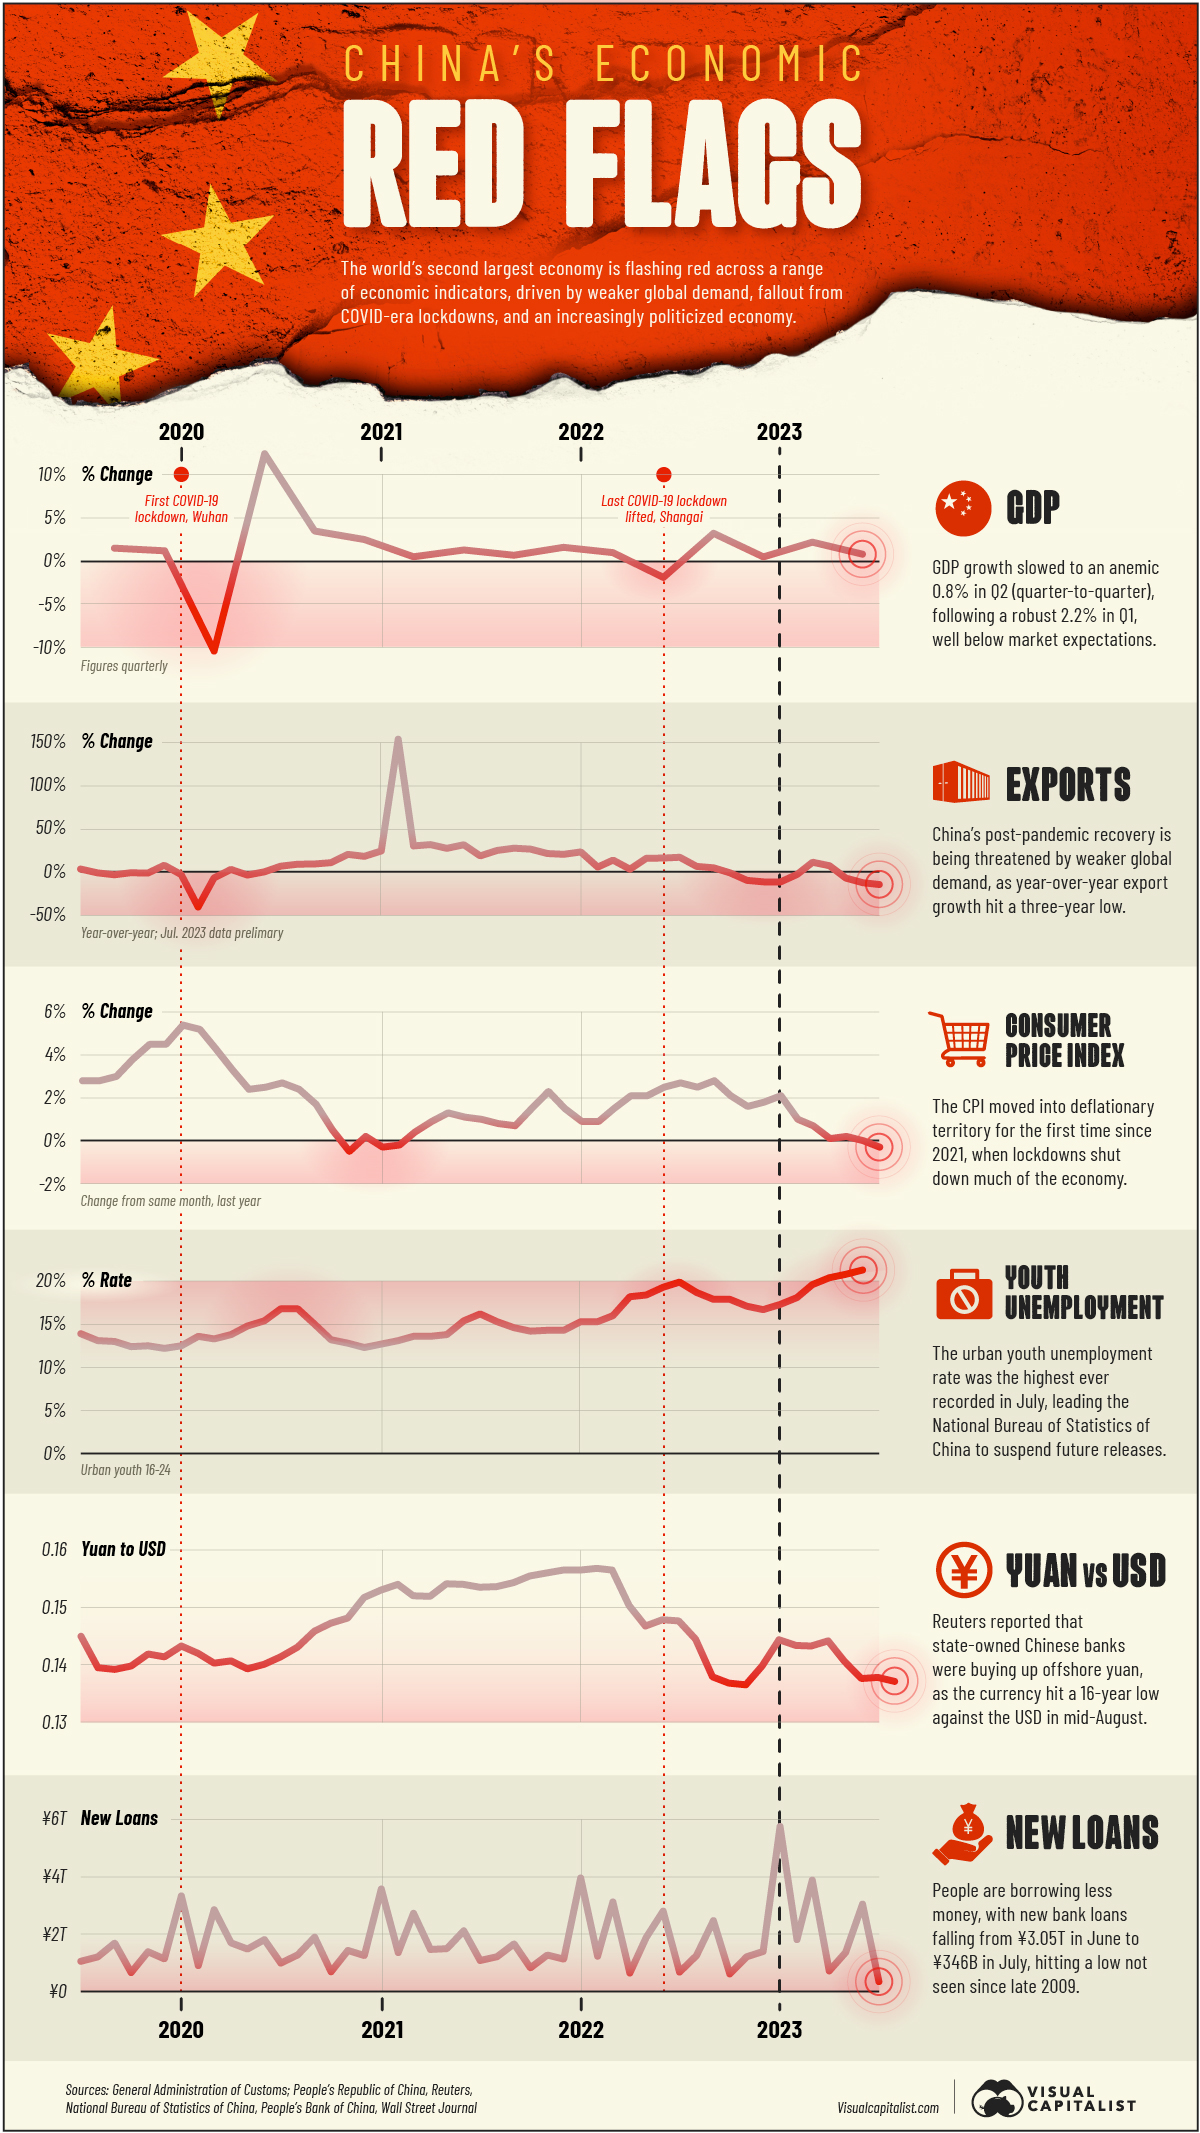
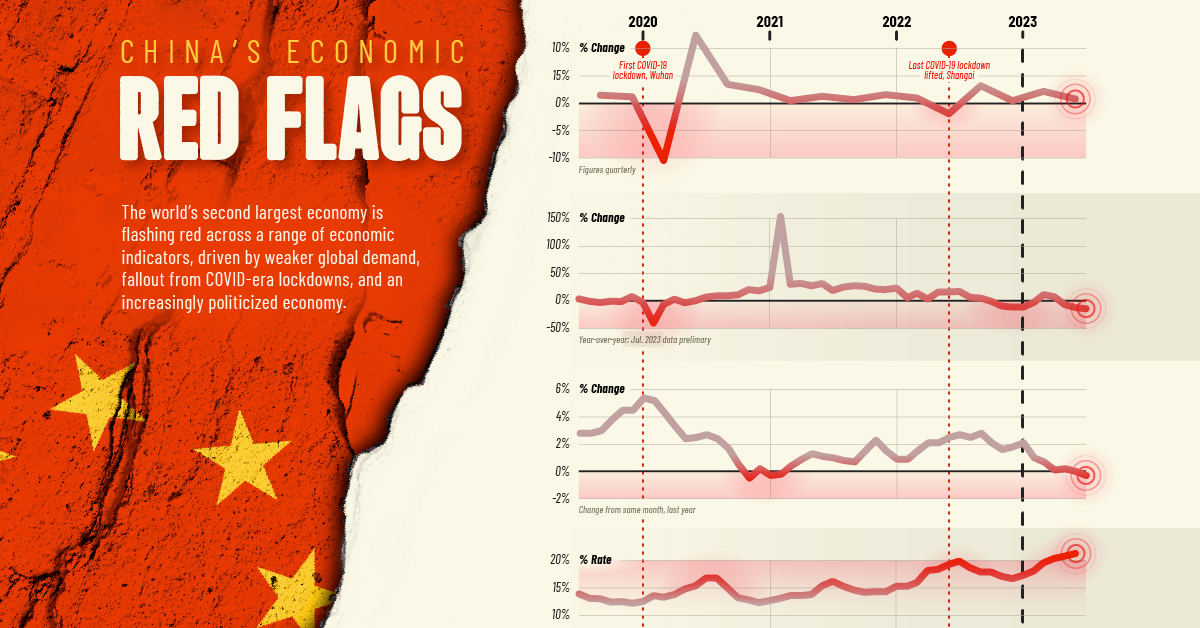
The People’s Republic of China is the world’s second-largest economy, responsible for one quarter of global GDP growth this millennium—so when the country catches a cold, the world notices.
The past several months have seen an avalanche of bad economic news for China, putting the country’s post-pandemic recovery, and global economic growth, in jeopardy.
In this visualization, we look at six important indicators that point to China’s economy slowing down. Data comes from the National Bureau of Statistics of China, the People’s Bank of China, and the General Administration of Customs, to see what is flashing red.
Six Red Flag Indicators on China’s Economy
1. GDP
China’s annual GDP growth rate has averaged 9% since 1978, when the country opened itself up to the global market under Deng Xiaoping.
However, growth seems to have slowed to a crawl, down to 0.8% (quarter-to-quarter) in the second quarter of 2023 driven by weakness in the Tertiary Sector, which includes retail spending and the troubled real estate sector. This follows a more robust 2.2% figure in Q1, which was driven by pent-up demand released by the end of COVID-era lockdowns.
On an annual basis, China’s GDP expanded 6.3% year-over-year, below the forecasted 7.3% rate.
2. Exports
Exports fell by 14.5% in July, marking the third straight month of declines, and hitting lows not seen since February 2020. Meanwhile, imports fell 12.4%, reflecting the cautious consumer mood.
On a regional basis, exports fell year-over-year to China’s three biggest customers, ASEAN, the EU, and the U.S., by 17.4%, 15.1%, and 20.8% respectively.
There was one bright spot, however: exports to sanction-burdened Russia increased 51.8%, but that wasn’t nearly enough to offset the overall downward trend.
3. Consumer Price Index
The consumer price index moved into deflationary territory for the first time since 2021, with prices falling 3% year-over-year. The decline was led by Household Articles and Services, Food & Tobacco, and Transportation and Communications.
At the same time, the prices that producers paid for industrial products (PPI) fell 4.4% (year-over-year), the tenth month in a row with a negative reading.
4. Youth Unemployment
And while the headline unemployment rate remained steady at 5.3% in August 2023, up slightly from 5.2% the month before, it papers over serious weakness for urban youth, aged 16 to 24.
In July, the urban youth unemployment rate reached 21.3%, the highest ever recorded in the country, leading the National Bureau of Statistics of China to suspend future releases.
5. Yuan vs. USD
Given the stream of economic bad news, it’s no surprise that the yuan fell to a 16-year low against the U.S. dollar on August 16, 2023 in offshore trading.
In an effort to stabilize the currency, major state-owned Chinese banks were seen buying up yuan in offshore money markets. At the same time, the spread between the fixed exchange rate set by the People’s Bank of China and the offshore rate, rose to more than 1,000 basis points.
6. New Loans
Adding to the dismal economic mood, people borrowed less money according to the most recent figures provided by the government.
New bank loans fell to ¥346 billion in July, down from ¥3.05 trillion in the month before. This was the lowest reading since late-2009, and less than half of the ¥780 billion economists had forecast.
What’s Next?
Foreign Affairs recently published an article with the provocative title “The End of China’s Economic Miracle,” arguing that China’s troubles could be a U.S. opportunity.
And while this may be somewhat premature, the Middle Kingdom has some serious structural issues to contend with, many of them of their own making. Some of the top challenges include crackdowns on the tech sector, a collapsing real estate market, a larger debt crisis, and a shrinking population.
But large-scale government intervention does not appear to be in the offing, beyond exhortations for consumers to spend more and blaming Western media for engaging in “cognitive warfare.”
It’s no wonder that consumer confidence has plunged so low. At least we think so: the Chinese government stopped publishing that too.


Markets
The European Stock Market: Attractive Valuations Offer Opportunities
On average, the European stock market has valuations that are nearly 50% lower than U.S. valuations. But how can you access the market?


European Stock Market: Attractive Valuations Offer Opportunities
Europe is known for some established brands, from L’Oréal to Louis Vuitton. However, the European stock market offers additional opportunities that may be lesser known.
The above infographic, sponsored by STOXX, outlines why investors may want to consider European stocks.
Attractive Valuations
Compared to most North American and Asian markets, European stocks offer lower or comparable valuations.
| Index | Price-to-Earnings Ratio | Price-to-Book Ratio |
|---|---|---|
| EURO STOXX 50 | 14.9 | 2.2 |
| STOXX Europe 600 | 14.4 | 2 |
| U.S. | 25.9 | 4.7 |
| Canada | 16.1 | 1.8 |
| Japan | 15.4 | 1.6 |
| Asia Pacific ex. China | 17.1 | 1.8 |
Data as of February 29, 2024. See graphic for full index names. Ratios based on trailing 12 month financials. The price to earnings ratio excludes companies with negative earnings.
On average, European valuations are nearly 50% lower than U.S. valuations, potentially offering an affordable entry point for investors.
Research also shows that lower price ratios have historically led to higher long-term returns.
Market Movements Not Closely Connected
Over the last decade, the European stock market had low-to-moderate correlation with North American and Asian equities.
The below chart shows correlations from February 2014 to February 2024. A value closer to zero indicates low correlation, while a value of one would indicate that two regions are moving in perfect unison.
| EURO STOXX 50 | STOXX EUROPE 600 | U.S. | Canada | Japan | Asia Pacific ex. China |
|
|---|---|---|---|---|---|---|
| EURO STOXX 50 | 1.00 | 0.97 | 0.55 | 0.67 | 0.24 | 0.43 |
| STOXX EUROPE 600 | 1.00 | 0.56 | 0.71 | 0.28 | 0.48 | |
| U.S. | 1.00 | 0.73 | 0.12 | 0.25 | ||
| Canada | 1.00 | 0.22 | 0.40 | |||
| Japan | 1.00 | 0.88 | ||||
| Asia Pacific ex. China | 1.00 |
Data is based on daily USD returns.
European equities had relatively independent market movements from North American and Asian markets. One contributing factor could be the differing sector weights in each market. For instance, technology makes up a quarter of the U.S. market, but health care and industrials dominate the broader European market.
Ultimately, European equities can enhance portfolio diversification and have the potential to mitigate risk for investors.
Tracking the Market
For investors interested in European equities, STOXX offers a variety of flagship indices:
| Index | Description | Market Cap |
|---|---|---|
| STOXX Europe 600 | Pan-regional, broad market | €10.5T |
| STOXX Developed Europe | Pan-regional, broad-market | €9.9T |
| STOXX Europe 600 ESG-X | Pan-regional, broad market, sustainability focus | €9.7T |
| STOXX Europe 50 | Pan-regional, blue-chip | €5.1T |
| EURO STOXX 50 | Eurozone, blue-chip | €3.5T |
Data is as of February 29, 2024. Market cap is free float, which represents the shares that are readily available for public trading on stock exchanges.
The EURO STOXX 50 tracks the Eurozone’s biggest and most traded companies. It also underlies one of the world’s largest ranges of ETFs and mutual funds. As of November 2023, there were €27.3 billion in ETFs and €23.5B in mutual fund assets under management tracking the index.
“For the past 25 years, the EURO STOXX 50 has served as an accurate, reliable and tradable representation of the Eurozone equity market.”
— Axel Lomholt, General Manager at STOXX
Partnering with STOXX to Track the European Stock Market
Are you interested in European equities? STOXX can be a valuable partner:
- Comprehensive, liquid and investable ecosystem
- European heritage, global reach
- Highly sophisticated customization capabilities
- Open architecture approach to using data
- Close partnerships with clients
- Part of ISS STOXX and Deutsche Börse Group
With a full suite of indices, STOXX can help you benchmark against the European stock market.
Learn how STOXX’s European indices offer liquid and effective market access.

-

 Economy2 days ago
Economic Growth Forecasts for G7 and BRICS Countries in 2024
The IMF has released its economic growth forecasts for 2024. How do the G7 and BRICS countries compare?
-

 Markets2 weeks ago
U.S. Debt Interest Payments Reach $1 Trillion
U.S. debt interest payments have surged past the $1 trillion dollar mark, amid high interest rates and an ever-expanding debt burden.
-

 United States2 weeks ago
Ranked: The Largest U.S. Corporations by Number of Employees
We visualized the top U.S. companies by employees, revealing the massive scale of retailers like Walmart, Target, and Home Depot.
-

 Markets2 weeks ago
The Top 10 States by Real GDP Growth in 2023
This graphic shows the states with the highest real GDP growth rate in 2023, largely propelled by the oil and gas boom.
-

 Markets2 weeks ago
Ranked: The World’s Top Flight Routes, by Revenue
In this graphic, we show the highest earning flight routes globally as air travel continued to rebound in 2023.
-

 Markets3 weeks ago
Ranked: The Most Valuable Housing Markets in America
The U.S. residential real estate market is worth a staggering $47.5 trillion. Here are the most valuable housing markets in the country.

-

 Debt1 week ago
How Debt-to-GDP Ratios Have Changed Since 2000
-
Markets2 weeks ago
Ranked: The World’s Top Flight Routes, by Revenue
-

 Demographics2 weeks ago
Population Projections: The World’s 6 Largest Countries in 2075
-
Markets2 weeks ago
The Top 10 States by Real GDP Growth in 2023
-

 Demographics2 weeks ago
The Smallest Gender Wage Gaps in OECD Countries
-

 United States2 weeks ago
Where U.S. Inflation Hit the Hardest in March 2024
-

 Green2 weeks ago
Top Countries By Forest Growth Since 2001
-
United States2 weeks ago
Ranked: The Largest U.S. Corporations by Number of Employees