Money
De-Dollarization: Countries Seeking Alternatives to the U.S. Dollar
![]() Subscribe to the Elements free mailing list for more like this
Subscribe to the Elements free mailing list for more like this
De-Dollarization: Countries Seeking Alternatives to U.S. Dollar
This was originally posted on Elements. Sign up to the free mailing list to get beautiful visualizations on natural resource megatrends in your email every week.
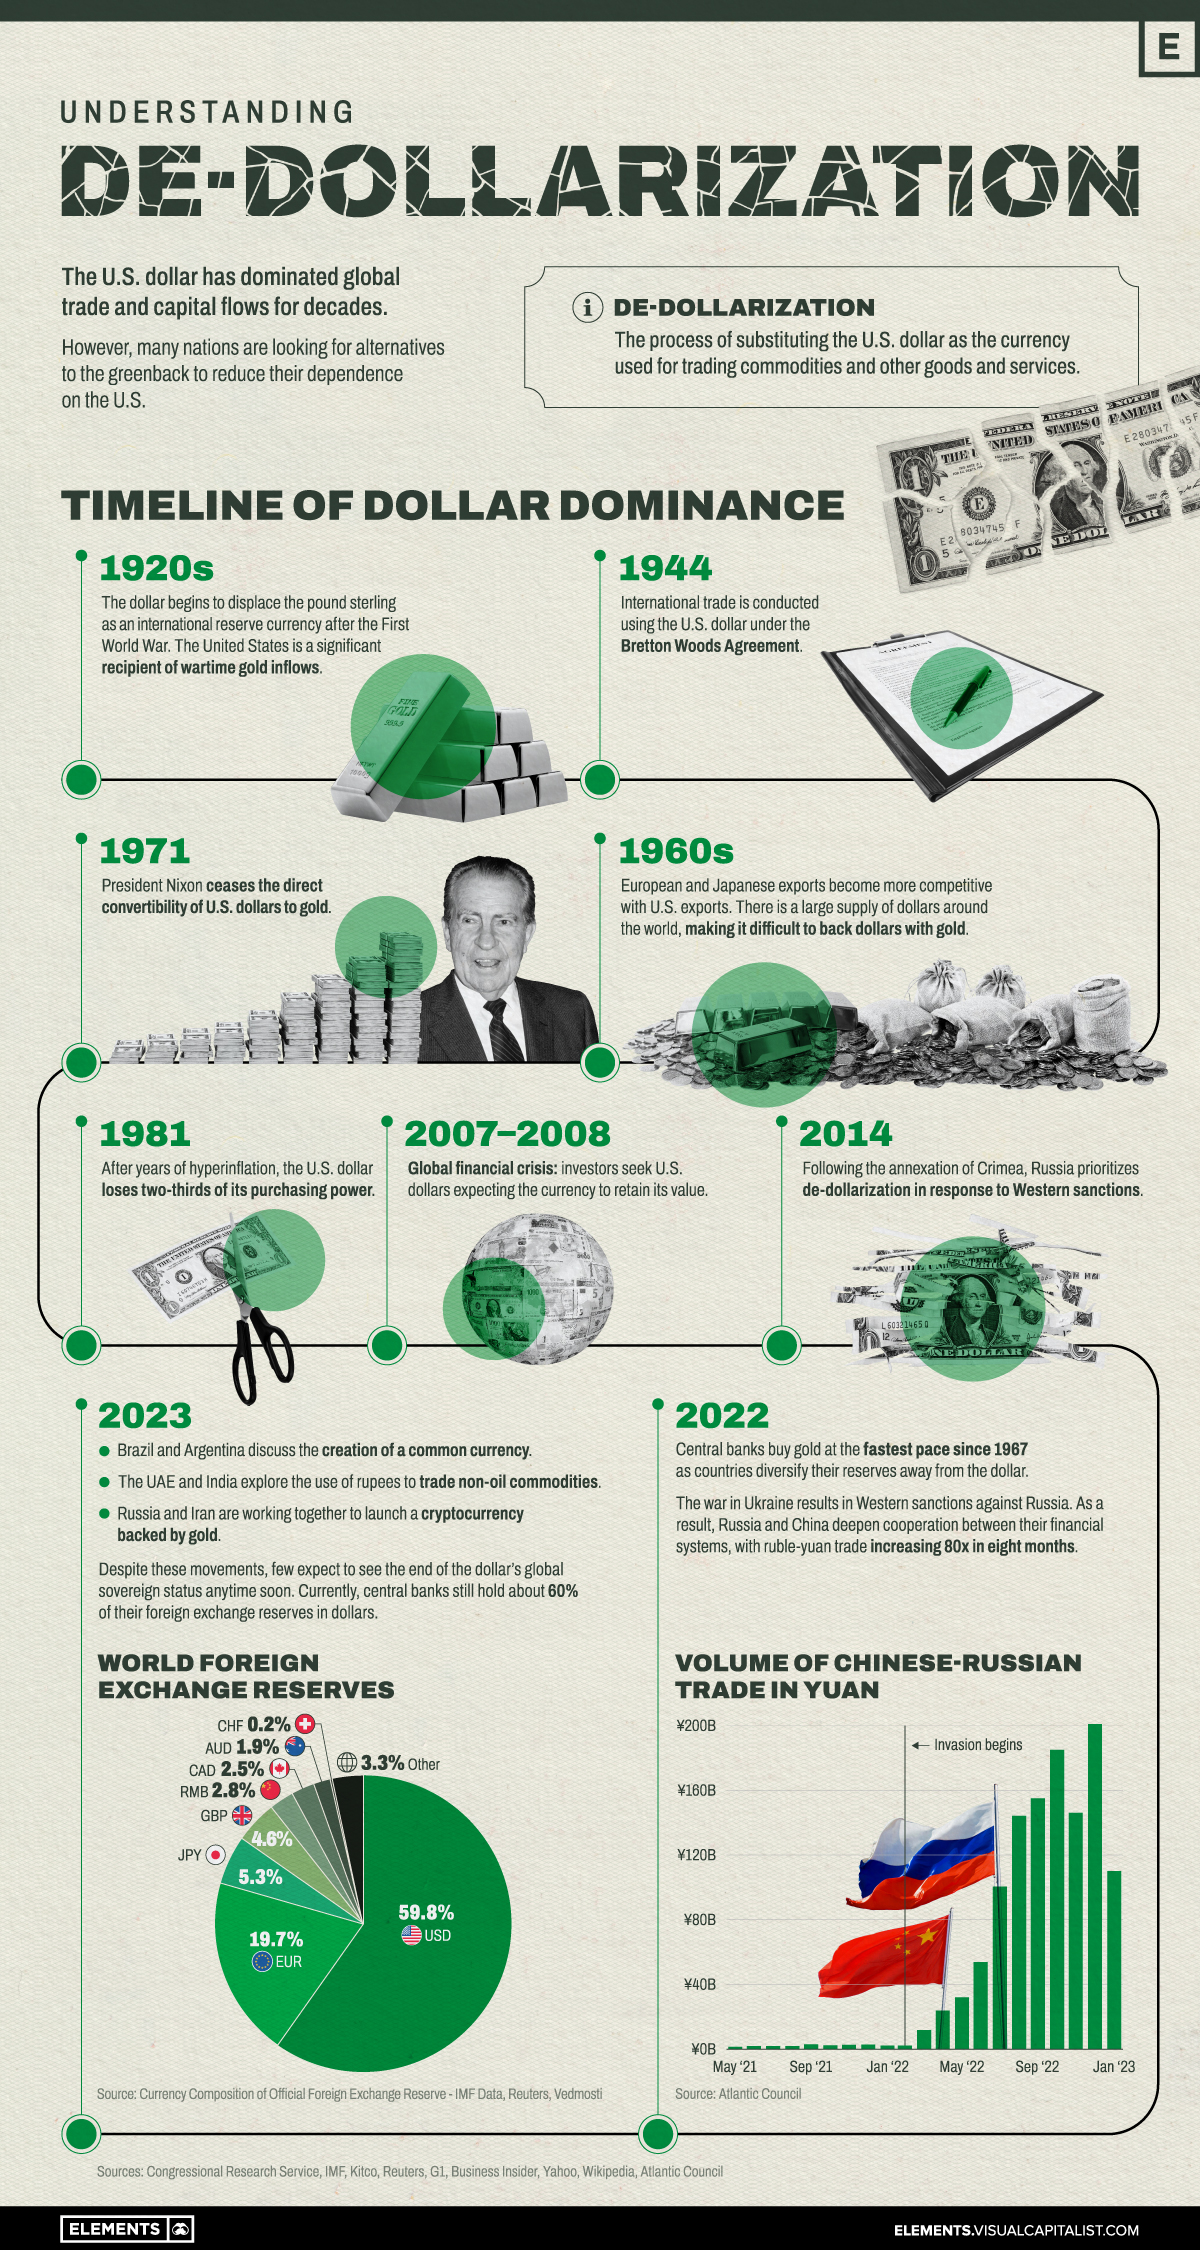
The U.S. dollar has dominated global trade and capital flows over many decades.
However, many nations are looking for alternatives to the greenback to reduce their dependence on the United States.
This graphic catalogs the rise of the U.S. dollar as the dominant international reserve currency, and the recent efforts by various nations to de-dollarize and reduce their dependence on the U.S. financial system.
The Dollar Dominance
The United States became, almost overnight, the leading financial power after World War I. The country entered the war only in 1917 and emerged far stronger than its European counterparts.
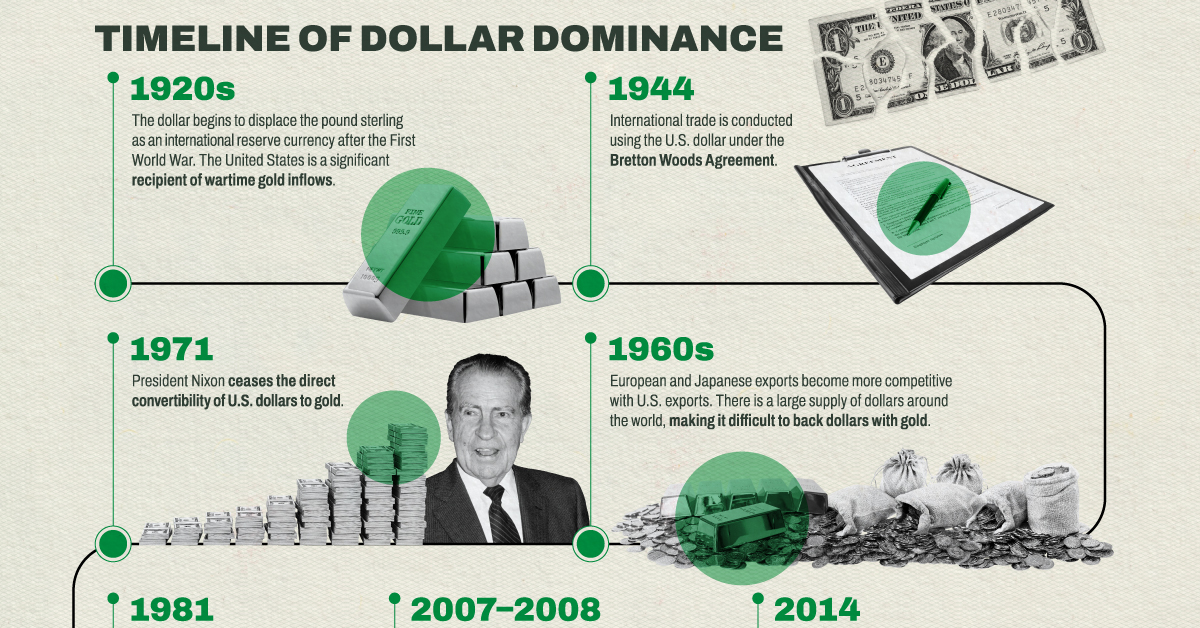
As a result, the dollar began to displace the pound sterling as the international reserve currency and the U.S. also became a significant recipient of wartime gold inflows.
The dollar then gained a greater role in 1944, when 44 countries signed the Bretton Woods Agreement, creating a collective international currency exchange regime pegged to the U.S. dollar which was, in turn, pegged to the price of gold.
By the late 1960s, European and Japanese exports became more competitive with U.S. exports. There was a large supply of dollars around the world, making it difficult to back dollars with gold. President Nixon ceased the direct convertibility of U.S. dollars to gold in 1971. This ended both the gold standard and the limit on the amount of currency that could be printed.
Although it has remained the international reserve currency, the U.S. dollar has increasingly lost its purchasing power since then.
Russia and China’s Steps Towards De-Dollarization
Concerned about America’s dominance over the global financial system and the country’s ability to ‘weaponize’ it, other nations have been testing alternatives to reduce the dollar’s hegemony.
As the United States and other Western nations imposed economic sanctions against Russia in response to its invasion of Ukraine, Moscow and the Chinese government have been teaming up to reduce reliance on the dollar and to establish cooperation between their financial systems.
Since the invasion in 2022, the ruble-yuan trade has increased eighty-fold. Russia and Iran are also working together to launch a cryptocurrency backed by gold, according to Russian news agency Vedmosti.
In addition, central banks (especially Russia’s and China’s) have bought gold at the fastest pace since 1967 as countries move to diversify their reserves away from the dollar.
How Other Countries are Reducing Dollar Dependence
De-dollarization it’s a theme in other parts of the world:
- In recent months, Brazil and Argentina have discussed the creation of a common currency for the two largest economies in South America.
- In a conference in Singapore in January, multiple former Southeast Asian officials spoke about de-dollarization efforts underway.
- The UAE and India are in talks to use rupees to trade non-oil commodities in a shift away from the dollar, according to Reuters.
- For the first time in 48 years, Saudi Arabia said that the oil-rich nation is open to trading in currencies besides the U.S. dollar.
Despite these movements, few expect to see the end of the dollar’s global sovereign status anytime soon. Currently, central banks still hold about 60% of their foreign exchange reserves in dollars.


Money
Charted: Which City Has the Most Billionaires in 2024?
Just two countries account for half of the top 20 cities with the most billionaires. And the majority of the other half are found in Asia.


Charted: Which Country Has the Most Billionaires in 2024?
This was originally posted on our Voronoi app. Download the app for free on iOS or Android and discover incredible data-driven charts from a variety of trusted sources.
Some cities seem to attract the rich. Take New York City for example, which has 340,000 high-net-worth residents with investable assets of more than $1 million.
But there’s a vast difference between being a millionaire and a billionaire. So where do the richest of them all live?
Using data from the Hurun Global Rich List 2024, we rank the top 20 cities with the highest number of billionaires in 2024.
A caveat to these rich lists: sources often vary on figures and exact rankings. For example, in last year’s reports, Forbes had New York as the city with the most billionaires, while the Hurun Global Rich List placed Beijing at the top spot.
Ranked: Top 20 Cities with the Most Billionaires in 2024
The Chinese economy’s doldrums over the course of the past year have affected its ultra-wealthy residents in key cities.
Beijing, the city with the most billionaires in 2023, has not only ceded its spot to New York, but has dropped to #4, overtaken by London and Mumbai.
| Rank | City | Billionaires | Rank Change YoY |
|---|---|---|---|
| 1 | 🇺🇸 New York | 119 | +1 |
| 2 | 🇬🇧 London | 97 | +3 |
| 3 | 🇮🇳 Mumbai | 92 | +4 |
| 4 | 🇨🇳 Beijing | 91 | -3 |
| 5 | 🇨🇳 Shanghai | 87 | -2 |
| 6 | 🇨🇳 Shenzhen | 84 | -2 |
| 7 | 🇭🇰 Hong Kong | 65 | -1 |
| 8 | 🇷🇺 Moscow | 59 | No Change |
| 9 | 🇮🇳 New Delhi | 57 | +6 |
| 10 | 🇺🇸 San Francisco | 52 | No Change |
| 11 | 🇹🇭 Bangkok | 49 | +2 |
| 12 | 🇹🇼 Taipei | 45 | +2 |
| 13 | 🇫🇷 Paris | 44 | -2 |
| 14 | 🇨🇳 Hangzhou | 43 | -5 |
| 15 | 🇸🇬 Singapore | 42 | New to Top 20 |
| 16 | 🇨🇳 Guangzhou | 39 | -4 |
| 17T | 🇮🇩 Jakarta | 37 | +1 |
| 17T | 🇧🇷 Sao Paulo | 37 | No Change |
| 19T | 🇺🇸 Los Angeles | 31 | No Change |
| 19T | 🇰🇷 Seoul | 31 | -3 |
In fact all Chinese cities on the top 20 list have lost billionaires between 2023–24. Consequently, they’ve all lost ranking spots as well, with Hangzhou seeing the biggest slide (-5) in the top 20.
Where China lost, all other Asian cities—except Seoul—in the top 20 have gained ranks. Indian cities lead the way, with New Delhi (+6) and Mumbai (+3) having climbed the most.
At a country level, China and the U.S combine to make up half of the cities in the top 20. They are also home to about half of the world’s 3,200 billionaire population.
In other news of note: Hurun officially counts Taylor Swift as a billionaire, estimating her net worth at $1.2 billion.

-

 Misc1 week ago
How Hard Is It to Get Into an Ivy League School?
-

 Technology2 weeks ago
Ranked: Semiconductor Companies by Industry Revenue Share
-

 Markets2 weeks ago
Ranked: The World’s Top Flight Routes, by Revenue
-

 Countries2 weeks ago
Population Projections: The World’s 6 Largest Countries in 2075
-

 Markets2 weeks ago
The Top 10 States by Real GDP Growth in 2023
-

 Demographics2 weeks ago
The Smallest Gender Wage Gaps in OECD Countries
-

 United States2 weeks ago
Where U.S. Inflation Hit the Hardest in March 2024
-

 Green2 weeks ago
Top Countries By Forest Growth Since 2001