Markets
The Best and Worst Performing Sectors of 2020
The Best and Worst Performing Sectors of 2020
To say that 2020 was an unusual year in markets would be a vast understatement.
In 2020, we saw the quickest and deepest bear market decline in history, trillions of dollars of global stimulus, the highest volatility (VIX) on record, negative oil prices, and the fastest recovery from a bear market ever—just to name a few of the abnormalities.
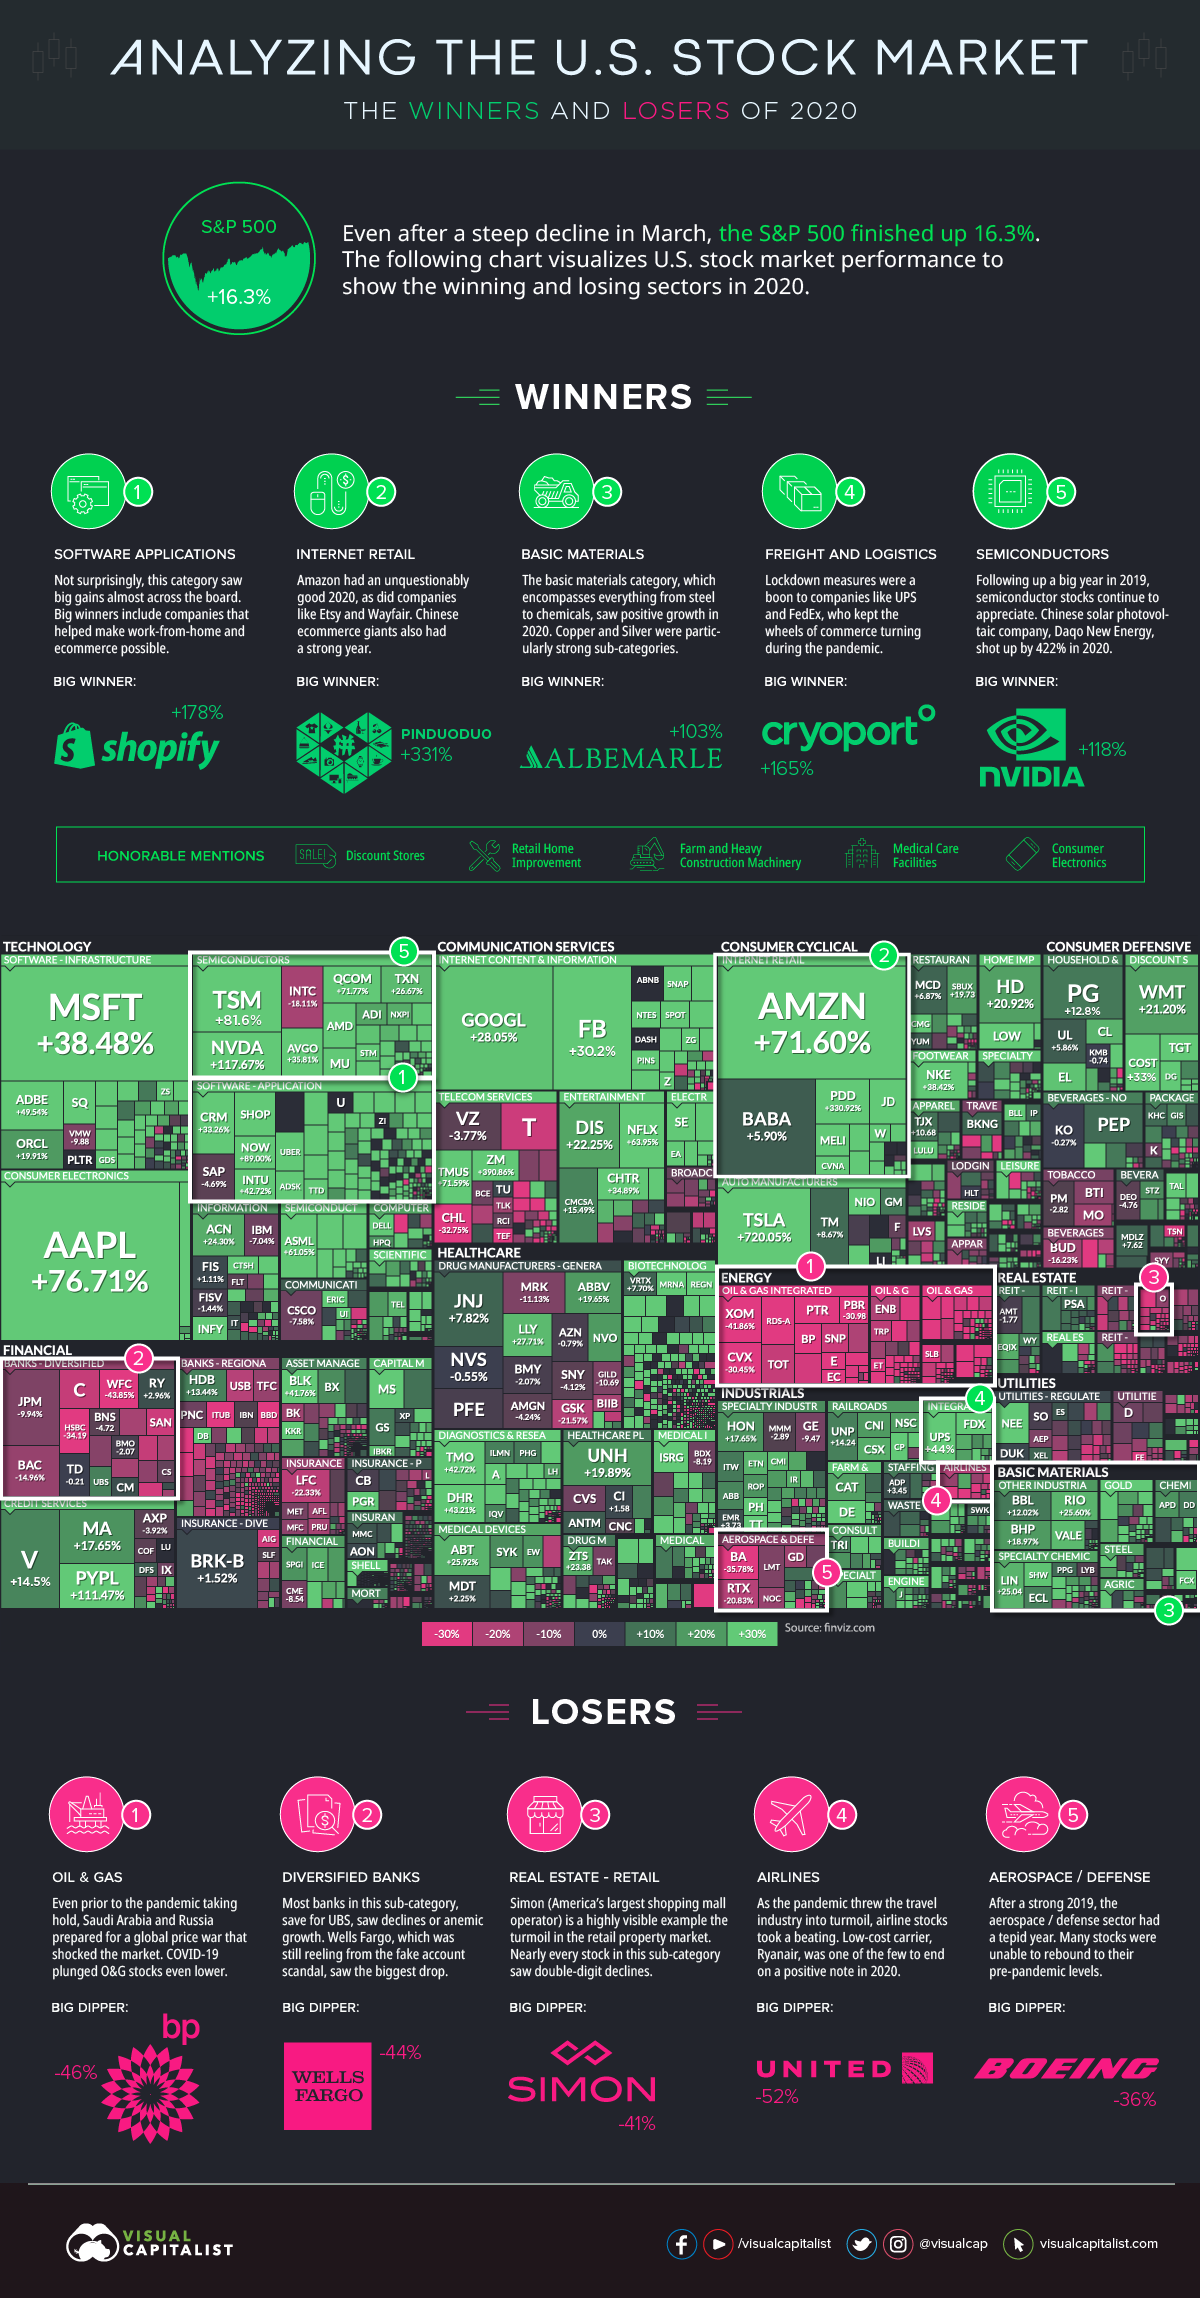
And while the broader economy is still in a state of repair, investors finished the year in the black. The S&P 500, for example, ended with 16.3% gains, which was an above-average outing for the benchmark index.
Winners and Losing Sectors of 2020
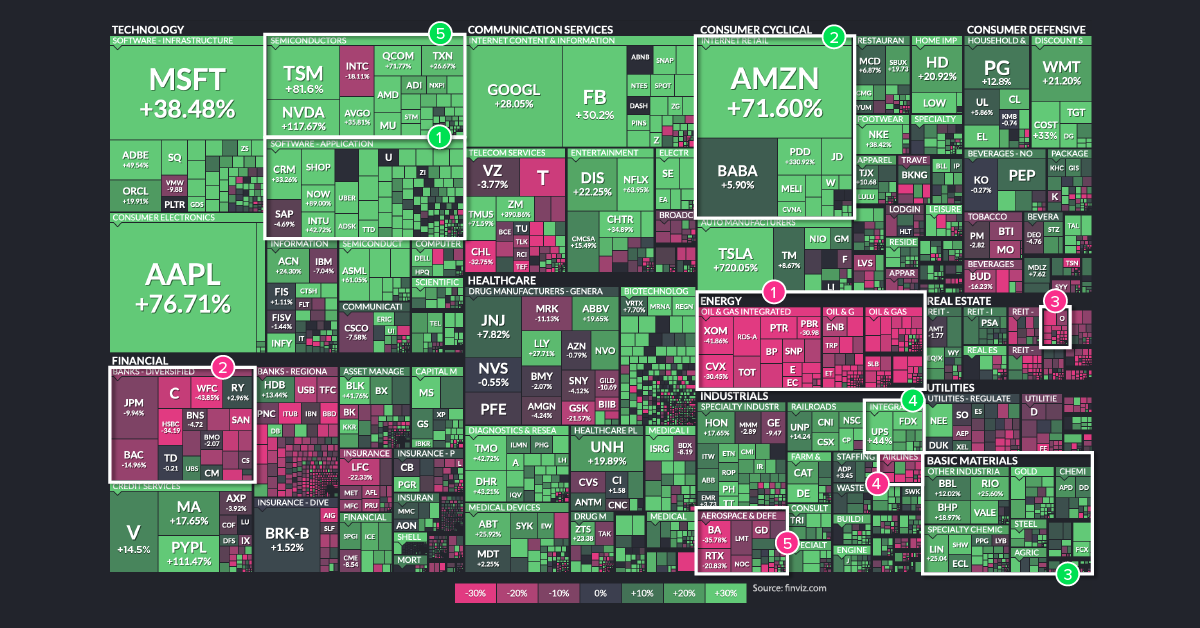
Today’s visualization uses an augmented screenshot of the FinViz treemap, showing the final numbers posted for major U.S.-listed companies, sorted by sector and industry.
As you can see, the best and worst performing sectors generally fall into two categories: those that benefitted from COVID-19, and those that didn’t.
This massive divergence is evident in the numbers. Companies in winning sectors are often up double or triple digits—while their losing counterparts were often down double digits, sometimes even halving in value from how they started the year.
The Winners
1. Software Applications
It was another banner year for Big Tech, but some of the top performing companies were those that acted as enablers to remote working and ecommerce. Perhaps the most notable entry here is Shopify, which rose 178% on the year and is nearly a $150 billion company today.
2. Internet Retail
While Amazon is the undisputed 800-pound gorilla in ecommerce, companies like Etsy and Wayfair also had incredible years—as did many internet retail plays on the opposite side of the Pacific. Chinese company Pinduoduo, described as the fastest growing tech company in the world, gained 331% on the year as it capitalized on emerging trends such as social ecommerce, team purchasing, and consumer-to-manufacturing (C2M) sales.
3. Basic Materials
It’s been a long downtrend in the commodity super cycle, but materials have come back into vogue. Copper prices are at eight-year highs, and gold hit all-time highs in August 2020. Some companies, such as Albemarle—the largest supplier of lithium for electric vehicles—doubled their stock price over the course of the year.
4. Freight and Logistics
The shift to ecommerce has come faster than anticipated, and companies like FedEx and UPS couldn’t be happier. And with the transportation of ultra-refrigerated vaccines lining up to be a key need of 2021, it’s no surprise to see Cryoport up 165% on the year.
5. Semiconductors
For a second straight year, semiconductor companies finished as winners on our list. The world needs more hardware to house and process the ever-expanding datasphere, and companies like Nvidia showed triple-digit gains in 2020, up 117%.
Honorable mentions: Discount stores, retail home improvement, farm and heavy construction machinery, medical care facilities, and consumer electronics
The Losers
1. Oil and Gas
The oil sector was already struggling pre-COVID with price wars and a supply glut, but then lockdowns and the shutdown of non-essential travel provided another blow. BP finished the year at nearly half its market capitalization, falling 46% on the year.
2. Diversified Banks
With record-low interest rates, shuttered physical locations, and credit risks looming from unemployed borrowers, bank stocks struggled in 2020. Wells Fargo, for example, finished down the year 44%.
3. Real Estate – Retail
Many malls have not been collecting rent checks from their tenants, creating a challenging environment for many property owners and managers. Simon, the country’s largest shopping mall operator, felt the pain as its stock dropped 41% in 2020.
4. Airlines
It goes without saying that less flying means less revenue for airlines. But going forward, with web conferencing now the professional norm, it’s also expected that lucrative business passenger numbers will take a hit in the future. United Airlines finished the year at less than half their market capitalization (-54%).
5. Aerospace/Defense
Many aerospace and defense stocks were unable to rebound to pre-pandemic levels. Boeing, for example, finished the year down 36%.


Markets
The European Stock Market: Attractive Valuations Offer Opportunities
On average, the European stock market has valuations that are nearly 50% lower than U.S. valuations. But how can you access the market?


European Stock Market: Attractive Valuations Offer Opportunities
Europe is known for some established brands, from L’Oréal to Louis Vuitton. However, the European stock market offers additional opportunities that may be lesser known.
The above infographic, sponsored by STOXX, outlines why investors may want to consider European stocks.
Attractive Valuations
Compared to most North American and Asian markets, European stocks offer lower or comparable valuations.
| Index | Price-to-Earnings Ratio | Price-to-Book Ratio |
|---|---|---|
| EURO STOXX 50 | 14.9 | 2.2 |
| STOXX Europe 600 | 14.4 | 2 |
| U.S. | 25.9 | 4.7 |
| Canada | 16.1 | 1.8 |
| Japan | 15.4 | 1.6 |
| Asia Pacific ex. China | 17.1 | 1.8 |
Data as of February 29, 2024. See graphic for full index names. Ratios based on trailing 12 month financials. The price to earnings ratio excludes companies with negative earnings.
On average, European valuations are nearly 50% lower than U.S. valuations, potentially offering an affordable entry point for investors.
Research also shows that lower price ratios have historically led to higher long-term returns.
Market Movements Not Closely Connected
Over the last decade, the European stock market had low-to-moderate correlation with North American and Asian equities.
The below chart shows correlations from February 2014 to February 2024. A value closer to zero indicates low correlation, while a value of one would indicate that two regions are moving in perfect unison.
| EURO STOXX 50 | STOXX EUROPE 600 | U.S. | Canada | Japan | Asia Pacific ex. China |
|
|---|---|---|---|---|---|---|
| EURO STOXX 50 | 1.00 | 0.97 | 0.55 | 0.67 | 0.24 | 0.43 |
| STOXX EUROPE 600 | 1.00 | 0.56 | 0.71 | 0.28 | 0.48 | |
| U.S. | 1.00 | 0.73 | 0.12 | 0.25 | ||
| Canada | 1.00 | 0.22 | 0.40 | |||
| Japan | 1.00 | 0.88 | ||||
| Asia Pacific ex. China | 1.00 |
Data is based on daily USD returns.
European equities had relatively independent market movements from North American and Asian markets. One contributing factor could be the differing sector weights in each market. For instance, technology makes up a quarter of the U.S. market, but health care and industrials dominate the broader European market.
Ultimately, European equities can enhance portfolio diversification and have the potential to mitigate risk for investors.
Tracking the Market
For investors interested in European equities, STOXX offers a variety of flagship indices:
| Index | Description | Market Cap |
|---|---|---|
| STOXX Europe 600 | Pan-regional, broad market | €10.5T |
| STOXX Developed Europe | Pan-regional, broad-market | €9.9T |
| STOXX Europe 600 ESG-X | Pan-regional, broad market, sustainability focus | €9.7T |
| STOXX Europe 50 | Pan-regional, blue-chip | €5.1T |
| EURO STOXX 50 | Eurozone, blue-chip | €3.5T |
Data is as of February 29, 2024. Market cap is free float, which represents the shares that are readily available for public trading on stock exchanges.
The EURO STOXX 50 tracks the Eurozone’s biggest and most traded companies. It also underlies one of the world’s largest ranges of ETFs and mutual funds. As of November 2023, there were €27.3 billion in ETFs and €23.5B in mutual fund assets under management tracking the index.
“For the past 25 years, the EURO STOXX 50 has served as an accurate, reliable and tradable representation of the Eurozone equity market.”
— Axel Lomholt, General Manager at STOXX
Partnering with STOXX to Track the European Stock Market
Are you interested in European equities? STOXX can be a valuable partner:
- Comprehensive, liquid and investable ecosystem
- European heritage, global reach
- Highly sophisticated customization capabilities
- Open architecture approach to using data
- Close partnerships with clients
- Part of ISS STOXX and Deutsche Börse Group
With a full suite of indices, STOXX can help you benchmark against the European stock market.
Learn how STOXX’s European indices offer liquid and effective market access.

-

 Economy2 days ago
Economic Growth Forecasts for G7 and BRICS Countries in 2024
The IMF has released its economic growth forecasts for 2024. How do the G7 and BRICS countries compare?
-

 Markets2 weeks ago
U.S. Debt Interest Payments Reach $1 Trillion
U.S. debt interest payments have surged past the $1 trillion dollar mark, amid high interest rates and an ever-expanding debt burden.
-

 United States2 weeks ago
Ranked: The Largest U.S. Corporations by Number of Employees
We visualized the top U.S. companies by employees, revealing the massive scale of retailers like Walmart, Target, and Home Depot.
-

 Markets2 weeks ago
The Top 10 States by Real GDP Growth in 2023
This graphic shows the states with the highest real GDP growth rate in 2023, largely propelled by the oil and gas boom.
-

 Markets2 weeks ago
Ranked: The World’s Top Flight Routes, by Revenue
In this graphic, we show the highest earning flight routes globally as air travel continued to rebound in 2023.
-

 Markets3 weeks ago
Ranked: The Most Valuable Housing Markets in America
The U.S. residential real estate market is worth a staggering $47.5 trillion. Here are the most valuable housing markets in the country.


-

 Debt1 week ago
How Debt-to-GDP Ratios Have Changed Since 2000
-
Markets2 weeks ago
Ranked: The World’s Top Flight Routes, by Revenue
-

 Countries2 weeks ago
Population Projections: The World’s 6 Largest Countries in 2075
-
Markets2 weeks ago
The Top 10 States by Real GDP Growth in 2023
-

 Demographics2 weeks ago
The Smallest Gender Wage Gaps in OECD Countries
-

 United States2 weeks ago
Where U.S. Inflation Hit the Hardest in March 2024
-

 Green2 weeks ago
Top Countries By Forest Growth Since 2001
-
United States2 weeks ago
Ranked: The Largest U.S. Corporations by Number of Employees