

We visualized the top U.S. companies by employees, revealing the massive scale of retailers like Walmart, Target, and Home Depot.
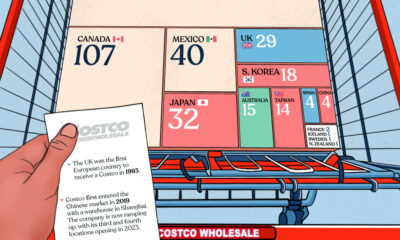

This graphic breaks down the number of Costco stores globally, providing insight into the retailer's global presence.
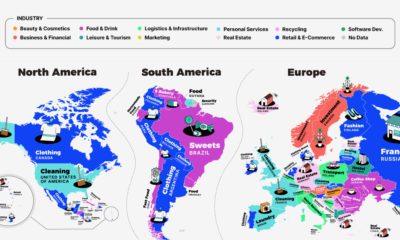

This series of maps shows a regional breakdown of the most popular types of businesses people want to start, based on online search results.
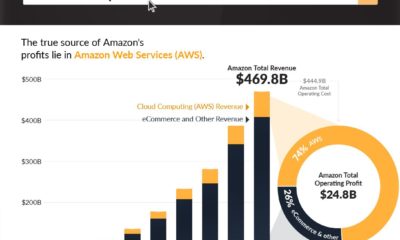

Amazon is best known for its sprawling ecommerce empire, but three-quarters of the company's profits actually come from cloud computing.


China’s economy reached a GDP of 114 trillion yuan ($18 trillion) in 2021, well above government targets. What sectors drove that growth?
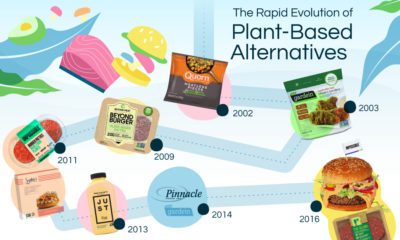

2020 plant-based alternatives sales surpassed $7 billion in the U.S. alone. How did this explosion in plant-based alternatives start?
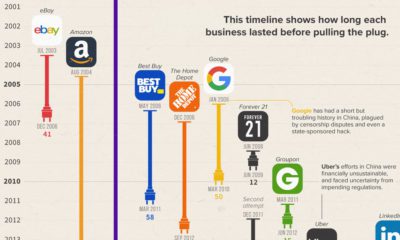

The Chinese market is notoriously difficult for foreign businesses to gain a foothold in. Here, we look at U.S. brands that tried and failed


COVID-19 hit the global economy hard, but some companies thrived amidst the chaos. Here are the top 100 most valuable brands of 2021.
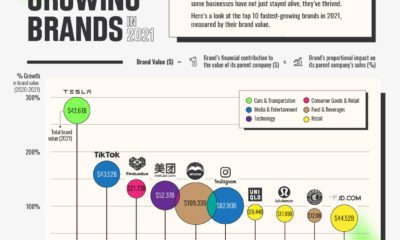

Tesla takes the top spot as the fastest growing brand this year, while TikTok comes in second place.
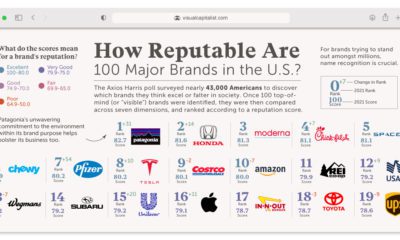

What comes to mind when you think of a good or bad brand? This poll ranks the brand reputation of 100 major companies in America.


 Creator Program