Energy
How Oil Prices Went Subzero: Explaining the COVID-19 Oil Crash
Explaining the Historic COVID-19 Oil Price Crash
The Great Lockdown continues to turn markets on their head.
Last week, we dug into the unprecedented number of initial jobless claims coming out of the United States, which topped 22 million in a period of four weeks.
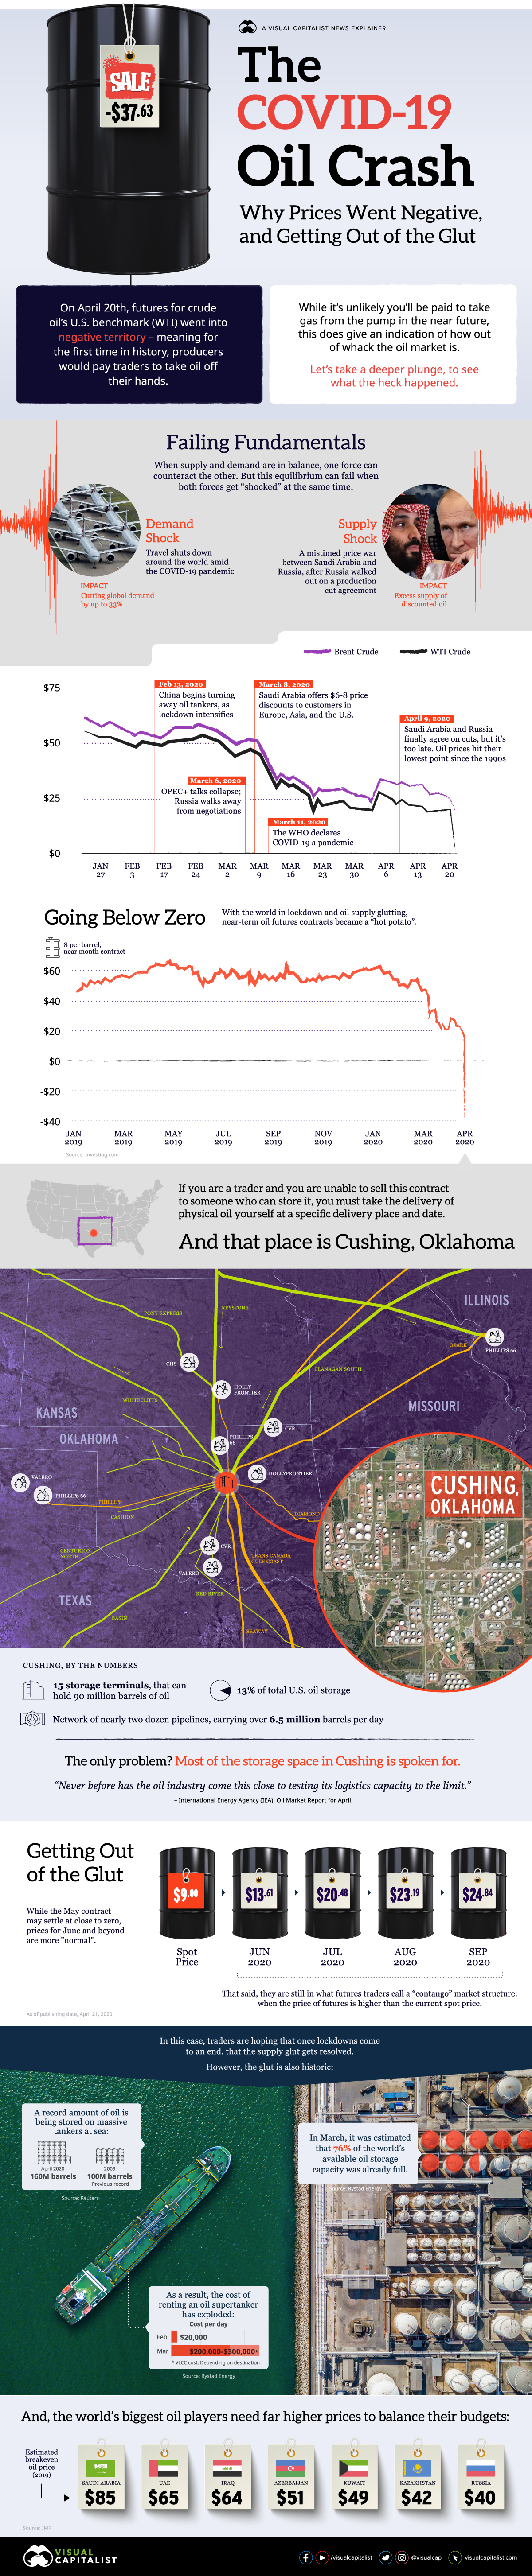
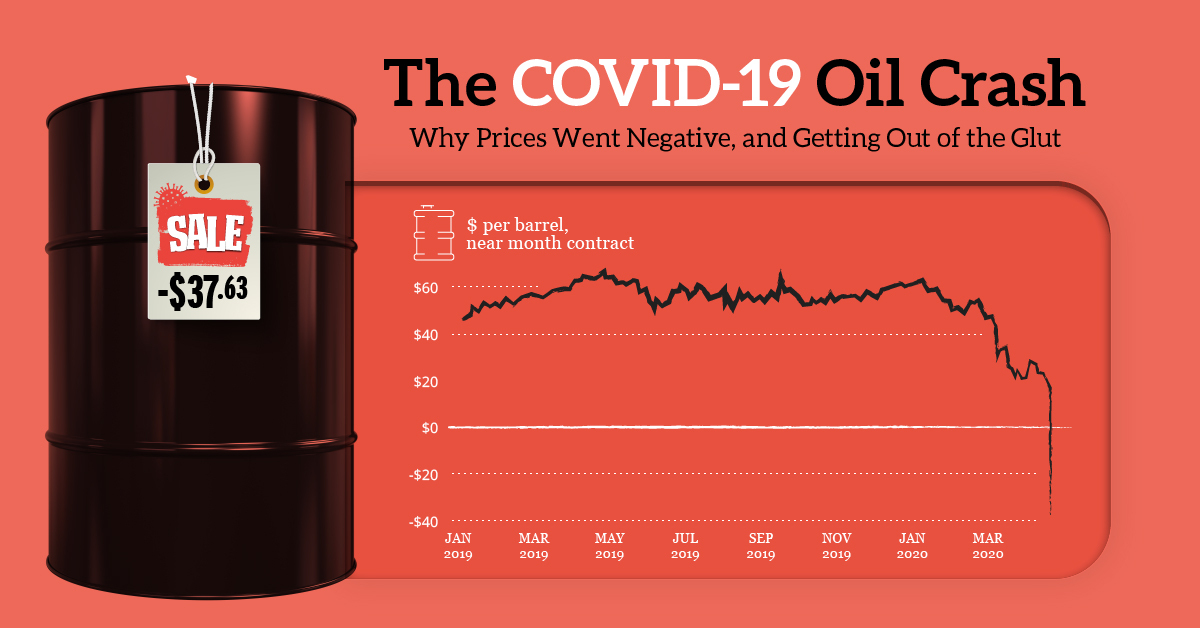
It’s just days later, and we already have our next market abnormality: this time, traders were baffled by West Texas Intermediate (WTI) crude — the U.S. benchmark oil price — which somehow flipped negative for the first time in history.
How is that possible? And how does it tie into the COVID-19 oil price crash in general?
Setting the Geopolitical Stage
Oil is a geopolitical game, and big price swings always come with a geopolitical undercurrent.
This particular story picked up steam in February as OPEC+ producers tried to negotiate a production cut, amid concerns that COVID-19 could impact demand. Russia walked out on these meetings, and Saudi Arabia responded by undercutting oil prices by $6-8 per barrel.
The world went into lockdown, energy demand dissipated, and oil producers continued to pump at will. Then on April 9th, nearly a full month after COVID-19 was declared a pandemic, Russia and Saudi Arabia finally settled their differences.
However, this truce came too late — prices had already fell about 60% from February highs.
How Prices Went Subzero
Up until recently, this was a fairly run-of-the-mill oil price crash — but then prices suddenly sunk below zero, with May futures for WTI oil closing at -$37.63 on April 20th.
For the first time in history, producers were willing to pay traders to take oil off their hands. This oddity is partially a function of the particularities of futures contracts:
- Buyers Wanted (At Any Cost!)
Futures contracts normally rollover to the next month without much happening, but in this case traders saw the May contract as a “hot potato”. No one wanted to be stuck taking delivery of oil when the world is awash in it and the country is in lockdown. - A Time and a Place
Oil futures contracts specify a time and place for delivery. For WTI oil, that specific place is Cushing, Oklahoma. With most storage capacity booked already, taking physical delivery wasn’t even an option for many players.
In other words, sellers outnumbered buyers by a crazy margin — and because oil is a physical commodity, someone has to ultimately take the contract.
At time of publishing, the May contract and spot prices have “rebounded” to about $10. The June contract is slightly higher, at $13.
“Never before has the oil industry come this close to testing its logistics capacity to the limit.”
– International Energy Agency (IEA), Oil Market Report for April
Overcoming the Supply Glut
What do you do when oil is practically free?
You store as much of it as you can, and hope that at some point you can sell it for more.
Unfortunately, everyone has the exact same idea, and as a result there is a historic glut that is filling up the world’s storage capacity both on land and at sea:
- In March, it was estimated that 76% of the world’s available oil storage capacity was already full.
- A record-setting 160 million barrels of oil is being stored on tankers at sea, according to Reuters.
- The cost of renting an oil supertanker has gone through the roof. It’s jumped from $20,000 per day to $200,000-$300,000 per day, according to Rystad Energy.
It remains to be seen how fast the transportation industry will recover in a post-COVID-19 world, but for now the outlook for all oil producers is grim. The continued fallout will not only affect industry, but also the countries that rely on oil exports to balance their budgets.


Energy
Charted: 4 Reasons Why Lithium Could Be the Next Gold Rush
Visual Capitalist has partnered with EnergyX to show why drops in prices and growing demand may make now the right time to invest in lithium.


4 Reasons Why You Should Invest in Lithium
Lithium’s importance in powering EVs makes it a linchpin of the clean energy transition and one of the world’s most precious minerals.
In this graphic, Visual Capitalist partnered with EnergyX to explore why now may be the time to invest in lithium.
1. Lithium Prices Have Dropped
One of the most critical aspects of evaluating an investment is ensuring that the asset’s value is higher than its price would indicate. Lithium is integral to powering EVs, and, prices have fallen fast over the last year:
| Date | LiOH·H₂O* | Li₂CO₃** |
|---|---|---|
| Feb 2023 | $76 | $71 |
| March 2023 | $71 | $61 |
| Apr 2023 | $43 | $33 |
| May 2023 | $43 | $33 |
| June 2023 | $47 | $45 |
| July 2023 | $44 | $40 |
| Aug 2023 | $35 | $35 |
| Sept 2023 | $28 | $27 |
| Oct 2023 | $24 | $23 |
| Nov 2023 | $21 | $21 |
| Dec 2023 | $17 | $16 |
| Jan 2024 | $14 | $15 |
| Feb 2024 | $13 | $14 |
Note: Monthly spot prices were taken as close to the 14th of each month as possible.
*Lithium hydroxide monohydrate MB-LI-0033
**Lithium carbonate MB-LI-0029
2. Lithium-Ion Battery Prices Are Also Falling
The drop in lithium prices is just one reason to invest in the metal. Increasing economies of scale, coupled with low commodity prices, have caused the cost of lithium-ion batteries to drop significantly as well.
In fact, BNEF reports that between 2013 and 2023, the price of a Li-ion battery dropped by 82%.
| Year | Price per KWh |
|---|---|
| 2023 | $139 |
| 2022 | $161 |
| 2021 | $150 |
| 2020 | $160 |
| 2019 | $183 |
| 2018 | $211 |
| 2017 | $258 |
| 2016 | $345 |
| 2015 | $448 |
| 2014 | $692 |
| 2013 | $780 |

3. EV Adoption is Sustainable
One of the best reasons to invest in lithium is that EVs, one of the main drivers behind the demand for lithium, have reached a price point similar to that of traditional vehicle.
According to the Kelly Blue Book, Tesla’s average transaction price dropped by 25% between 2022 and 2023, bringing it in line with many other major manufacturers and showing that EVs are a realistic transport option from a consumer price perspective.
| Manufacturer | September 2022 | September 2023 |
|---|---|---|
| BMW | $69,000 | $72,000 |
| Ford | $54,000 | $56,000 |
| Volkswagon | $54,000 | $56,000 |
| General Motors | $52,000 | $53,000 |
| Tesla | $68,000 | $51,000 |
4. Electricity Demand in Transport is Growing
As EVs become an accessible transport option, there’s an investment opportunity in lithium. But possibly the best reason to invest in lithium is that the IEA reports global demand for the electricity in transport could grow dramatically by 2030:
| Transport Type | 2022 | 2025 | 2030 |
|---|---|---|---|
| Buses 🚌 | 23,000 GWh | 50,000 GWh | 130,000 GWh |
| Cars 🚙 | 65,000 GWh | 200,000 GWh | 570,000 GWh |
| Trucks 🛻 | 4,000 GWh | 15,000 GWh | 94,000 GWh |
| Vans 🚐 | 6,000 GWh | 16,000 GWh | 72,000 GWh |
The Lithium Investment Opportunity
Lithium presents a potentially classic investment opportunity. Lithium and battery prices have dropped significantly, and recently, EVs have reached a price point similar to other vehicles. By 2030, the demand for clean energy, especially in transport, will grow dramatically.
With prices dropping and demand skyrocketing, now is the time to invest in lithium.
EnergyX is poised to exploit lithium demand with cutting-edge lithium extraction technology capable of extracting 300% more lithium than current processes.

-

 Lithium4 days ago
Ranked: The Top 10 EV Battery Manufacturers in 2023
Asia dominates this ranking of the world’s largest EV battery manufacturers in 2023.
-

 Energy1 week ago
The World’s Biggest Nuclear Energy Producers
China has grown its nuclear capacity over the last decade, now ranking second on the list of top nuclear energy producers.
-

 Energy1 month ago
The World’s Biggest Oil Producers in 2023
Just three countries accounted for 40% of global oil production last year.
-

 Energy1 month ago
How Much Does the U.S. Depend on Russian Uranium?
Currently, Russia is the largest foreign supplier of nuclear power fuel to the U.S.
-

 Uranium2 months ago
Charted: Global Uranium Reserves, by Country
We visualize the distribution of the world’s uranium reserves by country, with 3 countries accounting for more than half of total reserves.
-

 Energy3 months ago
Visualizing the Rise of the U.S. as Top Crude Oil Producer
Over the last decade, the United States has established itself as the world’s top producer of crude oil, surpassing Saudi Arabia and Russia.


-

 Debt1 week ago
How Debt-to-GDP Ratios Have Changed Since 2000
-

 Markets2 weeks ago
Ranked: The World’s Top Flight Routes, by Revenue
-

 Countries2 weeks ago
Population Projections: The World’s 6 Largest Countries in 2075
-

 Markets2 weeks ago
The Top 10 States by Real GDP Growth in 2023
-

 Demographics2 weeks ago
The Smallest Gender Wage Gaps in OECD Countries
-

 United States2 weeks ago
Where U.S. Inflation Hit the Hardest in March 2024
-

 Green2 weeks ago
Top Countries By Forest Growth Since 2001
-

 United States2 weeks ago
Ranked: The Largest U.S. Corporations by Number of Employees