Markets
Navigating Uncertainty: Leadership Accountability in Times of Crisis
In the face of adversity, leaders may struggle to manage their teams effectively.
Before the COVID-19 outbreak, over half of all professionals globally worked remotely at least 2.5 days a week. This has since increased dramatically, with 88% of organizations now insisting their employees work from home and implement social distancing.
Leaders must adapt to a more flexible workplace and create a culture of accountability so that their organization can successfully weather the COVID-19 storm.
Leadership Accountability in Uncertain Times
Today’s infographic, from bestselling author Vince Molinaro, reveals the five behaviors that leaders can adopt in order to provide thoughtful navigation through uncertainty.

>> Join Vince Molinaro’s Community of Accountable Leaders
The Impact of Leadership Accountability
As the workforce pivots to remote working arrangements, the benefits of flexible working policies are coming into sharper focus.
Research shows that these policies can lower overhead costs, reduce commuting times and increase employee satisfaction—in addition to attracting top talent. Moreover, the shift to working remotely could boost the U.S. economy by $4.5 trillion annually by 2030.
But achieving these benefits requires accountability from everyone in an organization, and in an increasingly virtual world, that can become difficult to manage.
Challenges Facing Leaders Today
Leaders are already subject to an array of challenges that they must overcome, such as:
- The pressure to differentiate: Leaders feel an unrelenting pressure to innovate and help their organizations stand out in a sea of ruthless competitors.
- Executing the strategy: Leaders must align the organization to ensure employees are clear about what needs to get done to execute priorities seamlessly.
- Leading transformational change: With so many moving parts, constant change across several aspects of a business can be difficult for leaders to manage.
- Creating enduring value: Customers, boards, and shareholders have high expectations for leaders in exchange for their loyalty.
- Building future talent: Leaders must build and nurture the next generation of leaders in addition to managing the day-to-day.
These mounting pressures can have a detrimental impact on a business leader’s performance, so it is crucial that they get the support they need now, more than ever.
The Characteristics of Accountable Leaders
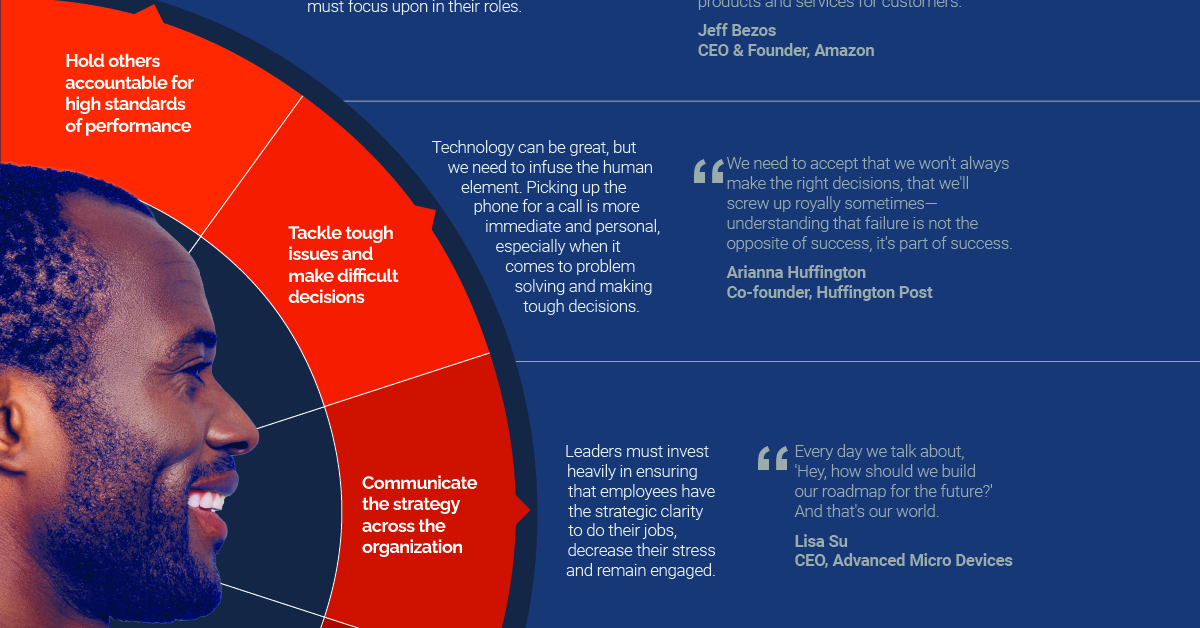
Truly accountable leadership is the only way an organization can weather uncertainty in a world that has been upended. Research reveals that among the strongest performing companies, accountable leaders consistently demonstrate five behaviors that set them apart from others.
- Hold others accountable for high standards of performance
Good leaders make mutual expectations clear by consistently reinforcing what is important, and what employees should prioritize in their roles. - Tackle tough issues and make difficult decisions
Technology is hugely beneficial, but it should never replace the human element. Picking up the phone or having a Skype call is more immediate and personal, especially when it comes to problem solving and making tough decisions. - Communicate the strategy across the organization
Leaders must ensure that employees have complete clarity in terms of the company’s vision to do their jobs effectively. Creating a set of well-defined goals can help people stay engaged and decrease their stress levels. - Express optimism about the company and its future
Many employees can feel isolated and disconnected in the virtual world, so leaders must provide support, positive energy, and a sense of hope for the future. - Display clarity about external trends in the business environment
Finally, it is critical to help employees make sense of the current situation right now. Leaders must provide honest and transparent communication in a way that manages fear, stress, and anxiety. This encourages employees’s determination to help the organization succeed.
Leading The Future
As we embrace the unknown, it is clear that leadership accountability will become more important than ever.
In fact, it has become a crucial element for future-proofing organizations in times of crisis or drastic change. Perhaps more importantly, it is necessary for encouraging teams to emerge more connected and resilient than ever before.


Markets
The European Stock Market: Attractive Valuations Offer Opportunities
On average, the European stock market has valuations that are nearly 50% lower than U.S. valuations. But how can you access the market?


European Stock Market: Attractive Valuations Offer Opportunities
Europe is known for some established brands, from L’Oréal to Louis Vuitton. However, the European stock market offers additional opportunities that may be lesser known.
The above infographic, sponsored by STOXX, outlines why investors may want to consider European stocks.
Attractive Valuations
Compared to most North American and Asian markets, European stocks offer lower or comparable valuations.
| Index | Price-to-Earnings Ratio | Price-to-Book Ratio |
|---|---|---|
| EURO STOXX 50 | 14.9 | 2.2 |
| STOXX Europe 600 | 14.4 | 2 |
| U.S. | 25.9 | 4.7 |
| Canada | 16.1 | 1.8 |
| Japan | 15.4 | 1.6 |
| Asia Pacific ex. China | 17.1 | 1.8 |
Data as of February 29, 2024. See graphic for full index names. Ratios based on trailing 12 month financials. The price to earnings ratio excludes companies with negative earnings.
On average, European valuations are nearly 50% lower than U.S. valuations, potentially offering an affordable entry point for investors.
Research also shows that lower price ratios have historically led to higher long-term returns.
Market Movements Not Closely Connected
Over the last decade, the European stock market had low-to-moderate correlation with North American and Asian equities.
The below chart shows correlations from February 2014 to February 2024. A value closer to zero indicates low correlation, while a value of one would indicate that two regions are moving in perfect unison.
| EURO STOXX 50 | STOXX EUROPE 600 | U.S. | Canada | Japan | Asia Pacific ex. China |
|
|---|---|---|---|---|---|---|
| EURO STOXX 50 | 1.00 | 0.97 | 0.55 | 0.67 | 0.24 | 0.43 |
| STOXX EUROPE 600 | 1.00 | 0.56 | 0.71 | 0.28 | 0.48 | |
| U.S. | 1.00 | 0.73 | 0.12 | 0.25 | ||
| Canada | 1.00 | 0.22 | 0.40 | |||
| Japan | 1.00 | 0.88 | ||||
| Asia Pacific ex. China | 1.00 |
Data is based on daily USD returns.
European equities had relatively independent market movements from North American and Asian markets. One contributing factor could be the differing sector weights in each market. For instance, technology makes up a quarter of the U.S. market, but health care and industrials dominate the broader European market.
Ultimately, European equities can enhance portfolio diversification and have the potential to mitigate risk for investors.
Tracking the Market
For investors interested in European equities, STOXX offers a variety of flagship indices:
| Index | Description | Market Cap |
|---|---|---|
| STOXX Europe 600 | Pan-regional, broad market | €10.5T |
| STOXX Developed Europe | Pan-regional, broad-market | €9.9T |
| STOXX Europe 600 ESG-X | Pan-regional, broad market, sustainability focus | €9.7T |
| STOXX Europe 50 | Pan-regional, blue-chip | €5.1T |
| EURO STOXX 50 | Eurozone, blue-chip | €3.5T |
Data is as of February 29, 2024. Market cap is free float, which represents the shares that are readily available for public trading on stock exchanges.
The EURO STOXX 50 tracks the Eurozone’s biggest and most traded companies. It also underlies one of the world’s largest ranges of ETFs and mutual funds. As of November 2023, there were €27.3 billion in ETFs and €23.5B in mutual fund assets under management tracking the index.
“For the past 25 years, the EURO STOXX 50 has served as an accurate, reliable and tradable representation of the Eurozone equity market.”
— Axel Lomholt, General Manager at STOXX
Partnering with STOXX to Track the European Stock Market
Are you interested in European equities? STOXX can be a valuable partner:
- Comprehensive, liquid and investable ecosystem
- European heritage, global reach
- Highly sophisticated customization capabilities
- Open architecture approach to using data
- Close partnerships with clients
- Part of ISS STOXX and Deutsche Börse Group
With a full suite of indices, STOXX can help you benchmark against the European stock market.
Learn how STOXX’s European indices offer liquid and effective market access.

-

 Economy22 hours ago
Economic Growth Forecasts for G7 and BRICS Countries in 2024
The IMF has released its economic growth forecasts for 2024. How do the G7 and BRICS countries compare?
-

 Markets1 week ago
U.S. Debt Interest Payments Reach $1 Trillion
U.S. debt interest payments have surged past the $1 trillion dollar mark, amid high interest rates and an ever-expanding debt burden.
-

 United States1 week ago
Ranked: The Largest U.S. Corporations by Number of Employees
We visualized the top U.S. companies by employees, revealing the massive scale of retailers like Walmart, Target, and Home Depot.
-

 Markets2 weeks ago
The Top 10 States by Real GDP Growth in 2023
This graphic shows the states with the highest real GDP growth rate in 2023, largely propelled by the oil and gas boom.
-

 Markets2 weeks ago
Ranked: The World’s Top Flight Routes, by Revenue
In this graphic, we show the highest earning flight routes globally as air travel continued to rebound in 2023.
-

 Markets2 weeks ago
Ranked: The Most Valuable Housing Markets in America
The U.S. residential real estate market is worth a staggering $47.5 trillion. Here are the most valuable housing markets in the country.


-

 Mining1 week ago
Gold vs. S&P 500: Which Has Grown More Over Five Years?
-
Markets2 weeks ago
Ranked: The Most Valuable Housing Markets in America
-

 Money2 weeks ago
Which States Have the Highest Minimum Wage in America?
-

 AI2 weeks ago
Ranked: Semiconductor Companies by Industry Revenue Share
-
Markets2 weeks ago
Ranked: The World’s Top Flight Routes, by Revenue
-

 Demographics2 weeks ago
Population Projections: The World’s 6 Largest Countries in 2075
-
Markets2 weeks ago
The Top 10 States by Real GDP Growth in 2023
-

 Demographics2 weeks ago
The Smallest Gender Wage Gaps in OECD Countries