Markets
How COVID-19 Consumer Spending is Impacting Industries
How COVID-19 Consumer Spending is Impacting Industries
Consumer spending is one of the most important driving forces for global economic growth.
Beyond impacting some of the factors that determine consumer spend—such as consumer confidence, unemployment levels, or the cost of living—the COVID-19 pandemic has also drastically altered how and where consumers choose to spend their hard-earned cash.
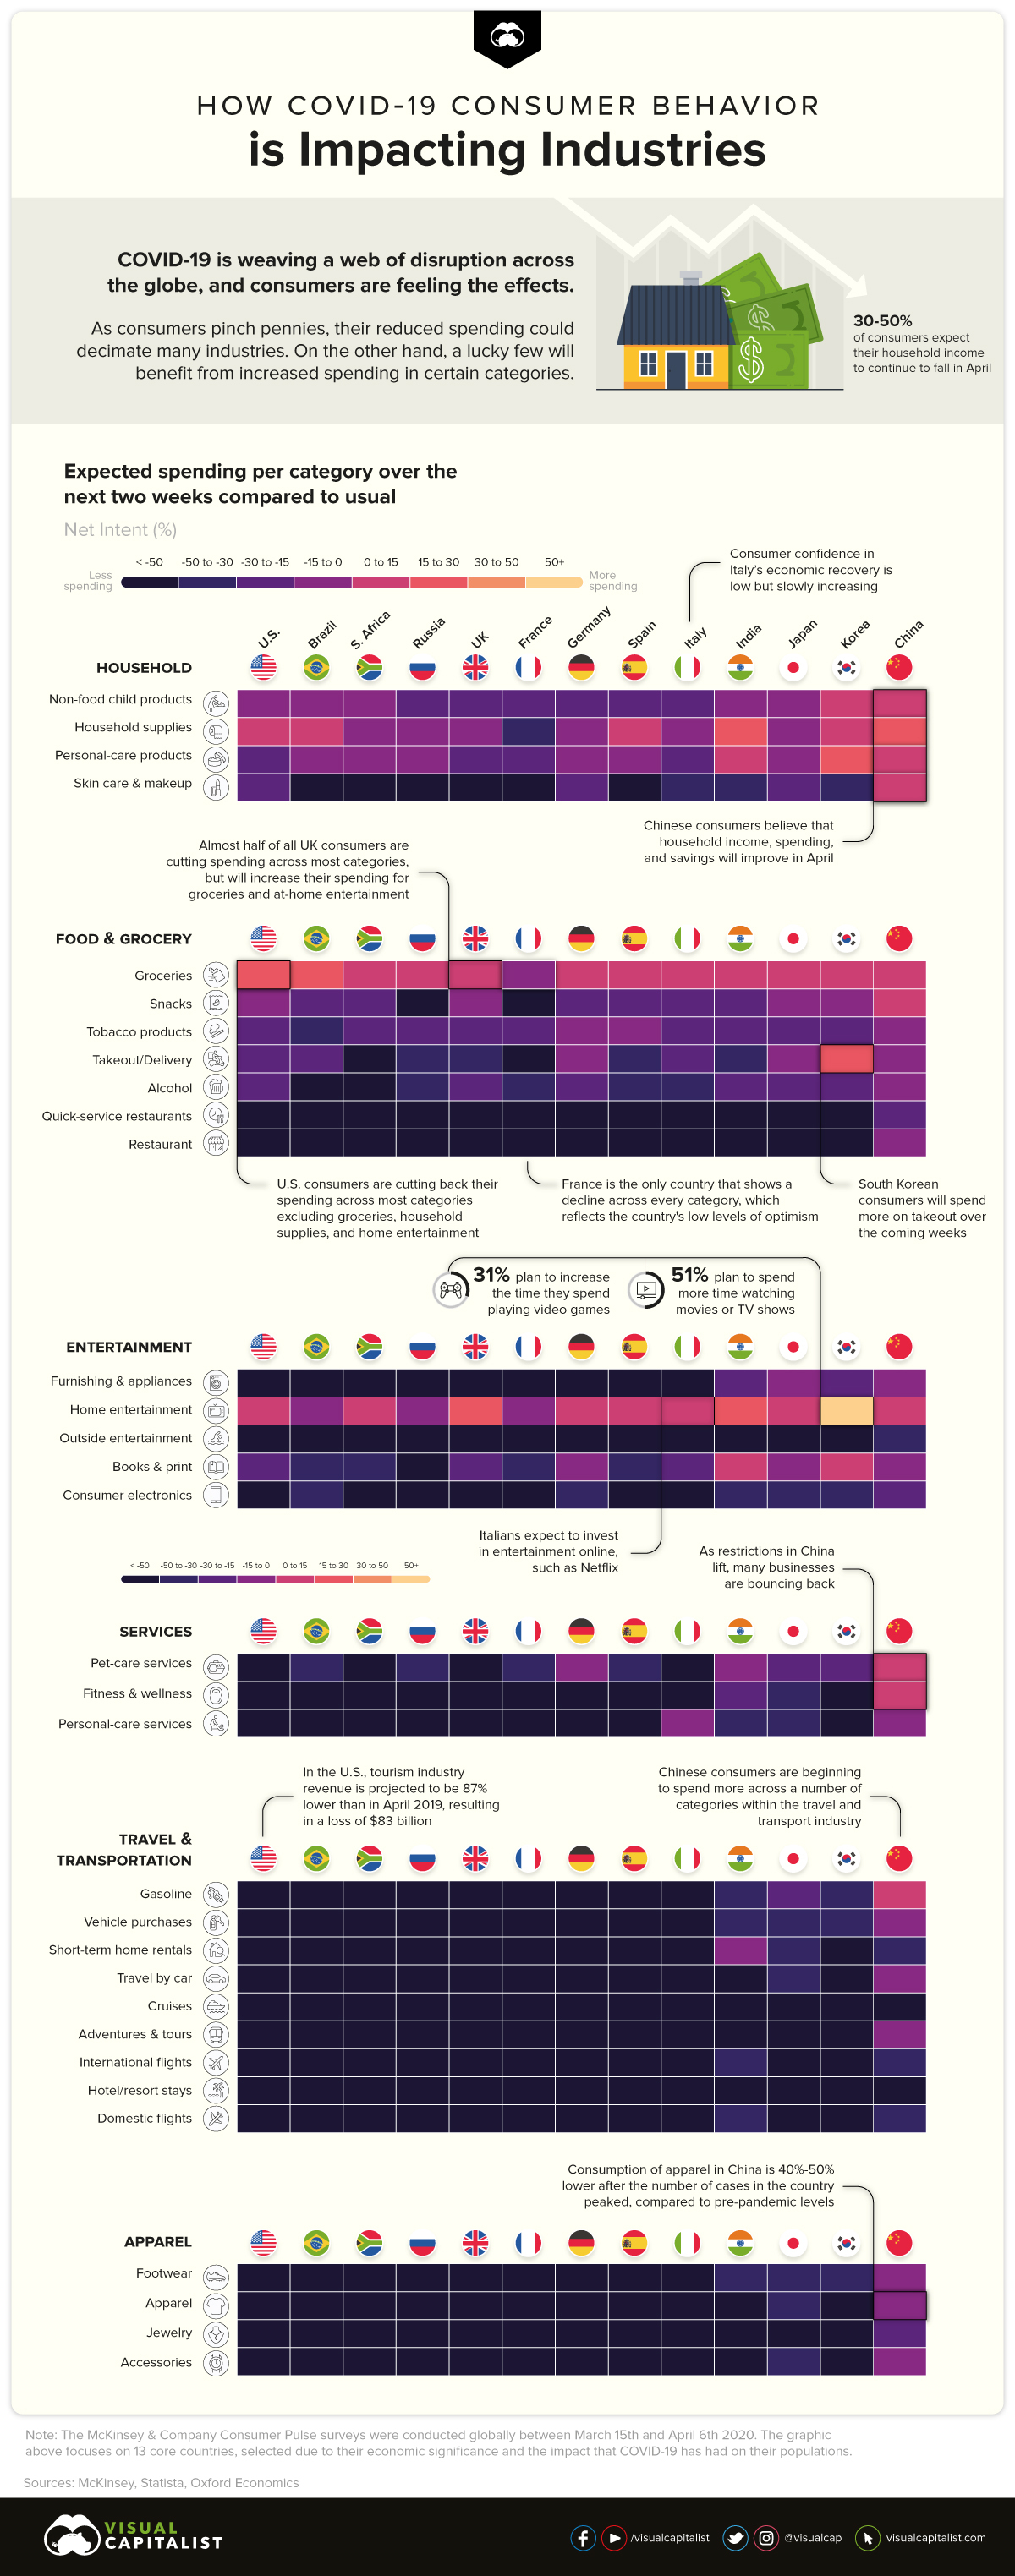
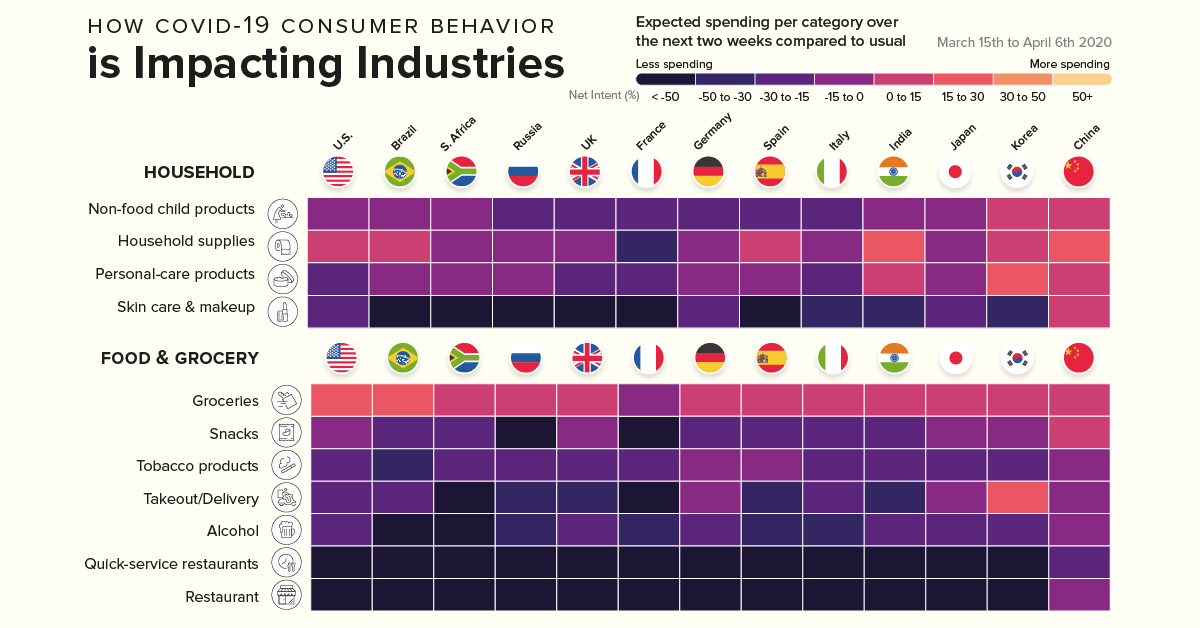
Today’s graphic pulls data from a global survey by McKinsey & Company that analyzes how consumers are reining in their spending, causing upheaval across every industry imaginable.
While some industries are in a better position to weather the impact of this storm, others could struggle to survive.
The Link Between Sentiment and Intent to Spend
As consumers grapple with uncertainty, their buying behavior becomes more erratic. What is clear however, is that they have reduced spending on all non-essential products and services.
But as each country moves along the COVID-19 curve, we can see a glimmer of increasing optimism levels, which in turn is linked to higher spending.
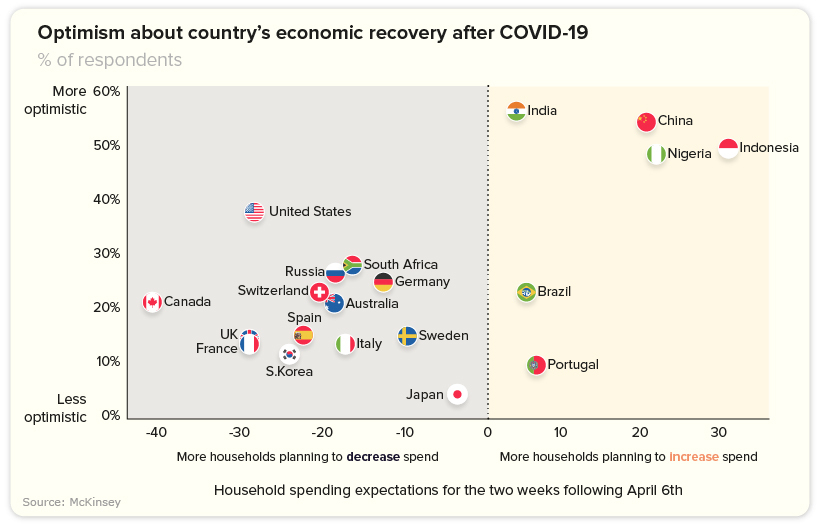
India’s consumers, for example, are displaying higher levels of optimism, with more households planning to increase spend—a trend that is also evident in China, Indonesia, and Nigeria.
Meanwhile, American consumers are still more optimistic about the future than Europeans. 37% of Americans believe the country will recover in 2 or 3 months—albeit with optimism levels at the highest for people who earn over $100K.
Strategic Consumer Spending
Globally, consumers continue to spend—and in some cases, spend more compared to pre-pandemic levels—on some necessities such as groceries and household supplies.
Due to changes in media consumption habits, consumers in almost all countries surveyed say they will increase their spend on at-home entertainment. This is especially true for Korea, a country that already boasts a massive gaming culture.
As restrictions in China lift, many categories such as gasoline, wellness, and pet-care services appear to be bouncing back, which could be a positive sign for other countries following a similar trajectory. But while consumers amp up their spending on the things they need, they also anticipate spending less in other categories.
The Industries in the Red
Categories showing an alarming decline include restaurants and out-of-home entertainment.
However, there are two particularly hard-hit industries worth noting that are showing declines across every category and country:
Travel and Transport
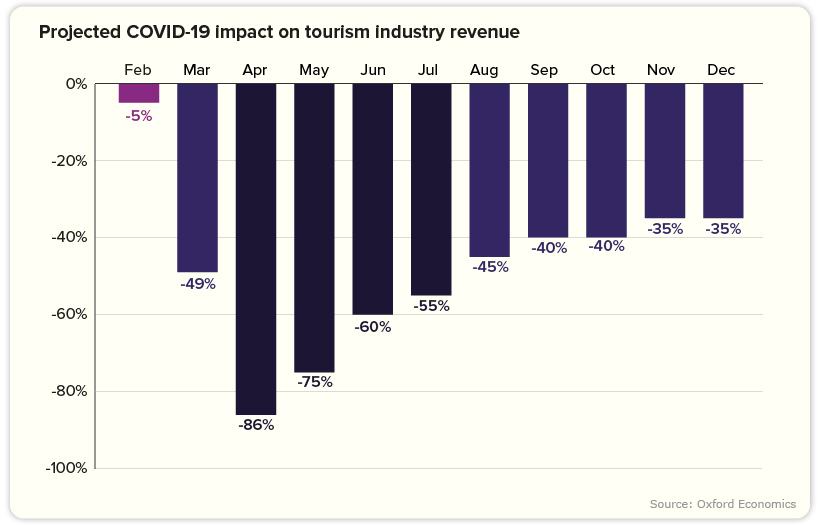
The inevitable decline in the travel and transportation industry is a reflection of mass social isolation levels and tightening travel restrictions.
In fact, the U.S. travel industry can expect to see an average decline in revenue of 81% for April and May. Throughout 2020, losses will equate to roughly $519 billion—translating to a broader $1.2 trillion contraction in total economic impact.
According to the World Travel and Tourism Council, a staggering 50 million jobs are at risk in the industry, with 30 million of those jobs belonging to employees in Asia.
Considering the travel and tourism industry accounts for 10.4% of global GDP, a slow recovery could have serious ramifications.
Apparel
Apparel is experiencing a similarly worrying slowdown, with consumption 40-50% lower in China compared to pre-pandemic levels. Both online and offline sales for businesses the world over are also taking a major hit.
As consumers hold back on their spending, clothing brands of all shapes and sizes are forced to scale back production, and reimagine how they position themselves.
“It’s an unprecedented interruption of an industry that has relied on speeding from one season’s sales to the next. And it is bringing with it a new sense of connectedness, responsibility and empathy.”
—Tamsin Blanchard, The Guardian
Towards an Uncertain Future
Clearly the force majeure that is COVID-19 has not impacted every industry equally.
For some, rebuilding their customer experience by appealing to changing values could result in a profitable, and perhaps much-needed revival. For other companies, there is no other choice but to play the waiting game.
Regardless, every industry faces one universal truth: life after the pandemic will look significantly different.


Markets
The European Stock Market: Attractive Valuations Offer Opportunities
On average, the European stock market has valuations that are nearly 50% lower than U.S. valuations. But how can you access the market?


European Stock Market: Attractive Valuations Offer Opportunities
Europe is known for some established brands, from L’Oréal to Louis Vuitton. However, the European stock market offers additional opportunities that may be lesser known.
The above infographic, sponsored by STOXX, outlines why investors may want to consider European stocks.
Attractive Valuations
Compared to most North American and Asian markets, European stocks offer lower or comparable valuations.
| Index | Price-to-Earnings Ratio | Price-to-Book Ratio |
|---|---|---|
| EURO STOXX 50 | 14.9 | 2.2 |
| STOXX Europe 600 | 14.4 | 2 |
| U.S. | 25.9 | 4.7 |
| Canada | 16.1 | 1.8 |
| Japan | 15.4 | 1.6 |
| Asia Pacific ex. China | 17.1 | 1.8 |
Data as of February 29, 2024. See graphic for full index names. Ratios based on trailing 12 month financials. The price to earnings ratio excludes companies with negative earnings.
On average, European valuations are nearly 50% lower than U.S. valuations, potentially offering an affordable entry point for investors.
Research also shows that lower price ratios have historically led to higher long-term returns.
Market Movements Not Closely Connected
Over the last decade, the European stock market had low-to-moderate correlation with North American and Asian equities.
The below chart shows correlations from February 2014 to February 2024. A value closer to zero indicates low correlation, while a value of one would indicate that two regions are moving in perfect unison.
| EURO STOXX 50 | STOXX EUROPE 600 | U.S. | Canada | Japan | Asia Pacific ex. China |
|
|---|---|---|---|---|---|---|
| EURO STOXX 50 | 1.00 | 0.97 | 0.55 | 0.67 | 0.24 | 0.43 |
| STOXX EUROPE 600 | 1.00 | 0.56 | 0.71 | 0.28 | 0.48 | |
| U.S. | 1.00 | 0.73 | 0.12 | 0.25 | ||
| Canada | 1.00 | 0.22 | 0.40 | |||
| Japan | 1.00 | 0.88 | ||||
| Asia Pacific ex. China | 1.00 |
Data is based on daily USD returns.
European equities had relatively independent market movements from North American and Asian markets. One contributing factor could be the differing sector weights in each market. For instance, technology makes up a quarter of the U.S. market, but health care and industrials dominate the broader European market.
Ultimately, European equities can enhance portfolio diversification and have the potential to mitigate risk for investors.
Tracking the Market
For investors interested in European equities, STOXX offers a variety of flagship indices:
| Index | Description | Market Cap |
|---|---|---|
| STOXX Europe 600 | Pan-regional, broad market | €10.5T |
| STOXX Developed Europe | Pan-regional, broad-market | €9.9T |
| STOXX Europe 600 ESG-X | Pan-regional, broad market, sustainability focus | €9.7T |
| STOXX Europe 50 | Pan-regional, blue-chip | €5.1T |
| EURO STOXX 50 | Eurozone, blue-chip | €3.5T |
Data is as of February 29, 2024. Market cap is free float, which represents the shares that are readily available for public trading on stock exchanges.
The EURO STOXX 50 tracks the Eurozone’s biggest and most traded companies. It also underlies one of the world’s largest ranges of ETFs and mutual funds. As of November 2023, there were €27.3 billion in ETFs and €23.5B in mutual fund assets under management tracking the index.
“For the past 25 years, the EURO STOXX 50 has served as an accurate, reliable and tradable representation of the Eurozone equity market.”
— Axel Lomholt, General Manager at STOXX
Partnering with STOXX to Track the European Stock Market
Are you interested in European equities? STOXX can be a valuable partner:
- Comprehensive, liquid and investable ecosystem
- European heritage, global reach
- Highly sophisticated customization capabilities
- Open architecture approach to using data
- Close partnerships with clients
- Part of ISS STOXX and Deutsche Börse Group
With a full suite of indices, STOXX can help you benchmark against the European stock market.
Learn how STOXX’s European indices offer liquid and effective market access.

-

 Economy3 days ago
Economic Growth Forecasts for G7 and BRICS Countries in 2024
The IMF has released its economic growth forecasts for 2024. How do the G7 and BRICS countries compare?
-

 Markets2 weeks ago
U.S. Debt Interest Payments Reach $1 Trillion
U.S. debt interest payments have surged past the $1 trillion dollar mark, amid high interest rates and an ever-expanding debt burden.
-

 United States2 weeks ago
Ranked: The Largest U.S. Corporations by Number of Employees
We visualized the top U.S. companies by employees, revealing the massive scale of retailers like Walmart, Target, and Home Depot.
-

 Markets2 weeks ago
The Top 10 States by Real GDP Growth in 2023
This graphic shows the states with the highest real GDP growth rate in 2023, largely propelled by the oil and gas boom.
-

 Markets2 weeks ago
Ranked: The World’s Top Flight Routes, by Revenue
In this graphic, we show the highest earning flight routes globally as air travel continued to rebound in 2023.
-

 Markets3 weeks ago
Ranked: The Most Valuable Housing Markets in America
The U.S. residential real estate market is worth a staggering $47.5 trillion. Here are the most valuable housing markets in the country.


-

 Debt1 week ago
How Debt-to-GDP Ratios Have Changed Since 2000
-
Markets2 weeks ago
Ranked: The World’s Top Flight Routes, by Revenue
-

 Countries2 weeks ago
Population Projections: The World’s 6 Largest Countries in 2075
-
Markets2 weeks ago
The Top 10 States by Real GDP Growth in 2023
-

 Demographics2 weeks ago
The Smallest Gender Wage Gaps in OECD Countries
-

 United States2 weeks ago
Where U.S. Inflation Hit the Hardest in March 2024
-

 Green2 weeks ago
Top Countries By Forest Growth Since 2001
-
United States2 weeks ago
Ranked: The Largest U.S. Corporations by Number of Employees