Markets
COVID-19 Crash: How China’s Economy May Offer a Glimpse of the Future
The Economic Impact of COVID-19
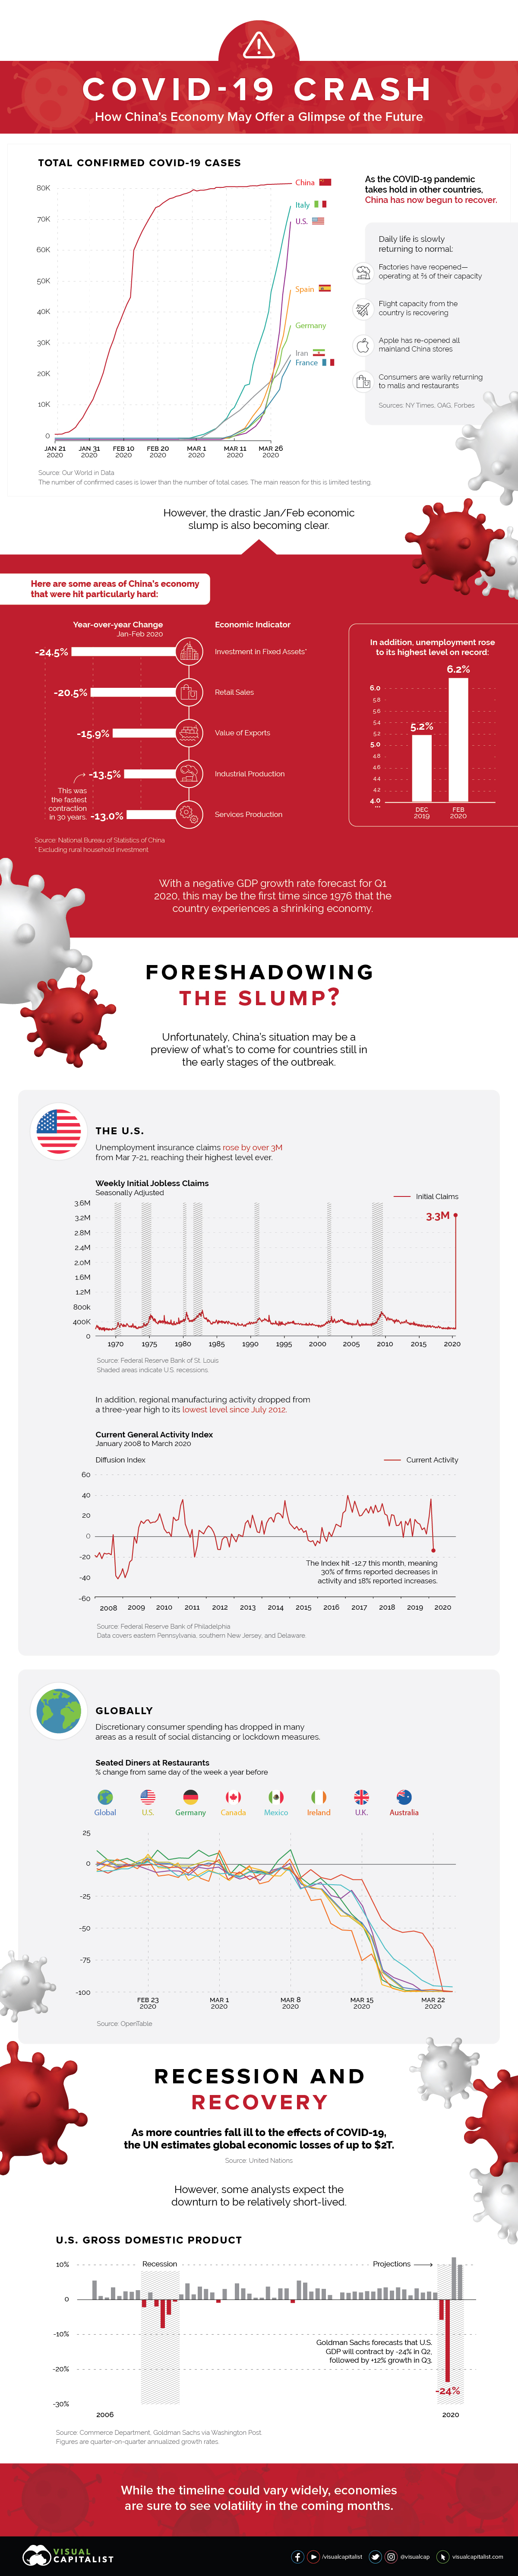
China, once the epicenter of the COVID-19 pandemic, appears to be turning a corner. As the number of reported local transmission cases hovers near zero, daily life is slowly returning to normal. However, economic data from the first two months of the year shows the damage done to the country’s finances.
Today’s visualization outlines the sharp losses China’s economy has experienced, and how this may foreshadow what’s to come for countries currently in the early stages of the outbreak.
A Historic Slump
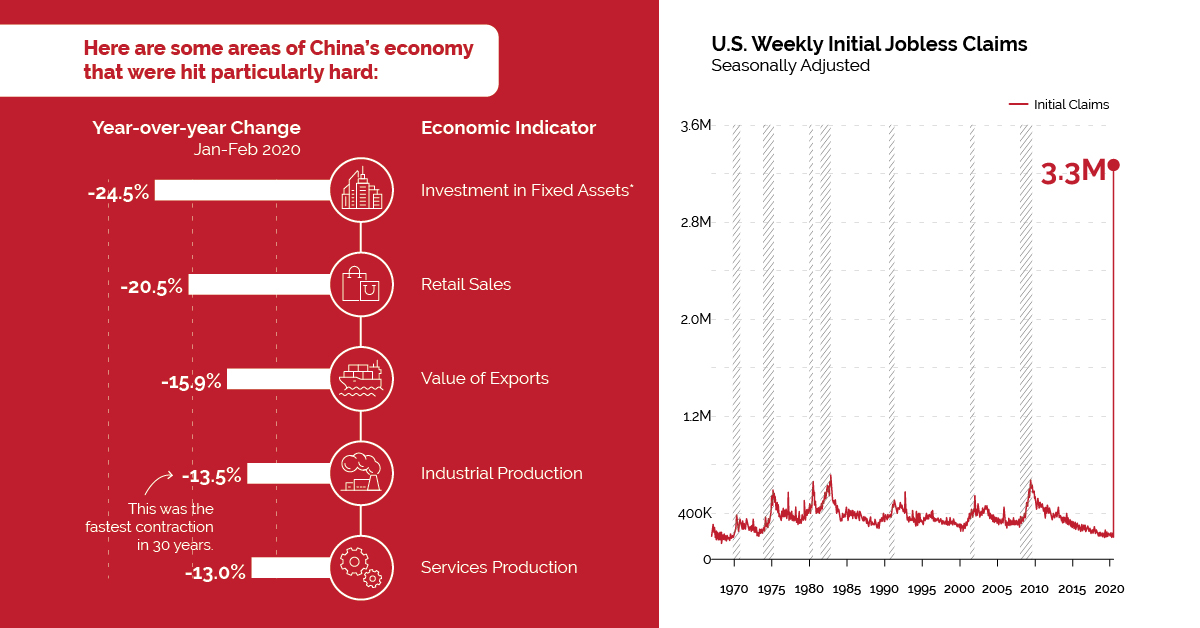
The results are in: China’s business activity slowed considerably as COVID-19 spread.
| Economic Indicator | Year-over-year Change (Jan-Feb 2020) |
|---|---|
| Investment in Fixed Assets* | -24.5% |
| Retail Sales | -20.5% |
| Value of Exports | -15.9% |
| Industrial Production | -13.5% |
| Services Production | -13.0% |
*Excluding rural household investment
As factories and shops reopen, China seems to be over the initial supply side shock caused by the lockdown. However, the country now faces a double-headed demand shock:
- Domestic demand is slow to gain traction due to psychological scars, bankruptcies, and job losses. In a survey conducted by a Beijing financial firm, almost 65% of respondents plan to “restrain” their spending habits after the virus.
- Overseas demand is suffering as more countries face outbreaks. Many stores are closing up shop and/or cancelling orders, leading to an oversupply of goods.
With a fast recovery seeming highly unlikely, many economists expect China’s GDP to shrink in the first quarter of 2020—the country’s first decline since 1976.
Danger on the Horizon
Are other countries destined to follow the same path? Based on preliminary economic data, it would appear so.
The U.S.
About half the U.S. population is on stay-at-home orders, severely restricting economic activity and forcing widespread layoffs. In the week ending March 21, total unemployment insurance claims rose to almost 3.3 million—their highest level in recorded history. For context, weekly claims reached a high of 665,000 during the global financial crisis.
“…The economy has just fallen over the cliff and is turning down into a recession.”
—Chris Rupkey, Chief Economist at MUFG in New York
In addition, manufacturing activity in eastern Pennsylvania, southern New Jersey, and Delaware dropped to its lowest level since July 2012.
Globally
Other countries are also feeling the economic impact of COVID-19. For example, global online bookings for seated diners have declined by 100% year-over-year. In Canada, nearly one million people have applied for unemployment benefits.
Hard-hit countries such as Italy and Spain, which already suffer from high unemployment, are also expecting to see economic blows. However, it’s too soon to gauge the extent of the damage.
Light at the End of the Tunnel
Given the near-shutdown of many economies, the IMF is forecasting a global recession in 2020. Separately, the UN estimates COVID-19 could cause up to a $2 trillion shortfall in global income.
On the bright side, some analysts are forecasting a recovery as early as the third quarter of 2020. A variety of factors, such as government stimulus, consumer confidence, and the number of COVID-19 cases, will play into this timeline.


Markets
The European Stock Market: Attractive Valuations Offer Opportunities
On average, the European stock market has valuations that are nearly 50% lower than U.S. valuations. But how can you access the market?


European Stock Market: Attractive Valuations Offer Opportunities
Europe is known for some established brands, from L’Oréal to Louis Vuitton. However, the European stock market offers additional opportunities that may be lesser known.
The above infographic, sponsored by STOXX, outlines why investors may want to consider European stocks.
Attractive Valuations
Compared to most North American and Asian markets, European stocks offer lower or comparable valuations.
| Index | Price-to-Earnings Ratio | Price-to-Book Ratio |
|---|---|---|
| EURO STOXX 50 | 14.9 | 2.2 |
| STOXX Europe 600 | 14.4 | 2 |
| U.S. | 25.9 | 4.7 |
| Canada | 16.1 | 1.8 |
| Japan | 15.4 | 1.6 |
| Asia Pacific ex. China | 17.1 | 1.8 |
Data as of February 29, 2024. See graphic for full index names. Ratios based on trailing 12 month financials. The price to earnings ratio excludes companies with negative earnings.
On average, European valuations are nearly 50% lower than U.S. valuations, potentially offering an affordable entry point for investors.
Research also shows that lower price ratios have historically led to higher long-term returns.
Market Movements Not Closely Connected
Over the last decade, the European stock market had low-to-moderate correlation with North American and Asian equities.
The below chart shows correlations from February 2014 to February 2024. A value closer to zero indicates low correlation, while a value of one would indicate that two regions are moving in perfect unison.
| EURO STOXX 50 | STOXX EUROPE 600 | U.S. | Canada | Japan | Asia Pacific ex. China |
|
|---|---|---|---|---|---|---|
| EURO STOXX 50 | 1.00 | 0.97 | 0.55 | 0.67 | 0.24 | 0.43 |
| STOXX EUROPE 600 | 1.00 | 0.56 | 0.71 | 0.28 | 0.48 | |
| U.S. | 1.00 | 0.73 | 0.12 | 0.25 | ||
| Canada | 1.00 | 0.22 | 0.40 | |||
| Japan | 1.00 | 0.88 | ||||
| Asia Pacific ex. China | 1.00 |
Data is based on daily USD returns.
European equities had relatively independent market movements from North American and Asian markets. One contributing factor could be the differing sector weights in each market. For instance, technology makes up a quarter of the U.S. market, but health care and industrials dominate the broader European market.
Ultimately, European equities can enhance portfolio diversification and have the potential to mitigate risk for investors.
Tracking the Market
For investors interested in European equities, STOXX offers a variety of flagship indices:
| Index | Description | Market Cap |
|---|---|---|
| STOXX Europe 600 | Pan-regional, broad market | €10.5T |
| STOXX Developed Europe | Pan-regional, broad-market | €9.9T |
| STOXX Europe 600 ESG-X | Pan-regional, broad market, sustainability focus | €9.7T |
| STOXX Europe 50 | Pan-regional, blue-chip | €5.1T |
| EURO STOXX 50 | Eurozone, blue-chip | €3.5T |
Data is as of February 29, 2024. Market cap is free float, which represents the shares that are readily available for public trading on stock exchanges.
The EURO STOXX 50 tracks the Eurozone’s biggest and most traded companies. It also underlies one of the world’s largest ranges of ETFs and mutual funds. As of November 2023, there were €27.3 billion in ETFs and €23.5B in mutual fund assets under management tracking the index.
“For the past 25 years, the EURO STOXX 50 has served as an accurate, reliable and tradable representation of the Eurozone equity market.”
— Axel Lomholt, General Manager at STOXX
Partnering with STOXX to Track the European Stock Market
Are you interested in European equities? STOXX can be a valuable partner:
- Comprehensive, liquid and investable ecosystem
- European heritage, global reach
- Highly sophisticated customization capabilities
- Open architecture approach to using data
- Close partnerships with clients
- Part of ISS STOXX and Deutsche Börse Group
With a full suite of indices, STOXX can help you benchmark against the European stock market.
Learn how STOXX’s European indices offer liquid and effective market access.

-

 Economy2 days ago
Economic Growth Forecasts for G7 and BRICS Countries in 2024
The IMF has released its economic growth forecasts for 2024. How do the G7 and BRICS countries compare?
-

 Markets1 week ago
U.S. Debt Interest Payments Reach $1 Trillion
U.S. debt interest payments have surged past the $1 trillion dollar mark, amid high interest rates and an ever-expanding debt burden.
-

 United States2 weeks ago
Ranked: The Largest U.S. Corporations by Number of Employees
We visualized the top U.S. companies by employees, revealing the massive scale of retailers like Walmart, Target, and Home Depot.
-

 Markets2 weeks ago
The Top 10 States by Real GDP Growth in 2023
This graphic shows the states with the highest real GDP growth rate in 2023, largely propelled by the oil and gas boom.
-

 Markets2 weeks ago
Ranked: The World’s Top Flight Routes, by Revenue
In this graphic, we show the highest earning flight routes globally as air travel continued to rebound in 2023.
-

 Markets3 weeks ago
Ranked: The Most Valuable Housing Markets in America
The U.S. residential real estate market is worth a staggering $47.5 trillion. Here are the most valuable housing markets in the country.


-

 Education1 week ago
How Hard Is It to Get Into an Ivy League School?
-

 Technology2 weeks ago
Ranked: Semiconductor Companies by Industry Revenue Share
-
Markets2 weeks ago
Ranked: The World’s Top Flight Routes, by Revenue
-

 Demographics2 weeks ago
Population Projections: The World’s 6 Largest Countries in 2075
-
Markets2 weeks ago
The Top 10 States by Real GDP Growth in 2023
-

 Demographics2 weeks ago
The Smallest Gender Wage Gaps in OECD Countries
-

 Economy2 weeks ago
Where U.S. Inflation Hit the Hardest in March 2024
-

 Green2 weeks ago
Top Countries By Forest Growth Since 2001