Markets
Everything You Need to Know About Recessions


Everything You Need to Know About Recessions
Just like in life, markets go through peaks and valleys. The good news for investors is that often the peaks ascend to far greater heights than the depths of the valleys.
Today’s post helps to put recessions into perspective. It draws information from Capital Group to break down the frequency of economic expansions and recessions in modern U.S. history, while also showing their typical impact.
What is a Recession?
Not all recessions are the same. Some can last long while others are short. Some create lasting effects, while others are quickly forgotten. Some cripple entire economies, while others are much more targeted, impacting specific sectors within the economy.
Recession is when your neighbor loses their job. Depression is when you lose yours.
– Harry Truman
According to the National Bureau of Economic Research, a recession can be described as a significant decline in economic activity over an extended period of time, typically several months.
In the average recession, gross domestic product (GDP) is not the only thing shrinking—incomes, employment, industrial production, and retail sales tend to shrink as well. Economists generally consider two consecutive quarters of declining GDP as a recession.
The general economic model of a recession is that when unemployment rises, consumers are more likely to save than spend. This places pressure on businesses that rely on consumers’ income. As a result, company earnings and stock prices decline, which can fuel a negative cycle of economic decline and negative expectations of returns.
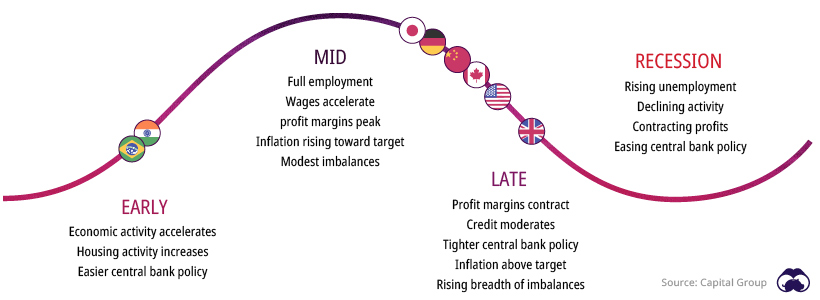
During economic recoveries and expansions, the opposite occurs. Rising employment encourages consumer spending, which bolsters corporate profits and stock market returns.
How Long Do Recessions Last?
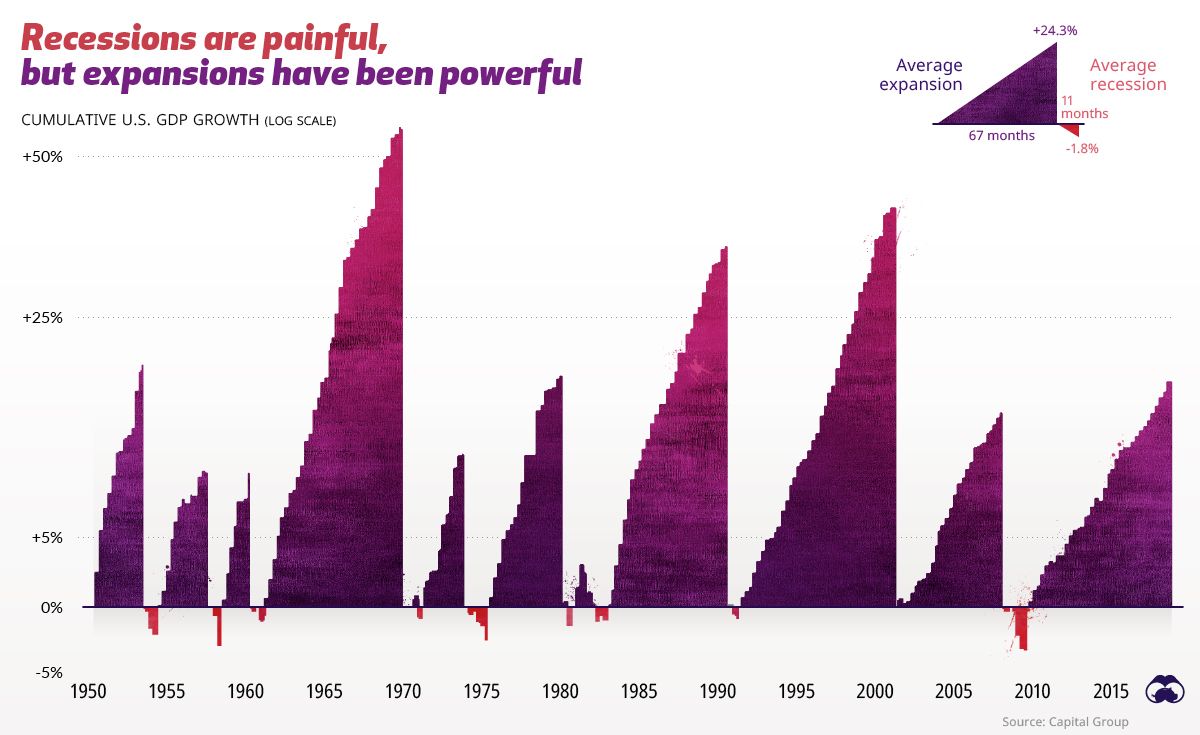
Recessions generally do not last very long. According to Capital Group’s analysis of 10 cycles since 1950, the average length of a recession is 11 months, although they have ranged from eight to 18 months over the period of analysis.
Jobs losses and business closures are dramatic in the short term, though equity investments in the stock market have generally fared better. Throughout the history of economics, recessions have been relatively small blips.
| Average Expansion | Average Recession | |
|---|---|---|
| Months | 67 | 11 |
| GDP Growth | 24.3% | -1.8% |
| S&P 500 Returns | 117% | 3% |
| Net Jobs Added | 12M | -1.9M |
Over the last 65 years, the U.S. has been in an official recession for less than 15% of all months. In addition, the overall economic impact of most recessions is relatively small. The average expansion increased GDP by 24%, whereas the average recession decreased GDP by less than 2%.
In fact, equity returns can be positive throughout a contraction, since some of the strongest stock rallies have occurred in the later stages of a recession.
Buying the Dip: Recession Indicators
Whether you are an investor or not, it would be wise to pay attention to potential recessions and prepare accordingly.
There are several indicators that people can watch to anticipate a potential recession, which might give them an edge in preparing their portfolios:
| Recession Indicator | Why is it Important? | Average Length Until Recession |
|---|---|---|
| Inverted Yield Curve | Often a sign the U.S. Fed has hiked short-term rates too high or investors are seeking long-term bonds over riskier assets. | 15.7 months |
| Corporate Profits | When profits decline, businesses cut investment, employment, and wages. | 26.2 months |
| Unemployment | When unemployment rises, consumers cut back on spending. | 6.1 months |
| Housing Starts | When the economic outlook is poor, home builders often cut back on housing projects. | 5.3 months |
| Leading Economic Index | Aggregation of multiple leading economic indicators. gives a broader look at the U.S. economy. | 4.1 months |
This is not a magic rubric for anticipating every economic downturn, but it helps individuals see the weather patterns on the horizon. Whether and where the storm hits is another question.


Economy
Economic Growth Forecasts for G7 and BRICS Countries in 2024
The IMF has released its economic growth forecasts for 2024. How do the G7 and BRICS countries compare?


G7 & BRICS Real GDP Growth Forecasts for 2024
The International Monetary Fund’s (IMF) has released its real gross domestic product (GDP) growth forecasts for 2024, and while global growth is projected to stay steady at 3.2%, various major nations are seeing declining forecasts.
This chart visualizes the 2024 real GDP growth forecasts using data from the IMF’s 2024 World Economic Outlook for G7 and BRICS member nations along with Saudi Arabia, which is still considering an invitation to join the bloc.
Get the Key Insights of the IMF’s World Economic Outlook
Want a visual breakdown of the insights from the IMF’s 2024 World Economic Outlook report?
This visual is part of a special dispatch of the key takeaways exclusively for VC+ members.
Get the full dispatch of charts by signing up to VC+.
Mixed Economic Growth Prospects for Major Nations in 2024
Economic growth projections by the IMF for major nations are mixed, with the majority of G7 and BRICS countries forecasted to have slower growth in 2024 compared to 2023.
Only three BRICS-invited or member countries, Saudi Arabia, the UAE, and South Africa, have higher projected real GDP growth rates in 2024 than last year.
| Group | Country | Real GDP Growth (2023) | Real GDP Growth (2024P) |
|---|---|---|---|
| G7 | 🇺🇸 U.S. | 2.5% | 2.7% |
| G7 | 🇨🇦 Canada | 1.1% | 1.2% |
| G7 | 🇯🇵 Japan | 1.9% | 0.9% |
| G7 | 🇫🇷 France | 0.9% | 0.7% |
| G7 | 🇮🇹 Italy | 0.9% | 0.7% |
| G7 | 🇬🇧 UK | 0.1% | 0.5% |
| G7 | 🇩🇪 Germany | -0.3% | 0.2% |
| BRICS | 🇮🇳 India | 7.8% | 6.8% |
| BRICS | 🇨🇳 China | 5.2% | 4.6% |
| BRICS | 🇦🇪 UAE | 3.4% | 3.5% |
| BRICS | 🇮🇷 Iran | 4.7% | 3.3% |
| BRICS | 🇷🇺 Russia | 3.6% | 3.2% |
| BRICS | 🇪🇬 Egypt | 3.8% | 3.0% |
| BRICS-invited | 🇸🇦 Saudi Arabia | -0.8% | 2.6% |
| BRICS | 🇧🇷 Brazil | 2.9% | 2.2% |
| BRICS | 🇿🇦 South Africa | 0.6% | 0.9% |
| BRICS | 🇪🇹 Ethiopia | 7.2% | 6.2% |
| 🌍 World | 3.2% | 3.2% |
China and India are forecasted to maintain relatively high growth rates in 2024 at 4.6% and 6.8% respectively, but compared to the previous year, China is growing 0.6 percentage points slower while India is an entire percentage point slower.
On the other hand, four G7 nations are set to grow faster than last year, which includes Germany making its comeback from its negative real GDP growth of -0.3% in 2023.
Faster Growth for BRICS than G7 Nations
Despite mostly lower growth forecasts in 2024 compared to 2023, BRICS nations still have a significantly higher average growth forecast at 3.6% compared to the G7 average of 1%.
While the G7 countries’ combined GDP is around $15 trillion greater than the BRICS nations, with continued higher growth rates and the potential to add more members, BRICS looks likely to overtake the G7 in economic size within two decades.
BRICS Expansion Stutters Before October 2024 Summit
BRICS’ recent expansion has stuttered slightly, as Argentina’s newly-elected president Javier Milei declined its invitation and Saudi Arabia clarified that the country is still considering its invitation and has not joined BRICS yet.
Even with these initial growing pains, South Africa’s Foreign Minister Naledi Pandor told reporters in February that 34 different countries have submitted applications to join the growing BRICS bloc.
Any changes to the group are likely to be announced leading up to or at the 2024 BRICS summit which takes place October 22-24 in Kazan, Russia.
Get the Full Analysis of the IMF’s Outlook on VC+
This visual is part of an exclusive special dispatch for VC+ members which breaks down the key takeaways from the IMF’s 2024 World Economic Outlook.
For the full set of charts and analysis, sign up for VC+.

-

 Markets1 week ago
U.S. Debt Interest Payments Reach $1 Trillion
-

 Markets2 weeks ago
Ranked: The Most Valuable Housing Markets in America
-

 Money2 weeks ago
Which States Have the Highest Minimum Wage in America?
-

 AI2 weeks ago
Ranked: Semiconductor Companies by Industry Revenue Share
-

 Markets2 weeks ago
Ranked: The World’s Top Flight Routes, by Revenue
-

 Countries2 weeks ago
Population Projections: The World’s 6 Largest Countries in 2075
-

 Markets2 weeks ago
The Top 10 States by Real GDP Growth in 2023
-

 Money2 weeks ago
The Smallest Gender Wage Gaps in OECD Countries