History
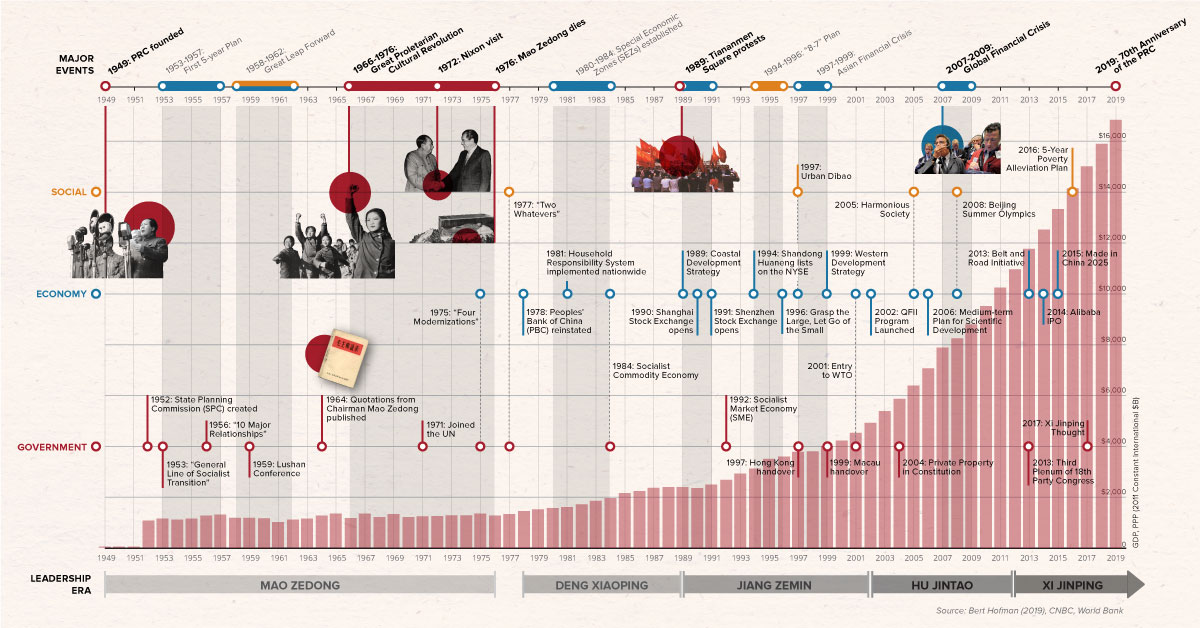
The People’s Republic of China: 70 Years of Economic History
View a high-resolution version of this graphic here.
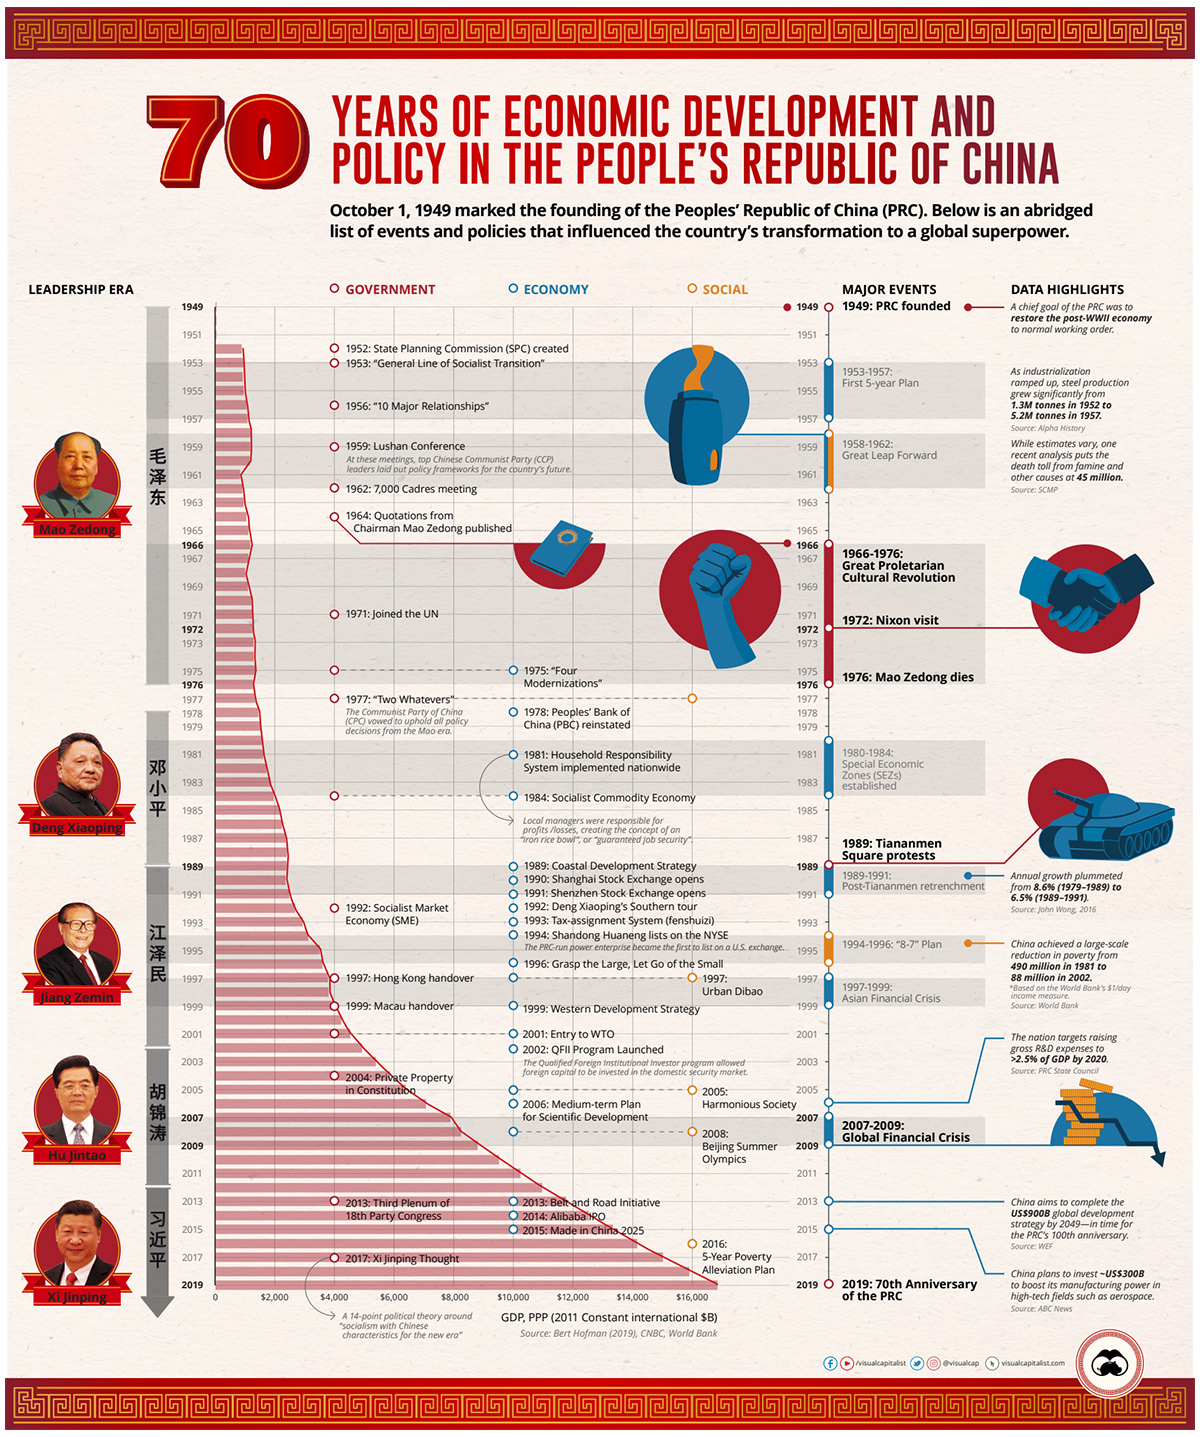
Chart: 70 Years of China’s Economic Growth
View a high-resolution version of this graphic here.
From agrarian economy to global superpower in half a century—China’s transformation has been an economic success story unlike any other.
Today, China is the world’s second largest economy, making up 16% of $86 trillion global GDP in nominal terms. If you adjust numbers for purchasing power parity (PPP), the Chinese economy has already been the world’s largest since 2014.
The upward trajectory over the last 70 years has been filled with watershed moments, strategic directives, and shocking tragedies — and all of this can be traced back to the founding of the People’s Republic of China (PRC) on October 1st, 1949.
How the PRC Came to Be
The Chinese Civil War (1927–1949) between the Republic of China (ROC) and the Communist Party of China (CPC) caused a fractal split in the nation’s leadership. The CPC emerged victorious, and mainland China was established as the PRC.
Communist leader Mao Zedong set out a few chief goals for the PRC: to overhaul land ownership, to reduce social inequality, and to restore the economy after decades of war. The first State Planning Commission and China’s first 5-year plan were introduced to achieve these goals.
Today’s timely chart looks back on seven decades of notable events and policies that helped shape the country China has become. The base data draws from a graphic by Bert Hofman, the World Bank’s Country Director for China and other Asia-Pacific regions.
The Mao Era: 1949–1977
Mao Zedong’s tenure as Chairman of the PRC triggered sweeping changes for the country.
1953–1957: First 5-Year Plan
The program’s aim was to boost China’s industrialization. Steel production grew four-fold in four years, from 1.3 million tonnes to 5.2 million tonnes. Agricultural output also rose, but it couldn’t keep pace with industrial production.
1958–1962: Great Leap Forward
The campaign emphasized China’s agrarian-to-industrial transformation, via a communal farming system. However, the plan failed—causing an economic breakdown and the deaths of tens of millions in the Great Chinese Famine.
1959–1962: Lushan Conference and 7,000 Cadres meeting
Top leaders in the Chinese Communist Party (CCP) met to create detailed policy frameworks for the PRC’s future.
1966–1976: Great Proletarian Cultural Revolution
Mao Zedong attempted to regain power and support after the failures of the Great Leap Forward. However, this was another plan that backfired, causing millions more deaths by violence and again crippling the Chinese economy.
1971: Joined the United Nations
The PRC replaced the ROC (Taiwan) as a permanent member of the United Nations. This addition also made it one of only five members of the UN Security Council—including the UK, the U.S., France, and Russia.
1972: President Nixon’s visit
After 25 years of radio silence, Richard Nixon was the first sitting U.S. President to step foot into the PRC. This helped re-establish diplomatic relations between the two nations.
1976–1977: Mao Zedong Death, and “Two Whatevers”
After Mao Zedong’s passing, the interim government promised to “resolutely uphold whatever policy decisions Chairman Mao made, and unswervingly follow whatever instructions Chairman Mao gave.”
1979: “One-Child Policy”
The government enacted an aggressive birth-planning program to control the size of the country’s population, which it viewed as growing too fast.
A Wave of Socio-Economic Reforms: 1980-1999
From 1980 onward, China worked on opening up its markets to the outside world, and closing the inequality gap.
1980–1984: Special Economic Zones (SEZs) established
Several cities were designated SEZs, and provided with measures such as tax incentives to attract foreign investment. Today, the economies of cities like Shenzhen have grown to rival the GDPs of entire countries.
1981: National Household Responsibility System implemented
In the Mao era, quotas were set on how many goods farmers could produce, shifting the responsibility of profits to local managers instead. This rapidly increased the standard of living, and the quota system spread from agriculture into other sectors.
1989: Coastal Development Strategy
Post-Mao leadership saw the coastal region as the potential “catalyst” for the entire country’s modernization.
1989–1991: Post-Tiananmen retrenchment
Early 1980s economic reforms had mixed results, and the growing anxiety eventually culminated in a series of protests. After tanks rolled into Tiananmen Square in 1989, the government “retrenched” itself by initially attempting to roll back economic reforms and liberalization. The country’s annual growth plunged from 8.6% between 1979-1989 to 6.5% between 1989-1991.
1990–1991: Shanghai and Shenzhen stock exchanges open
Combined, the Shanghai (SSE) and Shenzhen (SZSE) stock exchanges are worth over $8.5 trillion in total market capitalization today.
1994: Shandong Huaneng lists on the NYSE
The power company was the first PRC enterprise to list on the NYSE. This added a new N-shares group to the existing Chinese capital market options of A-shares, B-shares, and H-shares.
1994–1996: National “8-7” Poverty Reduction Plan
China successfully lifted over 400 million poor people out of poverty between 1981 and 2002 through this endeavor.
1996: “Grasp the Large, Let Go of the Small”
Efforts were made to downsize the state sector. Policy makers were urged to maintain control over state-owned enterprises to “grasp the large”. Meanwhile, the central government was encouraged to relinquish control over smaller SOEs, or “let go of the small”.
1997: Urban Dibao (低保)
China’s social safety net went through restructuring from 1993, and became a nationwide program after strong success in Shanghai.
1997-1999: Hong Kong and Macao handover, Asian Financial Crisis
China was largely unscathed by the regional financial crisis, thanks to the RMB (¥) currency’s non-convertibility. Meanwhile, the PRC regained sovereignty of Hong Kong and Macau back from the UK and Portugal, respectively.
1999: Western Development Strategy
The “Open Up the West” program built out 6 provinces, 5 autonomous regions, and 1 municipality—each becoming integral to the Chinese economy.
Turn of the Century: 2000-present
China’s entry to the World Trade Organization, and the Qualified Foreign Institutional Investor (QFII) program – which let foreign investors participate in the PRC’s stock exchanges – contributed to the country’s economic growth.
Source: CNBC
2006: Medium-term Plan for Scientific Development
The PRC State Council’s 15-year plan outlines that 2.5% or more of national GDP should be devoted to research and development by 2020.
2008-2009: Global Financial Crisis
The PRC experienced only a mild economic slowdown during the crisis. The country’s GDP growth in 2007 was a staggering 14.2%, but this dropped to 9.7% and 9.5% respectively in the two years following.
2013: Belt and Road Initiative
China’s ambitious plans to develop road, rail, and sea routes across 152 countries is scheduled for completion by 2049—in time for the PRC’s 100th anniversary. More than $900 billion is budgeted for these infrastructure projects.
2015: Made in China 2025
The PRC refuses to be the world’s “factory” any longer. In response, it will invest nearly $300 billion to boost its manufacturing capabilities in high-tech fields like pharmaceuticals, aerospace, and robotics.
Despite the recent ongoing trade dispute with the U.S. and an increasingly aging population, the Chinese growth story seems destined to continue on.
China Paving the Way?
The 70th anniversary of the PRC offers a moment to reflect on the country’s journey from humble beginnings to a powerhouse on the world stage.
Because of China’s economic success, more and more countries see China as an example to emulate, a model of development that could mean moving from rags to riches within a generation.


population
Vintage Viz: World Cities With 1 Million Residents (1800–1930)
From someone born in the 19th century, in the midst of historic population growth, comes this vintage visualization showing world cities growing ever bigger.
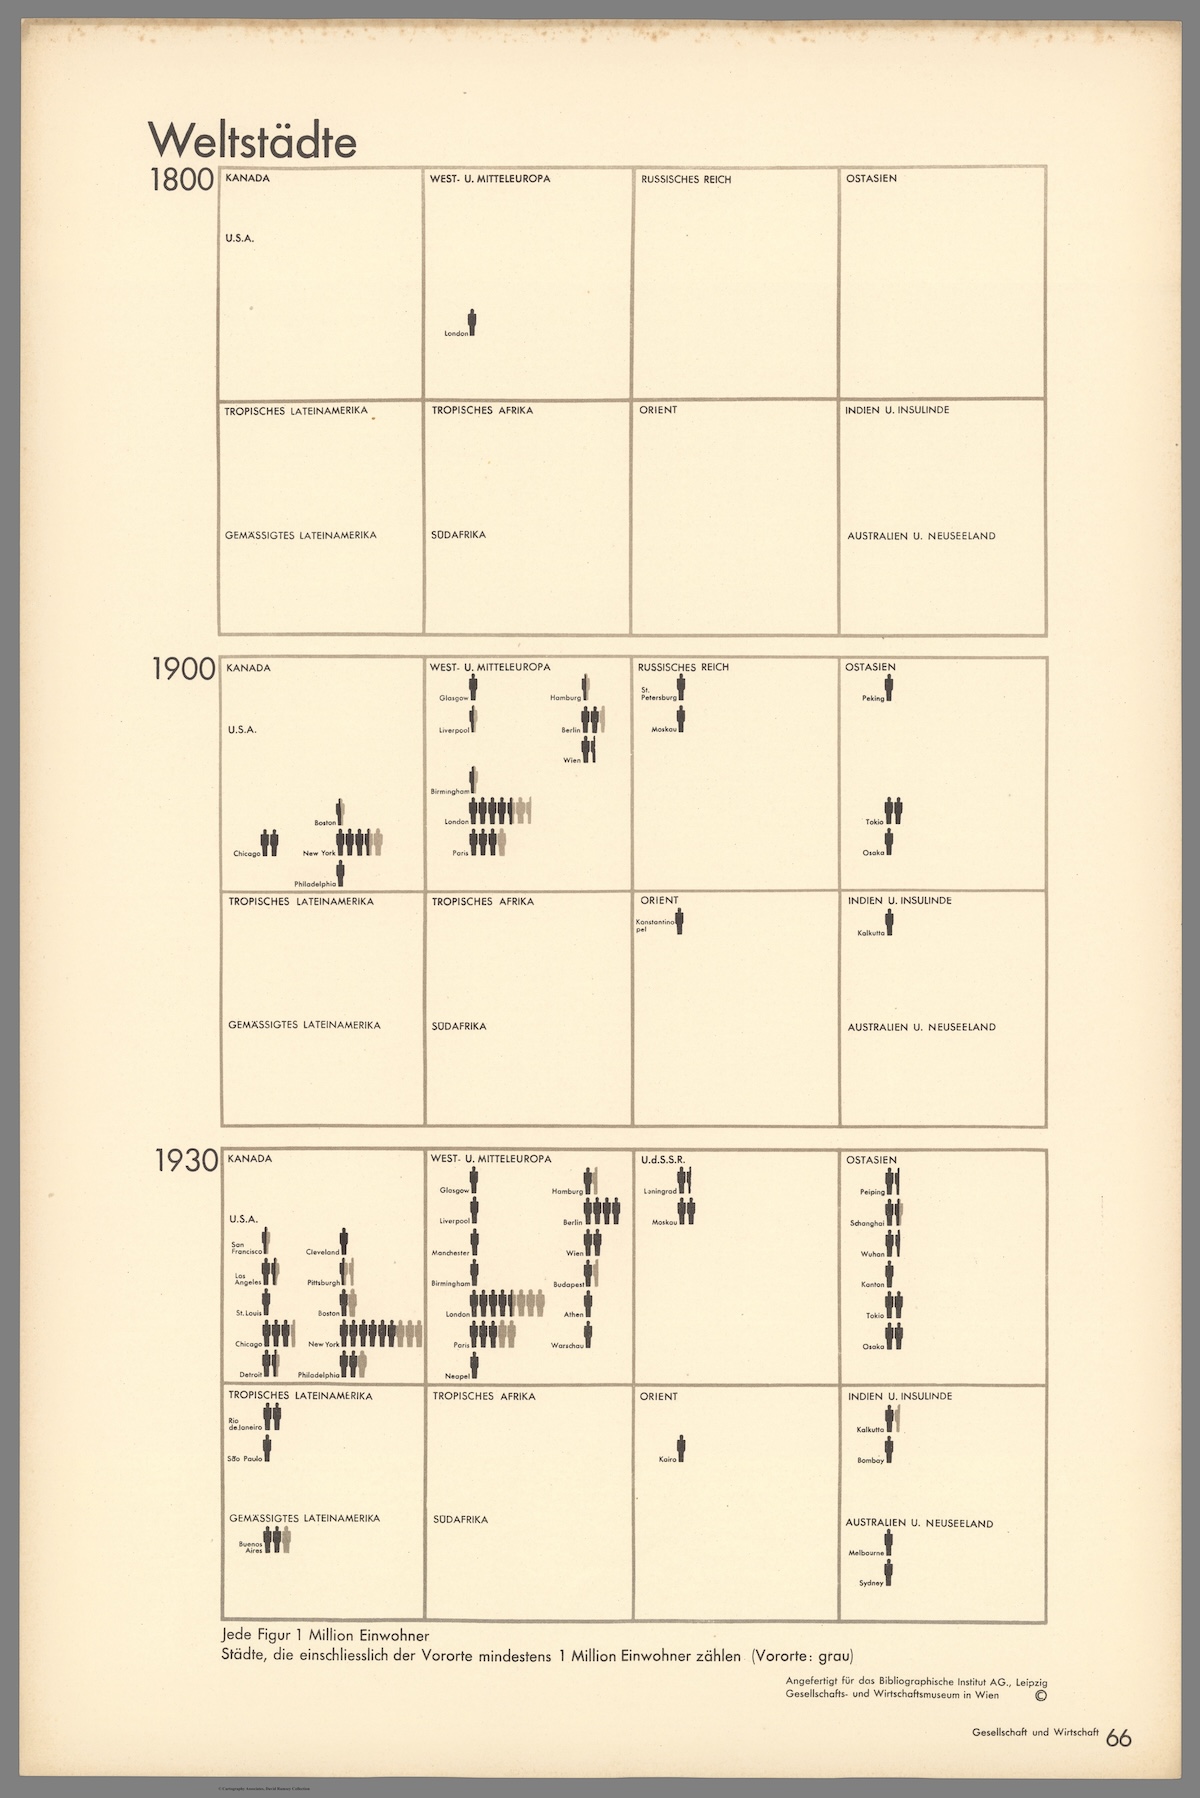
World Cities With At Least 1 Million Residents (1800–1930)
This chart is the latest in our Vintage Viz series, which presents historical visualizations along with the context needed to understand them.
The explosive world population boom in the last 300 years is common knowledge today. Much and more has been written about how and why it happened, why it was unusual, and how the specter of a declining population for the first time in three centuries could impact human society.
However, equally compelling, is how people in the past—those living in the midst of the early waves of this boom—were fascinated by what they were witnessing.
Evidence of this comes from today’s vintage visualization, denoting the increasing number of world cities with at least one million inhabitants through the years.
The above pictogram was made by Austrian philosopher and sociologist Otto Neurath (1882–1945), found in his book, Society and Economy, published in 1930.
World Population Doubles Between 1800 and 1930
In 1800, the world population crossed 1 billion for the first time ever.
In the next 130 years, it doubled past 2 billion.
The Second Agricultural Revolution, characterized by massive land and labor productivity, grew agricultural output more than the population and is one of the key drivers of this population growth.
And in the pictogram above, where one silhouette indicates one million inhabitants, this exponential population growth becomes far more vivid.
In 1800, for example, according to the creator’s estimates, only London had at least million residents. A century later, 15 cities now boasted of the same number. Then, three decades hence, 37 cities across the world had one million inhabitants.
| Year | Cities with One Million Residents |
|---|---|
| 1800 | 1 |
| 1900 | 15 |
| 1930 | 37 |
Importantly, the data above is based on the creator’s estimates from a century ago, and does not include Beijing (then referred to as Peking in English) in 1800. Historians now agree that the city had more than a million residents, and was the largest city in the world at the time.
Another phenomenon becoming increasingly apparent is growing urbanization—food surplus frees up large sections of the population from agriculture, driving specialization in other skills and trade, in turn leading to congregations in urban centers.
Other visualizations in the same book covered migration, Indigenous peoples, labor, religion, trade, and natural resources, reflecting the creator’s interest in the social life of individuals and their well-being.
Who Was Otto Neurath and What is His Legacy?
This vintage visualization might seem incredibly simple, simplistic even, considering how we map out population data today. But the creator Otto Neurath, and his wife Marie, were pioneers in the field of visual communication.
One of their notable achievements was the creation of the Vienna Method of pictorial statistics, which aimed to represent statistical information in a visually accessible way—the forerunner to modern-day infographics.
The Neuraths believed in using clear and simple visual language to convey complex information to a broad audience, an approach that laid the foundation for modern information design.
They fled Austria during the rise of the Nazi regime and spent their later years in various countries, including the UK. Otto Neurath’s influence on graphic design, visual communication, and the philosophy of language has endured, and his legacy is still recognized in these fields today.

-

 Education1 week ago
How Hard Is It to Get Into an Ivy League School?
-

 Technology2 weeks ago
Ranked: Semiconductor Companies by Industry Revenue Share
-

 Markets2 weeks ago
Ranked: The World’s Top Flight Routes, by Revenue
-

 Demographics2 weeks ago
Population Projections: The World’s 6 Largest Countries in 2075
-

 Markets2 weeks ago
The Top 10 States by Real GDP Growth in 2023
-

 Demographics2 weeks ago
The Smallest Gender Wage Gaps in OECD Countries
-

 Economy2 weeks ago
Where U.S. Inflation Hit the Hardest in March 2024
-

 Green2 weeks ago
Top Countries By Forest Growth Since 2001