Maps
Interactive Map: The World as 1,000 People
Hover or click on countries to see how many people each would have. If you’re having troubled loading the map, click here to see a static version.
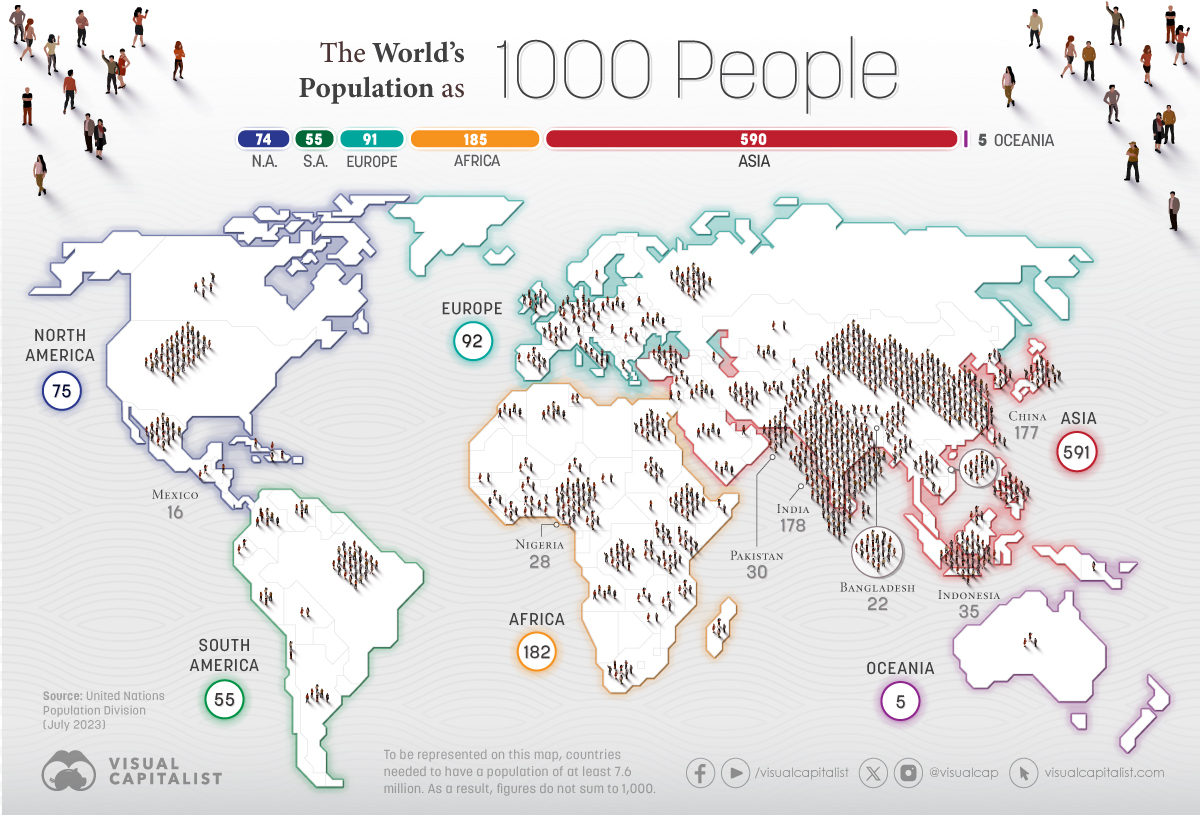
All The People in the World as 1,000 People
The world’s population has doubled in size over the last 50 years.
In 2022, we reached the mark of 8 billion living on Earth. According to UN estimates, by July 2023, all the people in the world numbered 8,045,311,447.
In this interactive map, we use population estimates from the United Nations Population Division to illustrate the world’s population as if the Earth had only 1,000 people. Countries with a population of below 7.6 million did not make our cutoff to be visualized, but are included in overall calculations and listed below.
Over Half of People Live in Asia
Asia is by far the world’s most populous region, with over 4.7 billion people. The continent, led by India and China, represents 59% of the total population.
Imagining the Earth with only 1,000 people helps illustrate this more easily. India would account for 178 people and China would have 177.
Here is the estimated population in July 2023 for each country, and how many people their residents would constitute out of 1,000:
| Country | Total Population (July 2023) | Share of 1,000 Global People |
|---|---|---|
| 🇮🇳 India | 1,428,627,663 | 178 |
| 🇨🇳 China | 1,425,671,352 | 177 |
| 🇺🇸 United States | 339,996,563 | 42 |
| 🇮🇩 Indonesia | 277,534,122 | 35 |
| 🇵🇰 Pakistan | 240,485,658 | 30 |
| 🇳🇬 Nigeria | 223,804,632 | 28 |
| 🇧🇷 Brazil | 216,422,446 | 27 |
| 🇧🇩 Bangladesh | 172,954,319 | 22 |
| 🇷🇺 Russia | 144,444,359 | 18 |
| 🇲🇽 Mexico | 128,455,567 | 16 |
| 🇪🇹 Ethiopia | 126,527,060 | 16 |
| 🇯🇵 Japan | 123,294,513 | 15 |
| 🇵🇭 Philippines | 117,337,368 | 15 |
| 🇪🇬 Egypt | 112,716,598 | 14 |
| 🇨🇩 DRC | 102,262,808 | 13 |
| 🇻🇳 Vietnam | 98,858,950 | 12 |
| 🇮🇷 Iran | 89,172,767 | 11 |
| 🇹🇷 Türkiye | 85,816,199 | 11 |
| 🇩🇪 Germany | 83,294,633 | 10 |
| 🇹🇭 Thailand | 71,801,279 | 9 |
| 🇬🇧 United Kingdom | 67,736,802 | 8 |
| 🇹🇿 Tanzania | 67,438,106 | 8 |
| 🇫🇷 France | 64,756,584 | 8 |
| 🇿🇦 South Africa | 60,414,495 | 8 |
| 🇮🇹 Italy | 58,870,762 | 7 |
| 🇰🇪 Kenya | 55,100,586 | 7 |
| 🇲🇲 Myanmar | 54,577,997 | 7 |
| 🇨🇴 Colombia | 52,085,168 | 7 |
| 🇰🇷 South Korea | 51,784,059 | 6 |
| 🇺🇬 Uganda | 48,582,334 | 6 |
| 🇸🇩 Sudan | 48,109,006 | 6 |
| 🇪🇸 Spain | 47,519,628 | 6 |
| 🇦🇷 Argentina | 45,773,884 | 6 |
| 🇩🇿 Algeria | 45,606,480 | 6 |
| 🇮🇶 Iraq | 45,504,560 | 6 |
| 🇦🇫 Afghanistan | 42,239,854 | 5 |
| 🇵🇱 Poland | 41,026,067 | 5 |
| 🇨🇦 Canada | 38,781,291 | 5 |
| 🇲🇦 Morocco | 37,840,044 | 5 |
| 🇸🇦 Saudi Arabia | 36,947,025 | 5 |
| 🇺🇦 Ukraine | 36,744,634 | 5 |
| 🇦🇴 Angola | 36,684,202 | 5 |
| 🇺🇿 Uzbekistan | 35,163,944 | 4 |
| 🇾🇪 Yemen | 34,449,825 | 4 |
| 🇵🇪 Peru | 34,352,719 | 4 |
| 🇲🇾 Malaysia | 34,308,525 | 4 |
| 🇬🇭 Ghana | 34,121,985 | 4 |
| 🇲🇿 Mozambique | 33,897,354 | 4 |
| 🇳🇵 Nepal | 30,896,590 | 4 |
| 🇲🇬 Madagascar | 30,325,732 | 4 |
| 🇨🇮 Côte d'Ivoire | 28,873,034 | 4 |
| 🇻🇪 Venezuela | 28,838,499 | 4 |
| 🇨🇲 Cameroon | 28,647,293 | 4 |
| 🇳🇪 Niger | 27,202,843 | 3 |
| 🇦🇺 Australia | 26,439,111 | 3 |
| 🇰🇵 North Korea | 26,160,821 | 3 |
| 🇹🇼 Taiwan | 23,923,276 | 3 |
| 🇲🇱 Mali | 23,293,698 | 3 |
| 🇧🇫 Burkina Faso | 23,251,485 | 3 |
| 🇸🇾 Syria | 23,227,014 | 3 |
| 🇱🇰 Sri Lanka | 21,893,579 | 3 |
| 🇲🇼 Malawi | 20,931,751 | 3 |
| 🇿🇲 Zambia | 20,569,737 | 3 |
| 🇷🇴 Romania | 19,892,812 | 3 |
| 🇨🇱 Chile | 19,629,590 | 2 |
| 🇰🇿 Kazakhstan | 19,606,633 | 2 |
| 🇹🇩 Chad | 18,278,568 | 2 |
| 🇪🇨 Ecuador | 18,190,484 | 2 |
| 🇸🇴 Somalia | 18,143,378 | 2 |
| 🇬🇹 Guatemala | 18,092,026 | 2 |
| 🇸🇳 Senegal | 17,763,163 | 2 |
| 🇳🇱 Netherlands | 17,618,299 | 2 |
| 🇰🇭 Cambodia | 16,944,826 | 2 |
| 🇿🇼 Zimbabwe | 16,665,409 | 2 |
| 🇬🇳 Guinea | 14,190,612 | 2 |
| 🇷🇼 Rwanda | 14,094,683 | 2 |
| 🇧🇯 Benin | 13,712,828 | 2 |
| 🇧🇮 Burundi | 13,238,559 | 2 |
| 🇹🇳 Tunisia | 12,458,223 | 2 |
| 🇧🇴 Bolivia | 12,388,571 | 2 |
| 🇭🇹 Haiti | 11,724,763 | 2 |
| 🇧🇪 Belgium | 11,686,140 | 2 |
| 🇯🇴 Jordan | 11,337,052 | 1 |
| 🇩🇴 Dominican Republic | 11,332,972 | 1 |
| 🇨🇺 Cuba | 11,194,449 | 1 |
| 🇸🇸 South Sudan | 11,088,796 | 1 |
| 🇸🇪 Sweden | 10,612,086 | 1 |
| 🇭🇳 Honduras | 10,593,798 | 1 |
| 🇨🇿 Czech Republic (Czechia) | 10,495,295 | 1 |
| 🇦🇿 Azerbaijan | 10,412,651 | 1 |
| 🇬🇷 Greece | 10,341,277 | 1 |
| 🇵🇬 Papua New Guinea | 10,329,931 | 1 |
| 🇵🇹 Portugal | 10,247,605 | 1 |
| 🇭🇺 Hungary | 10,156,239 | 1 |
| 🇹🇯 Tajikistan | 10,143,543 | 1 |
| 🇦🇪 United Arab Emirates | 9,516,871 | 1 |
| 🇧🇾 Belarus | 9,498,238 | 1 |
| 🇮🇱 Israel | 9,174,520 | 1 |
| 🇹🇬 Togo | 9,053,799 | 1 |
| 🇦🇹 Austria | 8,958,960 | 1 |
| 🇨🇭 Switzerland | 8,796,669 | 1 |
| 🇸🇱 Sierra Leone | 8,791,092 | 1 |
| 🇱🇦 Laos | 7,633,779 | 0.9 |
| 🇭🇰 Hong Kong | 7,491,609 | 0.9 |
| 🇷🇸 Serbia | 7,149,077 | 0.9 |
| 🇳🇮 Nicaragua | 7,046,310 | 0.9 |
| 🇱🇾 Libyg | 6,888,388 | 0.9 |
| 🇵🇾 Paraguay | 6,861,524 | 0.9 |
| 🇰🇬 Kyrgyzstan | 6,735,347 | 0.8 |
| 🇧🇬 ßulgaria | 6,687,717 | 0.8 |
| 🇹🇲 Turkmenistan | 6,516,100 | 0.8 |
| 🇸🇻 EI Salvador | 6,364,943 | 0.8 |
| 🇨🇬 Congo | 6,106,869 | 0.8 |
| 🇸🇬 Singapore | 6,014,723 | 0.7 |
| 🇩🇰 Denmark | 5,910,913 | 0.7 |
| 🇸🇰 Slovakia | 5,795,199 | 0.7 |
| 🇨🇫 Central African Republic | 5,742,315 | 0.7 |
| 🇫🇮 Finland | 5,545,475 | 0.7 |
| 🇳🇴 Norway | 5,474,360 | 0.7 |
| 🇱🇷 Liberia | 5,418,377 | 0.7 |
| 🇵🇸 State of Palestine | 5,371,230 | 0.7 |
| 🇱🇧 Lebanon | 5,353,930 | 0.7 |
| 🇳🇿 New Zealand | 5,228,100 | 0.6 |
| 🇨🇷 Costa Rica | 5,212,173 | 0.6 |
| 🇮🇪 Ireland | 5,056,935 | 0.6 |
| 🇲🇷 Mauritania | 4,862,989 | 0.6 |
| 🇴🇲 Oman | 4,644,384 | 0.6 |
| 🇵🇦 Panama | 4,468,087 | 0.6 |
| 🇰🇼 Kuwait | 4,310,108 | 0.5 |
| 🇭🇷 Croatia | 4,008,617 | 0.5 |
| 🇪🇷 Eritrea | 3,748,901 | 0.5 |
| 🇬🇪 Georgia | 3,728,282 | 0.5 |
| 🇲🇳 Mongolia | 3,447,157 | 0.4 |
| 🇲🇩 Moldova | 3,435,931 | 0.4 |
| 🇺🇾 Uruguay | 3,423,108 | 0.4 |
| 🇵🇷 Puerto Rico | 3,260,314 | 0.4 |
| 🇧🇦 Bosnia and Herzegovina | 3,210,847 | 0.4 |
| 🇦🇱 Albania | 2,832,439 | 0.4 |
| 🇯🇲 Jamaica | 2,825,544 | 0.4 |
| 🇦🇲 Armenia | 2,777,970 | 0.3 |
| 🇬🇲 Gambia | 2,773,168 | 0.3 |
| 🇱🇹 Lithuania | 2,718,352 | 0.3 |
| 🇶🇦 Qatar | 2,716,391 | 0.3 |
| 🇧🇼 Botswana | 2,675,352 | 0.3 |
| 🇳🇦 Namibia | 2,604,172 | 0.3 |
| 🇬🇦 Gabon | 2,436,566 | 0.3 |
| 🇱🇸 Lesotho | 2,330,318 | 0.3 |
| 🇬🇼 Guinea-Bissau | 2,150,842 | 0.3 |
| 🇸🇮 Slovenia | 2,119,675 | 0.3 |
| 🇲🇰 North Macedonia | 2,085,679 | 0.3 |
| 🇱🇻 Latvia | 1,830,211 | 0.2 |
| 🇬🇶 Equatorial Guinea | 1,714,671 | 0.2 |
| 🇽🇰 Kosovo | 1,663,594 | 0.2 |
| 🇹🇹 Trinidad and Tobago | 1,534,937 | 0.2 |
| 🇧🇭 Bahrain | 1,485,509 | 0.2 |
| 🇹🇱 Timor-Leste | 1,360,596 | 0.2 |
| 🇪🇪 Estonia | 1,322,765 | 0.2 |
| 🇲🇺 Mauritius | 1,300,557 | 0.2 |
| 🇨🇾 Cyprus | 1,260,138 | 0.2 |
| 🇸🇿 Eswatini | 1,210,822 | 0.2 |
| 🇩🇯 Djibouti | 1,136,455 | 0.1 |
| 🇷🇪 Réunion | 981,796 | 0.1 |
| 🇫🇯 Fiji | 936,375 | 0.1 |
| 🇰🇲 Comoros | 852,075 | 0.1 |
| 🇬🇾 Guyana | 813,834 | 0.1 |
| 🇧🇹 Bhutan | 787,424 | 0.1 |
| 🇸🇧 Solomon Islands | 740,424 | 0.1 |
| 🇲🇴 Macao | 704,149 | 0.1 |
| 🇱🇺 Luxembourg | 654,768 | 0.1 |
| 🇲🇪 Montenegro | 626,485 | 0.1 |
| 🇸🇷 Suriname | 623,236 | 0.1 |
| 🇨🇻 Cabo Verde | 598,682 | 0.1 |
| 🇪🇭 Western Sahara | 587,259 | 0.1 |
| 🇲🇹 Malta | 535,064 | 0.1 |
| 🇲🇻 Maldives | 521,021 | 0.1 |
| 🇧🇳 Brunei | 452,524 | 0.1 |
| 🇧🇸 Bahamas | 412,623 | 0.1 |
| 🇧🇿 Belize | 410,825 | 0.1 |
| 🇬🇵 Guadeloupe | 395,839 | 0.0 |
| 🇮🇸 Iceland | 375,318 | 0.0 |
| 🇲🇶 Martinique | 366,981 | 0.0 |
| 🇾🇹 Mayotte | 335,995 | 0.0 |
| 🇻🇺 Vanuatu | 334,506 | 0.0 |
| 🇬🇫 French Guiana | 312,155 | 0.0 |
| 🇵🇫 French Polynesia | 308,872 | 0.0 |
| 🇳🇨 New Caledonia | 292,991 | 0.0 |
| 🇧🇧 Barbados | 281,995 | 0.0 |
| 🇸🇹 Sao Tome & Principe | 231,856 | 0.0 |
| 🇼🇸 Samoa | 225,681 | 0.0 |
| 🇨🇼 Curaçao | 192,077 | 0.0 |
| 🇱🇨 Saint Lucia | 180,251 | 0.0 |
| 🇬🇺 Guam | 172,952 | 0.0 |
| 🇰🇮 Kiribati | 133,515 | 0.0 |
| 🇬🇩 Grenada | 126,183 | 0.0 |
| 🇫🇲 Micronesia (Fed. States of) | 115,224 | 0.0 |
| 🇯🇪 Jersey | 111,802 | 0.0 |
| 🇹🇴 Tonga | 107,773 | 0.0 |
| 🇸🇨 Seychelles | 107,660 | 0.0 |
| 🇦🇼 Aruba | 106,277 | 0.0 |
| 🇻🇨 St. Vincent & Grenadines | 103,698 | 0.0 |
| 🇻🇮 U.S. Virgin Islands | 98,750 | 0.0 |
| 🇦🇬 Antigua and Barbuda | 94,298 | 0.0 |
| 🇮🇲 Isle of Man | 84,710 | 0.0 |
| 🇦🇩 Andorra | 80,088 | 0.0 |
| 🇩🇲 Dominica | 73,040 | 0.0 |
| 🇰🇾 Cayman Islands | 69,310 | 0.0 |
| 🇧🇲 Bermuda | 64,069 | 0.0 |
| 🇬🇬 Guernsey | 63,544 | 0.0 |
| 🇬🇱 Greenland | 56,643 | 0.0 |
| 🇫🇴 Faeroe Islands | 53,270 | 0.0 |
| 🇲🇵 Northern Mariana Islands | 49,796 | 0.0 |
| 🇰🇳 Saint Kitts & Nevis | 47,755 | 0.0 |
| 🇹🇨 Turks and Caicos | 46,062 | 0.0 |
| 🇸🇽 Sint Maarten | 44,222 | 0.0 |
| 🇦🇸 American Samoa | 43,914 | 0.0 |
| 🇲🇭 Marshall Islands | 41,996 | 0.0 |
| 🇱🇮 Liechtenstein | indo | 0.0 |
| 🇲🇨 Monaco | 36,297 | 0.0 |
| 🇸🇲 San Marino | 33,642 | 0.0 |
| 🇬🇮 Gibraltar | 32,688 | 0.0 |
| 🇲🇫 Saint Martin | 32,077 | 0.0 |
| 🇻🇬 British Virgin Islands | 31,538 | 0.0 |
| 🇧🇶 Caribbean Netherlands | 27,148 | 0.0 |
| 🇵🇼 Palau | 18,058 | 0.0 |
| 🇨🇰 Cook Islands | 17,044 | 0.0 |
| 🇦🇮 Anguilla | 15,899 | 0.0 |
| 🇳🇷 Nauru | 12,780 | 0.0 |
| 🇼🇫 Wallis & Futuna | 11,502 | 0.0 |
| 🇹🇻 Tuvalu | 11,396 | 0.0 |
| 🇧🇱 Saint Barthelemy | 10,994 | 0.0 |
| 🇵🇲 Saint Pierre & Miquelon | 5,840 | 0.0 |
| 🇸🇭 Saint Helena | 5,314 | 0.0 |
| 🇲🇸 Montserrat | 4,386 | 0.0 |
| 🇫🇰 Falkland Islands | 3,791 | 0.0 |
| 🇳🇺 Niue | 1,935 | 0.0 |
| 🇹🇰 Tokelau | 1,893 | 0.0 |
| 🇻🇦 Holy See | 518 | 0.0 |
Africa is the second most populated continent with 182 out of 1,000 people, led by Nigeria (28), Ethiopia (16) and Egypt (14). As of July 2023, Africa’s total population stood at an estimated 1.5 billion people.
Despite seeing a decline in population over the last decades, Europe still is the third in terms of total population, making up 92 out of 1,000 people and led by Russia (18), Turkey (11), and Germany (10).
If the world only had 1,000 people, North America would have only 75 inhabitants, with 42 in the United States. Meanwhile, South America would account for 55 people led by 27 from Brazil, and Oceania would have just 5 people (with 3 in Australia).
Nigeria to Pass U.S. as World’s 3rd Most Populous Country
While population projections to the end of the century do differ, they mostly agree on the same general principle: the global population is rising but that growth rate is slowing. Eventually the population will peak (sometime between 2064-2086) and begin shrinking from there.
Over the next few decades, the ranking of the most populous countries will likely remain relatively unchanged, with India and China at the top of the pecking order. Shortly after 2050, however, the population of Nigeria is projected by some sources to surpass that of the United States and become the third-largest country in the world.
Other countries expected to see significant growth in population are the Democratic Republic of the Congo, Pakistan, Ethiopia, Tanzania, the U.S., Uganda, and Indonesia.


Maps
The Largest Earthquakes in the New York Area (1970-2024)
The earthquake that shook buildings across New York in April 2024 was the third-largest quake in the Northeast U.S. over the past 50 years.


The Largest Earthquakes in the New York Area
This was originally posted on our Voronoi app. Download the app for free on Apple or Android and discover incredible data-driven charts from a variety of trusted sources.
The 4.8 magnitude earthquake that shook buildings across New York on Friday, April 5th, 2024 was the third-largest quake in the U.S. Northeast area over the past 50 years.
In this map, we illustrate earthquakes with a magnitude of 4.0 or greater recorded in the Northeastern U.S. since 1970, according to the United States Geological Survey (USGS).
Shallow Quakes and Older Buildings
The earthquake that struck the U.S. Northeast in April 2024 was felt by millions of people from Washington, D.C., to north of Boston. It even caused a full ground stop at Newark Airport.
The quake, occurring just 5 km beneath the Earth’s surface, was considered shallow, which is what contributed to more intense shaking at the surface.
According to the USGS, rocks in the eastern U.S. are significantly older, denser, and harder than those on the western side, compressed by time. This makes them more efficient conduits for seismic energy. Additionally, buildings in the Northeast tend to be older and may not adhere to the latest earthquake codes.
Despite disrupting work and school life, the earthquake was considered minor, according to the Michigan Technological University magnitude scale:
| Magnitude | Earthquake Effects | Estimated Number Each Year |
|---|---|---|
| 2.5 or less | Usually not felt, but can be recorded by seismograph. | Millions |
| 2.5 to 5.4 | Often felt, but only causes minor damage. | 500,000 |
| 5.5 to 6.0 | Slight damage to buildings and other structures. | 350 |
| 6.1 to 6.9 | May cause a lot of damage in very populated areas. | 100 |
| 7.0 to 7.9 | Major earthquake. Serious damage. | 10-15 |
| 8.0 or greater | Great earthquake. Can totally destroy communities near the epicenter. | One every year or two |
The largest earthquake felt in the area over the past 50 years was a 5.3 magnitude quake that occurred in Au Sable Forks, New York, in 2002. It damaged houses and cracked roads in a remote corner of the Adirondack Mountains, but caused no injuries.
| Date | Magnitude | Location | State |
|---|---|---|---|
| April 20, 2002 | 5.3 | Au Sable Forks | New York |
| October 7, 1983 | 5.1 | Newcomb | New York |
| April 5, 2024 | 4.8 | Whitehouse Station | New Jersey |
| October 16, 2012 | 4.7 | Hollis Center | Maine |
| January 16, 1994 | 4.6 | Sinking Spring | Pennsylvania |
| January 19, 1982 | 4.5 | Sanbornton | New Hampshire |
| September 25, 1998 | 4.5 | Adamsville | Pennsylvania |
| June 9, 1975 | 4.2 | Altona | New York |
| May 29, 1983 | 4.2 | Peru | Maine |
| April 23, 1984 | 4.2 | Conestoga | Pennsylvania |
| January 16, 1994 | 4.2 | Sinking Spring | Pennsylvania |
| November 3, 1975 | 4 | Long Lake | New York |
| June 17, 1991 | 4 | Worcester | New York |
The largest earthquake in U.S. history, however, was the 1964 Good Friday quake in Alaska, measuring 9.2 magnitude and killing 131 people.

-

 Debt1 week ago
How Debt-to-GDP Ratios Have Changed Since 2000
-

 Countries2 weeks ago
Population Projections: The World’s 6 Largest Countries in 2075
-

 Markets2 weeks ago
The Top 10 States by Real GDP Growth in 2023
-

 Demographics2 weeks ago
The Smallest Gender Wage Gaps in OECD Countries
-

 United States2 weeks ago
Where U.S. Inflation Hit the Hardest in March 2024
-

 Green2 weeks ago
Top Countries By Forest Growth Since 2001
-

 United States2 weeks ago
Ranked: The Largest U.S. Corporations by Number of Employees
-

 Maps2 weeks ago
The Largest Earthquakes in the New York Area (1970-2024)