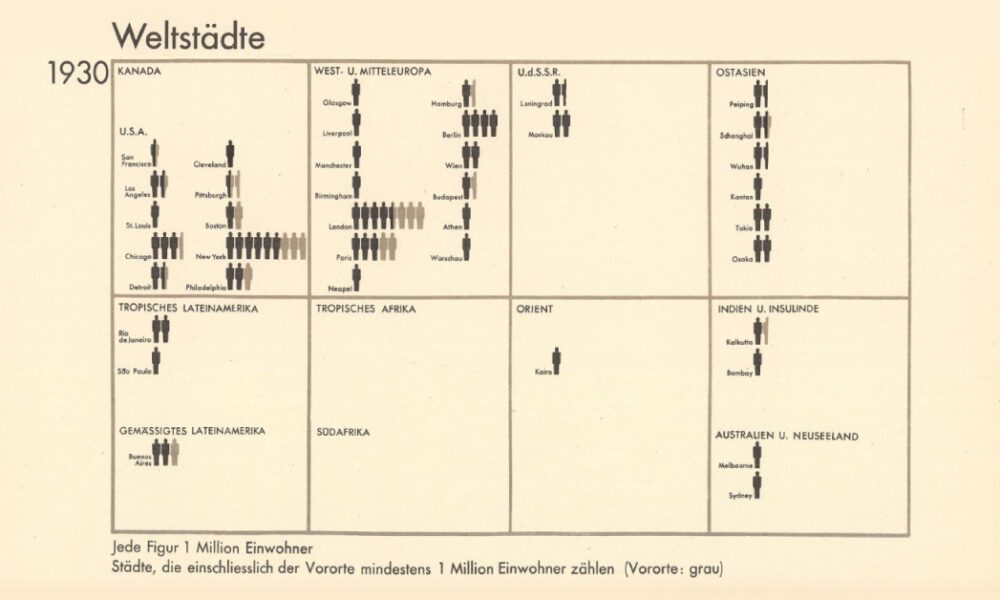
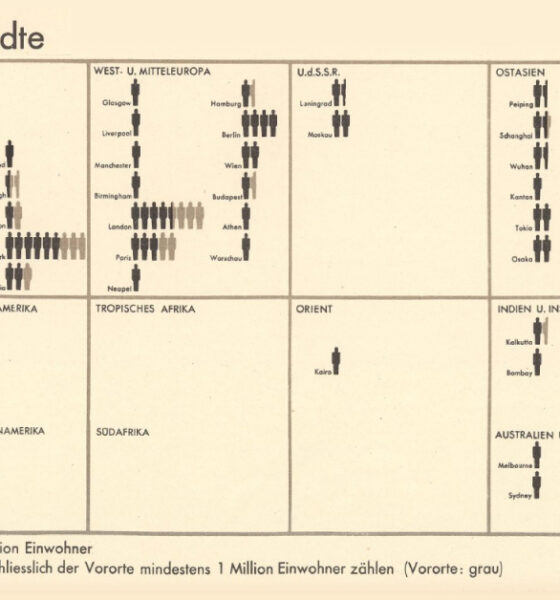
From someone born in the 19th century, in the midst of historic population growth, comes this vintage visualization showing world...


The top 10 news stories of 2023 according to Google Search trends, including two wars, three hurricanes, and a new moon landing.


From cultural events that dominated headlines to geopolitical shifts and clashes, what major events defined 2023?
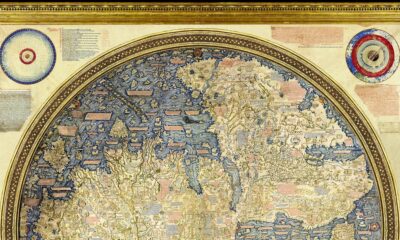

Check out the Fra Mauro Mappa Mundi (c. 1450s), a historical map that formed a bridge between medieval and renaissance worldviews.


We visualize Earth’s history through the geological timeline to reveal the planet’s many epochs, including the Anthropocene.


Rivers and lakes have played important roles throughout history. This Vintage Viz looks at these bodies of water from the viewpoint of 1850.


From single cells to bipedalism, humans have come a long way. Explore the fascinating journey of human evolution in this infographic.
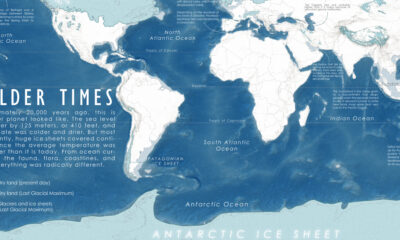

A map of the Earth 20,000 years ago, at the peak of the last ice age, when colder temperatures transformed the planet we know so well.
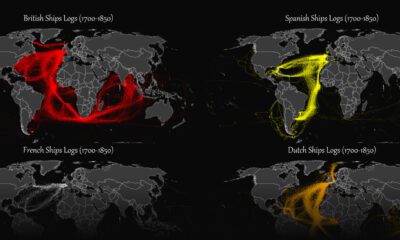

This map plots the colonial shipping lanes used by the British, the French, the Spanish, and the Dutch in the 18th and 19th centuries.
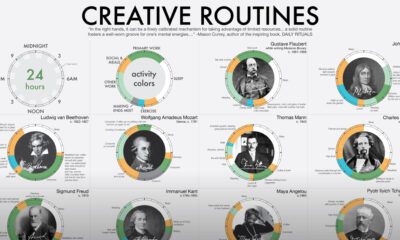

The daily routines of 16 famous creatives—poets, thinkers, scientists and even politicians—are charted for comparison with each other.


 Creator Program