Markets
Visualizing Japan’s Top 25 Companies by Market Cap
![]() See this visualization first on the Voronoi app.
See this visualization first on the Voronoi app.
Japan’s Top 25 Companies by Market Cap
This was originally posted on our Voronoi app. Download the app for free on iOS or Android and discover incredible data-driven charts from a variety of trusted sources.
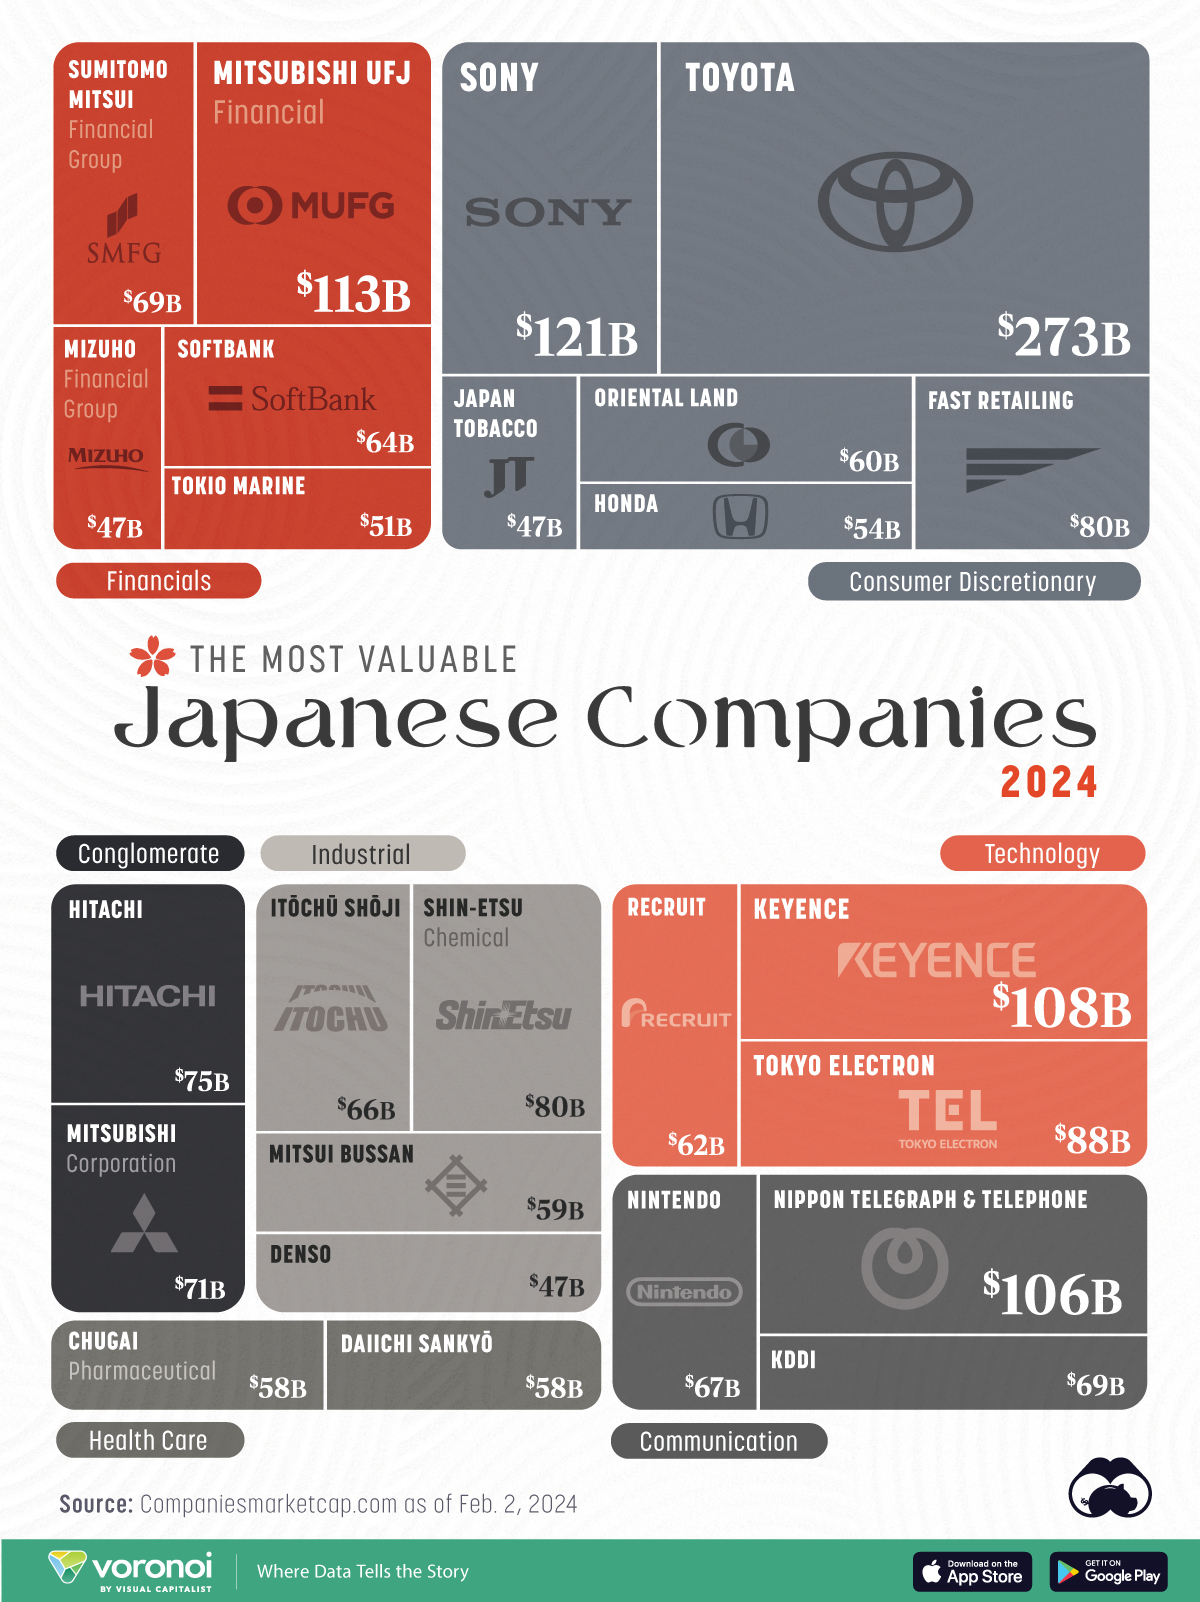
Japan’s top companies are worth a combined $2 trillion.
In this graphic, we use data from CompaniesMarketCap to list the country’s largest corporations, as measured by market capitalization as of Feb. 2, 2024.
Automaker and Electronics Company Lead
Japan is the third largest economy in the world after the United States and China, and also one of the top producers of manufactured goods globally.
The country’s largest company, automaker Toyota, has a market cap of over $273 billion. The company is the largest automobile manufacturer globally, producing about 10 million vehicles per year. It is also the 20th biggest company in the world.
In addition, the automaker is considered the most valuable brand in Japan, worth $53 billion.
| Rank | Name | Sector | Market Cap (USD) |
|---|---|---|---|
| 1 | Toyota | Consumer Discretionary | 273,143,000,000 |
| 2 | Sony | Consumer Discretionary | 121,276,000,000 |
| 3 | Mitsubishi UFJ Financial | Financials | 112,989,000,000 |
| 4 | Keyence | Technology | 108,077,000,000 |
| 5 | Nippon Telegraph & Telephone | Communication Services | 106,295,000,000 |
| 6 | Tokyo Electron | Technology | 87,707,456,525 |
| 7 | Fast Retailing | Consumer Discretionary | 80,279,788,422 |
| 8 | Shin-Etsu Chemical | Industrial | 79,917,463,493 |
| 9 | Hitachi | Conglomerate | 74,758,274,959 |
| 10 | Mitsubishi Corporation | Conglomerate | 71,239,298,556 |
| 11 | KDDI | Communication Services | 69,347,949,137 |
| 12 | Sumitomo Mitsui Financial Group | Financials | 68,730,634,240 |
| 13 | Nintendo | Communication Services | 66,761,374,986 |
| 14 | Itochu Shoji | Industrial | 65,654,901,787 |
| 15 | SoftBank | Financials | 63,807,211,511 |
| 16 | Recruit | Technology | 61,940,459,689 |
| 17 | Oriental Land | Consumer Discretionary | 59,854,280,904 |
| 18 | Mitsui Bussan | Industrial | 59,414,309,869 |
| 19 | Daiichi Sankyo | Health Care | 58,176,818,863 |
| 20 | Chugai Pharmaceutical | Health Care | 57,498,589,104 |
| 21 | Honda | Consumer Discretionary | 54,203,588,608 |
| 22 | Tokio Marine | Financials | 50,610,597,498 |
| 23 | Mizuho Financial Group | Financials | 47,274,393,600 |
| 24 | Denso | Industrial | 47,119,375,583 |
| 25 | Japan Tobacco | Consumer Discretionary | 46,744,684,688 |
In second place, Sony Group produces a variety of consumer electronics and entertainment products, including televisions, audio equipment, cameras, smartphones, and video games. The company also includes brands such as Sony Pictures and Sony Music, as well as a financial arm.
The list also includes Mitsubishi UFJ Financial (MUFJ), Japan’s largest financial group with nearly $3 trillion in assets, and Recruit, an HR company that owns the job search engine Indeed, as well as the employer review site Glassdoor.
Nintendo, a well-known brand outside of Japan, ranks 13th among the biggest Japanese companies.
At the bottom, Japan Tobacco is the company responsible for selling two well-known American brands, American Spirit and Camel, outside of the United States.
Most of the largest companies in Japan are in the consumer discretionary sector (24%), followed by financial firms (20%) and industrial groups (16%).


Markets
The European Stock Market: Attractive Valuations Offer Opportunities
On average, the European stock market has valuations that are nearly 50% lower than U.S. valuations. But how can you access the market?


European Stock Market: Attractive Valuations Offer Opportunities
Europe is known for some established brands, from L’Oréal to Louis Vuitton. However, the European stock market offers additional opportunities that may be lesser known.
The above infographic, sponsored by STOXX, outlines why investors may want to consider European stocks.
Attractive Valuations
Compared to most North American and Asian markets, European stocks offer lower or comparable valuations.
| Index | Price-to-Earnings Ratio | Price-to-Book Ratio |
|---|---|---|
| EURO STOXX 50 | 14.9 | 2.2 |
| STOXX Europe 600 | 14.4 | 2 |
| U.S. | 25.9 | 4.7 |
| Canada | 16.1 | 1.8 |
| Japan | 15.4 | 1.6 |
| Asia Pacific ex. China | 17.1 | 1.8 |
Data as of February 29, 2024. See graphic for full index names. Ratios based on trailing 12 month financials. The price to earnings ratio excludes companies with negative earnings.
On average, European valuations are nearly 50% lower than U.S. valuations, potentially offering an affordable entry point for investors.
Research also shows that lower price ratios have historically led to higher long-term returns.
Market Movements Not Closely Connected
Over the last decade, the European stock market had low-to-moderate correlation with North American and Asian equities.
The below chart shows correlations from February 2014 to February 2024. A value closer to zero indicates low correlation, while a value of one would indicate that two regions are moving in perfect unison.
| EURO STOXX 50 | STOXX EUROPE 600 | U.S. | Canada | Japan | Asia Pacific ex. China |
|
|---|---|---|---|---|---|---|
| EURO STOXX 50 | 1.00 | 0.97 | 0.55 | 0.67 | 0.24 | 0.43 |
| STOXX EUROPE 600 | 1.00 | 0.56 | 0.71 | 0.28 | 0.48 | |
| U.S. | 1.00 | 0.73 | 0.12 | 0.25 | ||
| Canada | 1.00 | 0.22 | 0.40 | |||
| Japan | 1.00 | 0.88 | ||||
| Asia Pacific ex. China | 1.00 |
Data is based on daily USD returns.
European equities had relatively independent market movements from North American and Asian markets. One contributing factor could be the differing sector weights in each market. For instance, technology makes up a quarter of the U.S. market, but health care and industrials dominate the broader European market.
Ultimately, European equities can enhance portfolio diversification and have the potential to mitigate risk for investors.
Tracking the Market
For investors interested in European equities, STOXX offers a variety of flagship indices:
| Index | Description | Market Cap |
|---|---|---|
| STOXX Europe 600 | Pan-regional, broad market | €10.5T |
| STOXX Developed Europe | Pan-regional, broad-market | €9.9T |
| STOXX Europe 600 ESG-X | Pan-regional, broad market, sustainability focus | €9.7T |
| STOXX Europe 50 | Pan-regional, blue-chip | €5.1T |
| EURO STOXX 50 | Eurozone, blue-chip | €3.5T |
Data is as of February 29, 2024. Market cap is free float, which represents the shares that are readily available for public trading on stock exchanges.
The EURO STOXX 50 tracks the Eurozone’s biggest and most traded companies. It also underlies one of the world’s largest ranges of ETFs and mutual funds. As of November 2023, there were €27.3 billion in ETFs and €23.5B in mutual fund assets under management tracking the index.
“For the past 25 years, the EURO STOXX 50 has served as an accurate, reliable and tradable representation of the Eurozone equity market.”
— Axel Lomholt, General Manager at STOXX
Partnering with STOXX to Track the European Stock Market
Are you interested in European equities? STOXX can be a valuable partner:
- Comprehensive, liquid and investable ecosystem
- European heritage, global reach
- Highly sophisticated customization capabilities
- Open architecture approach to using data
- Close partnerships with clients
- Part of ISS STOXX and Deutsche Börse Group
With a full suite of indices, STOXX can help you benchmark against the European stock market.
Learn how STOXX’s European indices offer liquid and effective market access.

-

 Economy3 days ago
Economic Growth Forecasts for G7 and BRICS Countries in 2024
The IMF has released its economic growth forecasts for 2024. How do the G7 and BRICS countries compare?
-

 Markets2 weeks ago
U.S. Debt Interest Payments Reach $1 Trillion
U.S. debt interest payments have surged past the $1 trillion dollar mark, amid high interest rates and an ever-expanding debt burden.
-

 United States2 weeks ago
Ranked: The Largest U.S. Corporations by Number of Employees
We visualized the top U.S. companies by employees, revealing the massive scale of retailers like Walmart, Target, and Home Depot.
-

 Markets2 weeks ago
The Top 10 States by Real GDP Growth in 2023
This graphic shows the states with the highest real GDP growth rate in 2023, largely propelled by the oil and gas boom.
-

 Markets3 weeks ago
Ranked: The World’s Top Flight Routes, by Revenue
In this graphic, we show the highest earning flight routes globally as air travel continued to rebound in 2023.
-

 Markets3 weeks ago
Ranked: The Most Valuable Housing Markets in America
The U.S. residential real estate market is worth a staggering $47.5 trillion. Here are the most valuable housing markets in the country.


-

 Science1 week ago
Visualizing the Average Lifespans of Mammals
-
Markets2 weeks ago
The Top 10 States by Real GDP Growth in 2023
-

 Demographics2 weeks ago
The Smallest Gender Wage Gaps in OECD Countries
-

 United States2 weeks ago
Where U.S. Inflation Hit the Hardest in March 2024
-

 Green2 weeks ago
Top Countries By Forest Growth Since 2001
-
United States2 weeks ago
Ranked: The Largest U.S. Corporations by Number of Employees
-

 Maps2 weeks ago
The Largest Earthquakes in the New York Area (1970-2024)
-

 Green2 weeks ago
Ranked: The Countries With the Most Air Pollution in 2023