Markets
Visualized: Which Airports Move the Most Cargo?


Which Airports Move the Most Cargo?
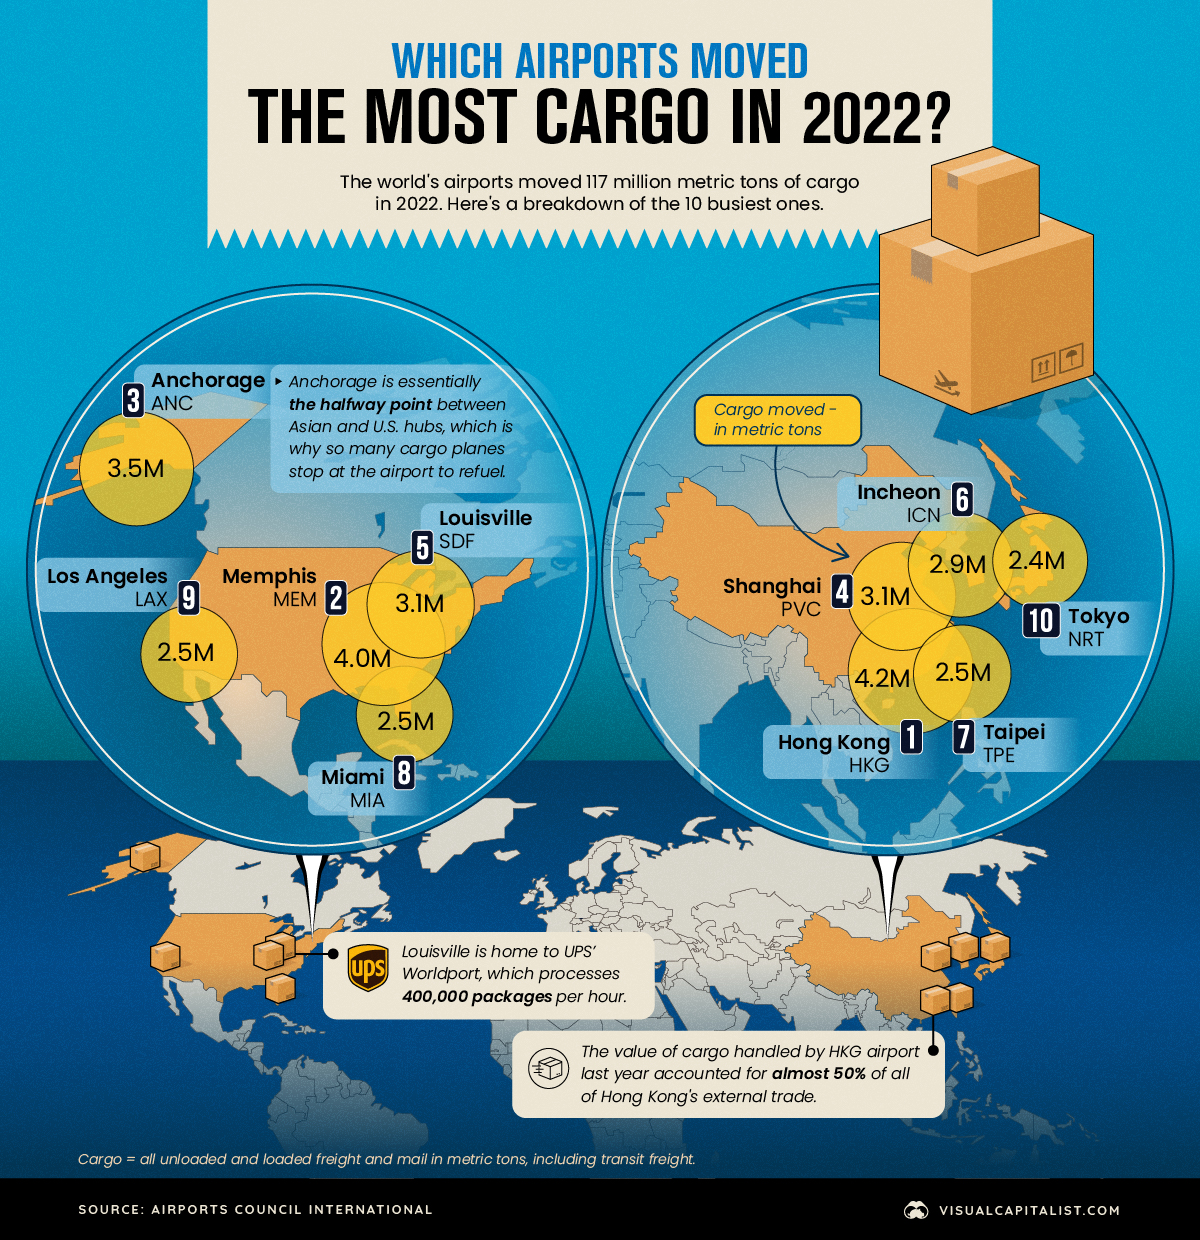
From facilitating crucial international supply chains to ensuring the smooth delivery of personal Amazon packages, cargo shipping is an important part of the global economy. Total air cargo shipped measured around 117 million metric tons in 2022.
This map uses data from Airports Council International (ACI) to showcase the global airports that move the most goods.
The Busiest Cargo Airports
The world’s busiest airport in terms of cargo is Hong Kong’s, which has held the number one spot for almost 28 years. Here’s a look at the ranking:
| Rank | Airport | Location | Cargo (Metric Tons) |
|---|---|---|---|
| #1 | HKG | 🇭🇰 Hong Kong SAR | 4,199,196 |
| #2 | MEM | 🇺🇸 Memphis, USA | 4,042,679 |
| #3 | ANC | 🇺🇸 Anchorage, USA | 3,461,603 |
| #4 | PVC | 🇨🇳 Shanghai, China | 3,117,216 |
| #5 | SDF | 🇺🇸 Louisville, USA | 3,067,234 |
| #6 | ICN | 🇰🇷 Incheon, South Korea | 2,945,855 |
| #7 | TPE | 🇹🇼 Taipei, Taiwan | 2,538,678 |
| #8 | MIA | 🇺🇸 Miami, USA | 2,499,837 |
| #9 | LAX | 🇺🇸 Los Angeles, USA | 2,489,854 |
| #10 | NRT | 🇯🇵 Tokyo, Japan | 2,399,298 |
Some of these busy airports are not well-known, and none of them, aside from LAX, rank as highly in terms of passenger traffic. For example, Anchorage ranks in the top 10 in cargo processed because it is cheaper for cargo carriers to stop over and refuel there, rather than flying nonstop from Asia to the United States.
The Memphis airport handles the most cargo in North America, largely because of FedEx’s significant presence there. FedEx processes over 245,000 documents and 180,000 packages an hour at Memphis’ airport.
On top of being home to UPS’ Worldport, the world’s biggest fully automated package processing facility, Louisville is also central to other transport routes in the United States. Packages come into this hub and then head out on the many highways and railways, as well as the Ohio River, which connects to the Mississippi River, one of the country’s main waterways for barge transit.
Cargo Shipment
Nearly every airport has seen significant increases in the amount of cargo moved year-over-year, with numbers now rising above pre-pandemic benchmarks. Notably, however, Shanghai and Hong Kong have experienced decreases due to geopolitical tensions.
In Hong Kong, goods movement via air travel is integral to the economy. Around half of the entire region’s external trade went through the airport in 2022.
Cargo transit is inherently important to the global economy. Around $6 trillion worth of goods move through airports annually, representing approximately 35% of world trade.


Markets
The European Stock Market: Attractive Valuations Offer Opportunities
On average, the European stock market has valuations that are nearly 50% lower than U.S. valuations. But how can you access the market?


European Stock Market: Attractive Valuations Offer Opportunities
Europe is known for some established brands, from L’Oréal to Louis Vuitton. However, the European stock market offers additional opportunities that may be lesser known.
The above infographic, sponsored by STOXX, outlines why investors may want to consider European stocks.
Attractive Valuations
Compared to most North American and Asian markets, European stocks offer lower or comparable valuations.
| Index | Price-to-Earnings Ratio | Price-to-Book Ratio |
|---|---|---|
| EURO STOXX 50 | 14.9 | 2.2 |
| STOXX Europe 600 | 14.4 | 2 |
| U.S. | 25.9 | 4.7 |
| Canada | 16.1 | 1.8 |
| Japan | 15.4 | 1.6 |
| Asia Pacific ex. China | 17.1 | 1.8 |
Data as of February 29, 2024. See graphic for full index names. Ratios based on trailing 12 month financials. The price to earnings ratio excludes companies with negative earnings.
On average, European valuations are nearly 50% lower than U.S. valuations, potentially offering an affordable entry point for investors.
Research also shows that lower price ratios have historically led to higher long-term returns.
Market Movements Not Closely Connected
Over the last decade, the European stock market had low-to-moderate correlation with North American and Asian equities.
The below chart shows correlations from February 2014 to February 2024. A value closer to zero indicates low correlation, while a value of one would indicate that two regions are moving in perfect unison.
| EURO STOXX 50 | STOXX EUROPE 600 | U.S. | Canada | Japan | Asia Pacific ex. China |
|
|---|---|---|---|---|---|---|
| EURO STOXX 50 | 1.00 | 0.97 | 0.55 | 0.67 | 0.24 | 0.43 |
| STOXX EUROPE 600 | 1.00 | 0.56 | 0.71 | 0.28 | 0.48 | |
| U.S. | 1.00 | 0.73 | 0.12 | 0.25 | ||
| Canada | 1.00 | 0.22 | 0.40 | |||
| Japan | 1.00 | 0.88 | ||||
| Asia Pacific ex. China | 1.00 |
Data is based on daily USD returns.
European equities had relatively independent market movements from North American and Asian markets. One contributing factor could be the differing sector weights in each market. For instance, technology makes up a quarter of the U.S. market, but health care and industrials dominate the broader European market.
Ultimately, European equities can enhance portfolio diversification and have the potential to mitigate risk for investors.
Tracking the Market
For investors interested in European equities, STOXX offers a variety of flagship indices:
| Index | Description | Market Cap |
|---|---|---|
| STOXX Europe 600 | Pan-regional, broad market | €10.5T |
| STOXX Developed Europe | Pan-regional, broad-market | €9.9T |
| STOXX Europe 600 ESG-X | Pan-regional, broad market, sustainability focus | €9.7T |
| STOXX Europe 50 | Pan-regional, blue-chip | €5.1T |
| EURO STOXX 50 | Eurozone, blue-chip | €3.5T |
Data is as of February 29, 2024. Market cap is free float, which represents the shares that are readily available for public trading on stock exchanges.
The EURO STOXX 50 tracks the Eurozone’s biggest and most traded companies. It also underlies one of the world’s largest ranges of ETFs and mutual funds. As of November 2023, there were €27.3 billion in ETFs and €23.5B in mutual fund assets under management tracking the index.
“For the past 25 years, the EURO STOXX 50 has served as an accurate, reliable and tradable representation of the Eurozone equity market.”
— Axel Lomholt, General Manager at STOXX
Partnering with STOXX to Track the European Stock Market
Are you interested in European equities? STOXX can be a valuable partner:
- Comprehensive, liquid and investable ecosystem
- European heritage, global reach
- Highly sophisticated customization capabilities
- Open architecture approach to using data
- Close partnerships with clients
- Part of ISS STOXX and Deutsche Börse Group
With a full suite of indices, STOXX can help you benchmark against the European stock market.
Learn how STOXX’s European indices offer liquid and effective market access.

-

 Economy3 days ago
Economic Growth Forecasts for G7 and BRICS Countries in 2024
The IMF has released its economic growth forecasts for 2024. How do the G7 and BRICS countries compare?
-

 Markets2 weeks ago
U.S. Debt Interest Payments Reach $1 Trillion
U.S. debt interest payments have surged past the $1 trillion dollar mark, amid high interest rates and an ever-expanding debt burden.
-

 United States2 weeks ago
Ranked: The Largest U.S. Corporations by Number of Employees
We visualized the top U.S. companies by employees, revealing the massive scale of retailers like Walmart, Target, and Home Depot.
-

 Markets2 weeks ago
The Top 10 States by Real GDP Growth in 2023
This graphic shows the states with the highest real GDP growth rate in 2023, largely propelled by the oil and gas boom.
-

 Markets2 weeks ago
Ranked: The World’s Top Flight Routes, by Revenue
In this graphic, we show the highest earning flight routes globally as air travel continued to rebound in 2023.
-

 Markets3 weeks ago
Ranked: The Most Valuable Housing Markets in America
The U.S. residential real estate market is worth a staggering $47.5 trillion. Here are the most valuable housing markets in the country.


-

 Debt1 week ago
How Debt-to-GDP Ratios Have Changed Since 2000
-
Markets2 weeks ago
Ranked: The World’s Top Flight Routes, by Revenue
-

 Countries2 weeks ago
Population Projections: The World’s 6 Largest Countries in 2075
-
Markets2 weeks ago
The Top 10 States by Real GDP Growth in 2023
-

 Demographics2 weeks ago
The Smallest Gender Wage Gaps in OECD Countries
-

 United States2 weeks ago
Where U.S. Inflation Hit the Hardest in March 2024
-

 Green2 weeks ago
Top Countries By Forest Growth Since 2001
-
United States2 weeks ago
Ranked: The Largest U.S. Corporations by Number of Employees