Markets
Timing the Market: Why It’s So Hard, in One Chart
Subscribe to the Advisor Channel free mailing list for more like this
 Can I share this graphic?
 When do I need a license?
 Interested in this piece?
The Risks and Rewards of Timing the Market
This was originally posted on Advisor Channel. Sign up to the free mailing list to get beautiful visualizations on financial markets that help advisors and their clients.
Timing the market seems simple enough: buy when prices are low and sell when they’re high.
But there is clear evidence that market timing is difficult. Often, investors will sell early, missing out on a stock market rally. It can also be unnerving to invest when the market is flashing red.
By contrast, staying invested through highs and lows has generated competitive returns, especially over longer periods.
The above graphic shows how trying to time the market can take a bite out of your portfolio value, using 20 years of data from JP Morgan.
The Pitfalls of Timing the Market
Mistiming the market even by just a few days can significantly affect an investor’s returns.
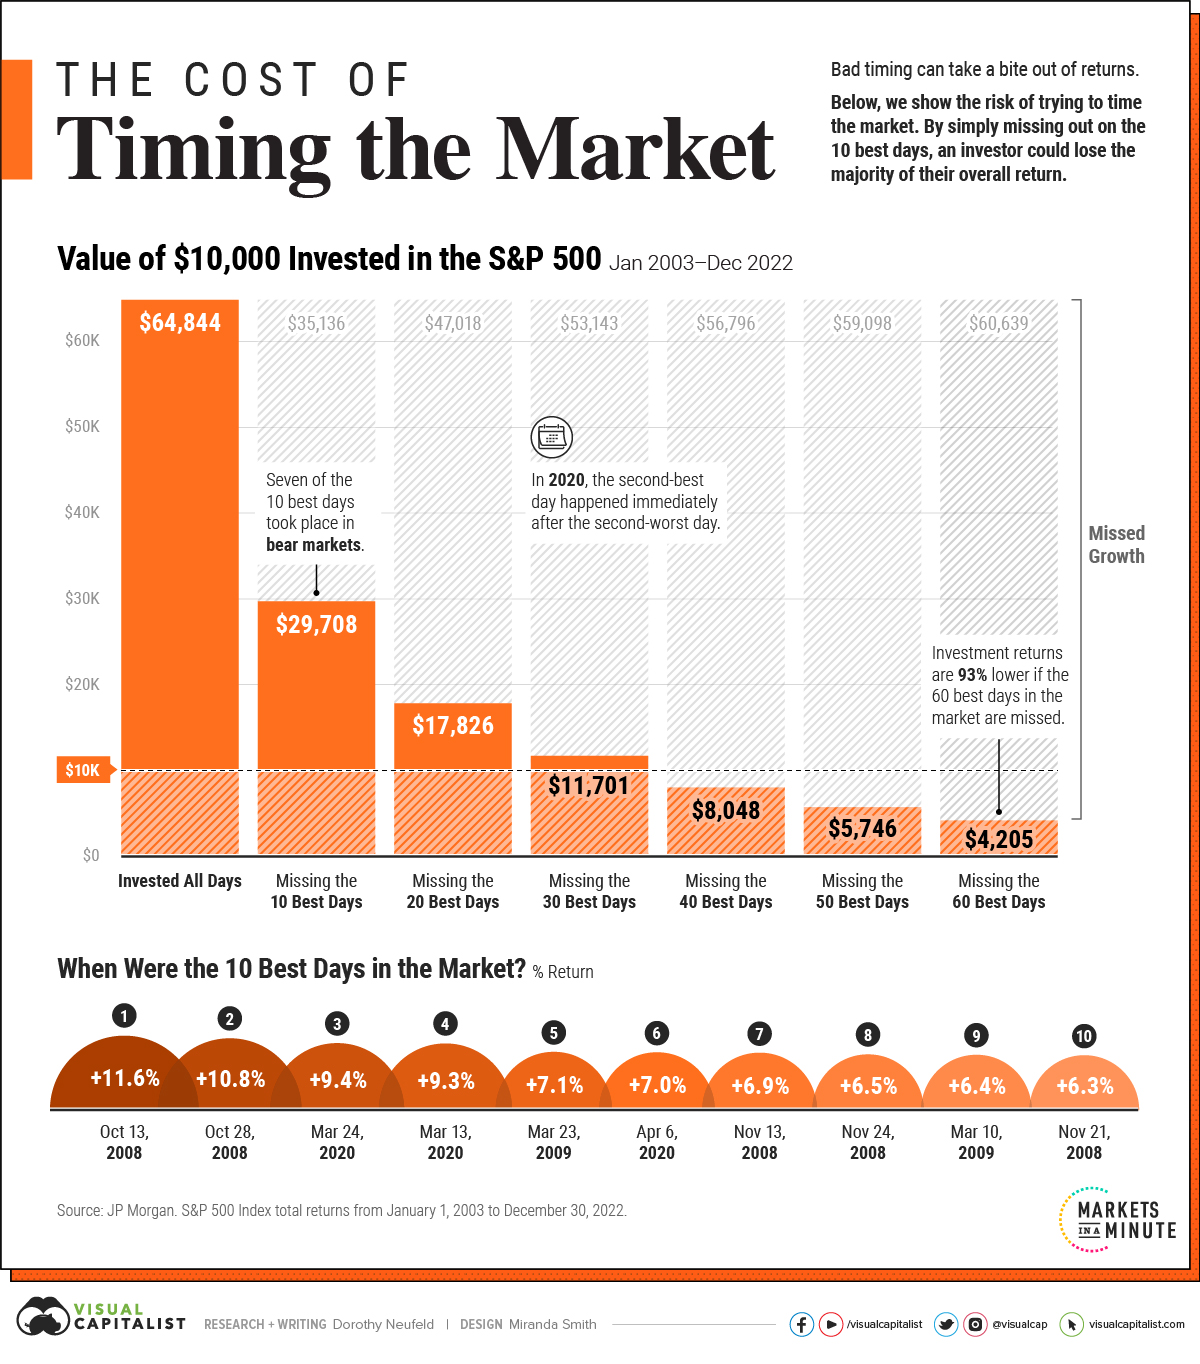
The following scenarios compare the total returns of a $10,000 investment in the S&P 500 between January 1, 2003 and December 30, 2022. Specifically, it highlights the impact of missing the best days in the market compared to sticking to a long-term investment plan.
| Portfolio Value | Annual Return (2003-2022) | |
|---|---|---|
| Invested All Days | $64,844 | +9.8% |
| Missed 10 Best Days | $29,708 | +5.6% |
| Missed 20 Best Days | $17,826 | +2.9% |
| Missed 30 Best Days | $11,701 | +0.8% |
| Missed 40 Best Days | $8,048 | -1.1% |
| Missed 50 Best Days | $5,746 | -2.7% |
| Missed 60 Best Days | $4,205 | -4.2% |
As we can see in the above table, the original investment grew over sixfold if an investor was fully invested for all days.
If an investor were to simply miss the 10 best days in the market, they would have shed over 50% of their end portfolio value. The investor would finish with a portfolio of only $29,708, compared to $64,844 if they had just stayed put.
Making matters worse, by missing 60 of the best days, they would have lost a striking 93% in value compared to what the portfolio would be worth if they had simply stayed invested.
Overall, an investor would have seen almost 10% in average annual returns using a buy-and-hold strategy. Average annual returns entered negative territory once they missed the 40 best days over the time frame.
The Best Days in the Market
Why is timing the market so hard? Often, the best days take place during bear markets.
| Rank | Date | Return |
|---|---|---|
| 1 | Oct 13, 2008 | +12% |
| 2 | Oct 28, 2008 | +11% |
| 3 | Mar 24, 2020 | +9% |
| 4 | Mar 13, 2020 | +9% |
| 5 | Mar 23, 2009 | +7% |
| 6 | Apr 6, 2020 | +7% |
| 7 | Nov 13, 2008 | +7% |
| 8 | Nov 24, 2008 | +7% |
| 9 | Mar 10, 2009 | +6% |
| 10 | Nov 21, 2008 | +6% |
Over the last 20 years, seven of the 10 best days happened when the market was in bear market territory.
Adding to this, many of the best days take place shortly after the worst days. In 2020, the second-best day fell right after the second-worst day that year. Similarly, in 2015, the best day of the year occurred two days after its worst day.
Interestingly, the worst days in the market typically occurred in bull markets.
Why Staying Invested Benefits Investors
As historical data shows, the best days happen during market turmoil and periods of heightened market volatility. In missing the best days in the market, an investor risks losing out on meaningful return appreciation over the long run.
Not only does timing the market take considerable skill, it involves temperament, and a consistent track record. If there were bullet-proof signals for timing the market, they would be used by everyone.


Markets
The European Stock Market: Attractive Valuations Offer Opportunities
On average, the European stock market has valuations that are nearly 50% lower than U.S. valuations. But how can you access the market?


European Stock Market: Attractive Valuations Offer Opportunities
Europe is known for some established brands, from L’Oréal to Louis Vuitton. However, the European stock market offers additional opportunities that may be lesser known.
The above infographic, sponsored by STOXX, outlines why investors may want to consider European stocks.
Attractive Valuations
Compared to most North American and Asian markets, European stocks offer lower or comparable valuations.
| Index | Price-to-Earnings Ratio | Price-to-Book Ratio |
|---|---|---|
| EURO STOXX 50 | 14.9 | 2.2 |
| STOXX Europe 600 | 14.4 | 2 |
| U.S. | 25.9 | 4.7 |
| Canada | 16.1 | 1.8 |
| Japan | 15.4 | 1.6 |
| Asia Pacific ex. China | 17.1 | 1.8 |
Data as of February 29, 2024. See graphic for full index names. Ratios based on trailing 12 month financials. The price to earnings ratio excludes companies with negative earnings.
On average, European valuations are nearly 50% lower than U.S. valuations, potentially offering an affordable entry point for investors.
Research also shows that lower price ratios have historically led to higher long-term returns.
Market Movements Not Closely Connected
Over the last decade, the European stock market had low-to-moderate correlation with North American and Asian equities.
The below chart shows correlations from February 2014 to February 2024. A value closer to zero indicates low correlation, while a value of one would indicate that two regions are moving in perfect unison.
| EURO STOXX 50 | STOXX EUROPE 600 | U.S. | Canada | Japan | Asia Pacific ex. China |
|
|---|---|---|---|---|---|---|
| EURO STOXX 50 | 1.00 | 0.97 | 0.55 | 0.67 | 0.24 | 0.43 |
| STOXX EUROPE 600 | 1.00 | 0.56 | 0.71 | 0.28 | 0.48 | |
| U.S. | 1.00 | 0.73 | 0.12 | 0.25 | ||
| Canada | 1.00 | 0.22 | 0.40 | |||
| Japan | 1.00 | 0.88 | ||||
| Asia Pacific ex. China | 1.00 |
Data is based on daily USD returns.
European equities had relatively independent market movements from North American and Asian markets. One contributing factor could be the differing sector weights in each market. For instance, technology makes up a quarter of the U.S. market, but health care and industrials dominate the broader European market.
Ultimately, European equities can enhance portfolio diversification and have the potential to mitigate risk for investors.
Tracking the Market
For investors interested in European equities, STOXX offers a variety of flagship indices:
| Index | Description | Market Cap |
|---|---|---|
| STOXX Europe 600 | Pan-regional, broad market | €10.5T |
| STOXX Developed Europe | Pan-regional, broad-market | €9.9T |
| STOXX Europe 600 ESG-X | Pan-regional, broad market, sustainability focus | €9.7T |
| STOXX Europe 50 | Pan-regional, blue-chip | €5.1T |
| EURO STOXX 50 | Eurozone, blue-chip | €3.5T |
Data is as of February 29, 2024. Market cap is free float, which represents the shares that are readily available for public trading on stock exchanges.
The EURO STOXX 50 tracks the Eurozone’s biggest and most traded companies. It also underlies one of the world’s largest ranges of ETFs and mutual funds. As of November 2023, there were €27.3 billion in ETFs and €23.5B in mutual fund assets under management tracking the index.
“For the past 25 years, the EURO STOXX 50 has served as an accurate, reliable and tradable representation of the Eurozone equity market.”
— Axel Lomholt, General Manager at STOXX
Partnering with STOXX to Track the European Stock Market
Are you interested in European equities? STOXX can be a valuable partner:
- Comprehensive, liquid and investable ecosystem
- European heritage, global reach
- Highly sophisticated customization capabilities
- Open architecture approach to using data
- Close partnerships with clients
- Part of ISS STOXX and Deutsche Börse Group
With a full suite of indices, STOXX can help you benchmark against the European stock market.
Learn how STOXX’s European indices offer liquid and effective market access.

-

 Economy2 days ago
Economic Growth Forecasts for G7 and BRICS Countries in 2024
The IMF has released its economic growth forecasts for 2024. How do the G7 and BRICS countries compare?
-

 Markets2 weeks ago
U.S. Debt Interest Payments Reach $1 Trillion
U.S. debt interest payments have surged past the $1 trillion dollar mark, amid high interest rates and an ever-expanding debt burden.
-

 United States2 weeks ago
Ranked: The Largest U.S. Corporations by Number of Employees
We visualized the top U.S. companies by employees, revealing the massive scale of retailers like Walmart, Target, and Home Depot.
-

 Markets2 weeks ago
The Top 10 States by Real GDP Growth in 2023
This graphic shows the states with the highest real GDP growth rate in 2023, largely propelled by the oil and gas boom.
-

 Markets2 weeks ago
Ranked: The World’s Top Flight Routes, by Revenue
In this graphic, we show the highest earning flight routes globally as air travel continued to rebound in 2023.
-

 Markets3 weeks ago
Ranked: The Most Valuable Housing Markets in America
The U.S. residential real estate market is worth a staggering $47.5 trillion. Here are the most valuable housing markets in the country.
-

 Debt1 week ago
How Debt-to-GDP Ratios Have Changed Since 2000
-
Markets2 weeks ago
Ranked: The World’s Top Flight Routes, by Revenue
-

 Countries2 weeks ago
Population Projections: The World’s 6 Largest Countries in 2075
-
Markets2 weeks ago
The Top 10 States by Real GDP Growth in 2023
-

 Demographics2 weeks ago
The Smallest Gender Wage Gaps in OECD Countries
-

 United States2 weeks ago
Where U.S. Inflation Hit the Hardest in March 2024
-

 Green2 weeks ago
Top Countries By Forest Growth Since 2001
-
United States2 weeks ago
Ranked: The Largest U.S. Corporations by Number of Employees