Economy
Visualizing Layoffs at Prominent Startups Triggered by COVID-19
 Can I share this graphic?
 When do I need a license?
 Interested in this piece?
Layoffs at Prominent Startups Triggered by COVID-19
As the pandemic reverberates through almost every industry imaginable, tech startups are also feeling the pain.
Since mid-March, countless startups and unicorns have undergone layoffs.
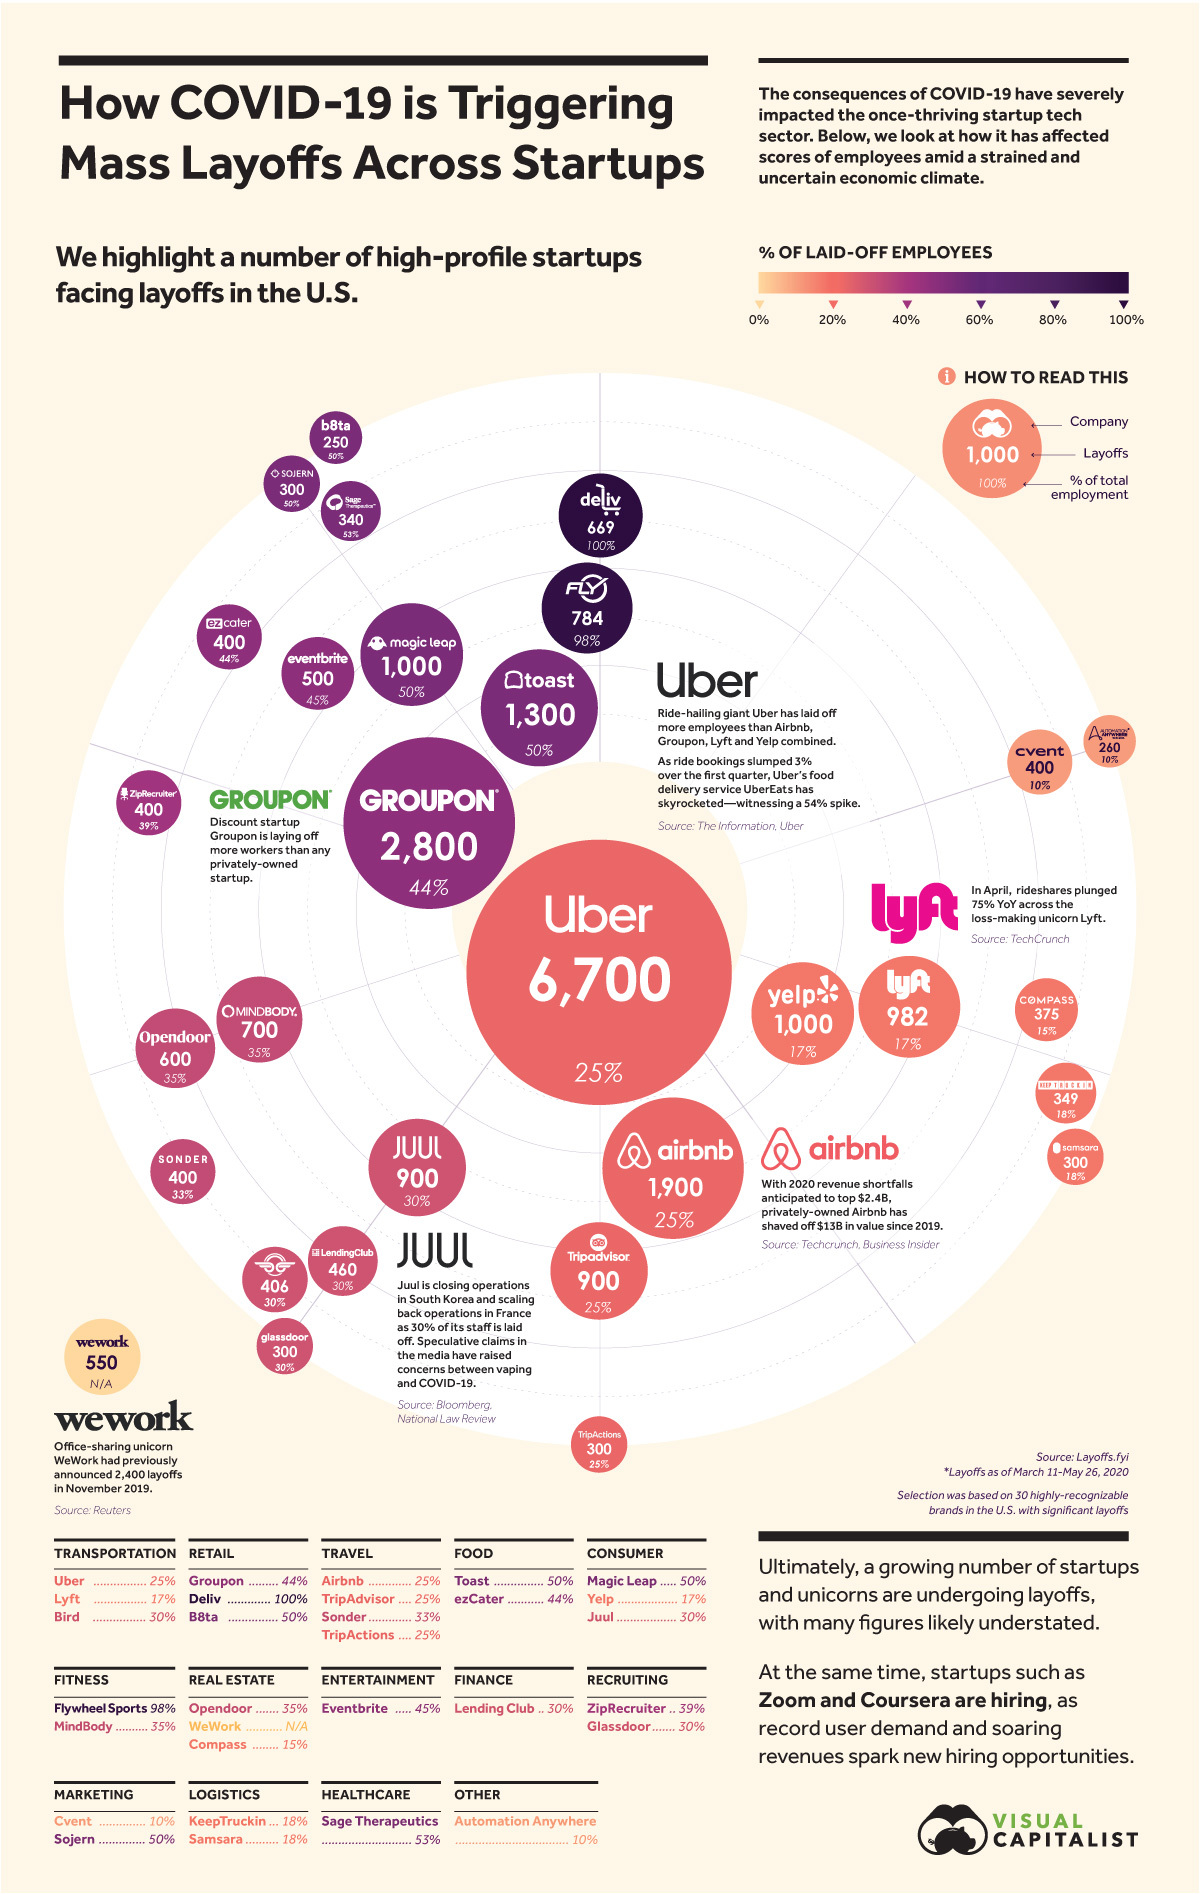
Today’s infographic pulls data from Layoffs.fyi, and navigates the cascading layoffs across 30 of the most recognizable startups in America. Each of the companies have slashed over 250 employees between March 11 and May 26, 2020—capturing a snapshot of the continuing fallout of COVID-19.
Silicon Valley Takes a Hit
Unsurprisingly, many of the hardest hit startups are related to the travel and mobility industry.
Closing 45 offices, Uber has laid off 6,700 employees since mid-March. Uber CEO Dara Khosrowshahi, who was granted a $45M earnings package in 2018, announced he will also waive his $1M base salary for the remainder of the year.
| Company | # Layoffs | % of Employees | Industry |
|---|---|---|---|
| Uber | 6,700 | 25% | Transportation |
| Lyft | 982 | 17% | Transportation |
| Bird | 406 | 30% | Transportation |
| Airbnb | 1,900 | 25% | Travel |
| TripAdvisor | 900 | 25% | Travel |
| Sonder | 400 | 33% | Travel |
| TripActions | 300 | 25% | Travel |
| Magic Leap | 1,000 | 50% | Consumer |
| Yelp | 1,000 | 17% | Consumer |
| Juul | 900 | 30% | Consumer |
| Groupon | 2,800 | 44% | Retail |
| Deliv | 669 | 100% | Retail |
| B8ta | 250 | 50% | Retail |
| Toast | 1,300 | 50% | Food |
| ezCater | 400 | 44% | Food |
| Flywheel Sports | 784 | 98% | Fitness |
| MindBody | 700 | 35% | Fitness |
| Opendoor | 600 | 35% | Real Estate |
| WeWork | 550 | N/A | Real Estate |
| Compass | 375 | 15% | Real Estate |
| ZipRecruiter | 400 | 39% | Recruiting |
| Glassdoor | 300 | 30% | Recruiting |
| Cvent | 400 | 10% | Marketing |
| Sojern | 300 | 50% | Marketing |
| KeepTruckin | 349 | 18% | Logistics |
| Samsara | 300 | 18% | Logistics |
| Eventbrite | 500 | 45% | Entertainment |
| Lending Club | 460 | 30% | Finance |
| Sage Therapeutics | 340 | 53% | Healthcare |
| Automation Anywhere | 260 | 10% | Other |
*Layoffs reported between March 11-May 26, 2020
Meanwhile, as room bookings dropped by over 40% across several countries, Airbnb laid off a quarter of its workforce. The tech darling is anticipating a $2.4B revenue shortfall in 2020.
Like many other big names—including Lyft, Uber, and WeWork—Airbnb is struggling to achieve profitability. In the first nine months of 2019, it lost $322M at the height of the market cycle.
Until 2021, gig-economy revenues are projected to drop by at least 30%.
International Startups Struggling
Startups in the U.S. aren’t the only ones scrambling to conserve cash and cut costs.
Brazil-based unicorn Stone has let go of 20% of its workforce. The rapidly growing digital payments company includes Warren Buffett as a major stakeholder, holding an 8% share as of March 2020.
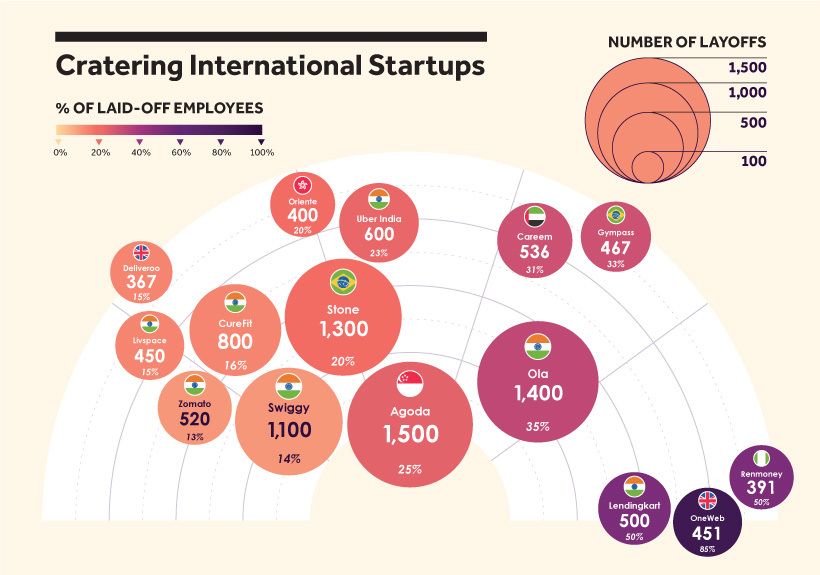
At the same time, India-based ride-hailing Ola has witnessed revenue declines of 95% since mid-March. It laid off 1,400 employees as bookings drastically declined.
| Company | # Layoffs | % of Employees | Location |
|---|---|---|---|
| Swiggy | 1,100 | 14% | India |
| Agoda | 1,500 | 25% | Singapore |
| Ola | 1,400 | 35% | India |
| Stone | 1,300 | 20% | Brazil |
| CureFit | 800 | 16% | India |
| Uber India | 600 | 23% | India |
| Careem | 536 | 31% | U.A.E. |
| Zomato | 520 | 13% | India |
| Lendingkart | 500 | 50% | India |
| Gympass | 467 | 33% | Brazil |
| OneWeb | 451 | 85% | United Kingdom |
| Livspace | 450 | 15% | India |
| Oriente | 400 | 20% | Hong Kong |
| Renmoney | 391 | 50% | Nigeria |
| Deliveroo | 367 | 15% | United Kingdom |
Similarly, Uber India has rivaled Ola in dominance across India’s $10B ride-hailing market since launching three years after Ola, in 2013. Now, almost 25% of the Uber India workforce have been laid off.
Of course, these reports do not fully take into account the growing impact of COVID-19, but help paint a picture as the cracks emerge.
Pandemic-Proof?
While the job market remains murky, what startups are looking to hire?
Coursera, an online education startup, listed 60 openings in May. By the end of the year, the company plans to hire 250 additional staff. Within the peak of widespread global lockdowns, the platform attracted 10M new users.
Meanwhile, Canva, an Australia-based graphic design unicorn, is seeking to fill 100 positions worldwide. In partnership with Google for Education, Canva offers project-based learning tools designed for classrooms, in addition to free graphic design resources.
At the same time, tech heavyweights Facebook and Amazon reported openings. Booming startups such as Plaid, Zoom, and Pinterest are also listing new positions as shifting consumer demand continues to shape unpredictable and historic hiring markets.


Markets
Ranked: The Largest U.S. Corporations by Number of Employees
We visualized the top U.S. companies by employees, revealing the massive scale of retailers like Walmart, Target, and Home Depot.


The Largest U.S. Corporations by Number of Employees
This was originally posted on our Voronoi app. Download the app for free on Apple or Android and discover incredible data-driven charts from a variety of trusted sources.
Revenue and profit are common measures for measuring the size of a business, but what about employee headcount?
To see how big companies have become from a human perspective, we’ve visualized the top U.S. companies by employees. These figures come from companiesmarketcap.com, and were accessed in March 2024. Note that this ranking includes publicly-traded companies only.
Data and Highlights
The data we used to create this list of largest U.S. corporations by number of employees can be found in the table below.
| Company | Sector | Number of Employees |
|---|---|---|
| Walmart | Consumer Staples | 2,100,000 |
| Amazon | Consumer Discretionary | 1,500,000 |
| UPS | Industrials | 500,000 |
| Home Depot | Consumer Discretionary | 470,000 |
| Concentrix | Information Technology | 440,000 |
| Target | Consumer Staples | 440,000 |
| Kroger | Consumer Staples | 430,000 |
| UnitedHealth | Health Care | 400,000 |
| Berkshire Hathaway | Financials | 383,000 |
| Starbucks | Consumer Discretionary | 381,000 |
| Marriott International | Consumer Discretionary | 377,000 |
| Cognizant | Information Technology | 346,600 |
Retail and Logistics Top the List
Companies like Walmart, Target, and Kroger have a massive headcount due to having many locations spread across the country, which require everything from cashiers to IT professionals.
Moving goods around the world is also highly labor intensive, explaining why UPS has half a million employees globally.
Below the Radar?
Two companies that rank among the largest U.S. corporations by employees which may be less familiar to the public include Concentrix and Cognizant. Both of these companies are B2B brands, meaning they primarily work with other companies rather than consumers. This contrasts with brands like Amazon or Home Depot, which are much more visible among average consumers.
A Note on Berkshire Hathaway
Warren Buffett’s company doesn’t directly employ 383,000 people. This headcount actually includes the employees of the firm’s many subsidiaries, such as GEICO (insurance), Dairy Queen (retail), and Duracell (batteries).
If you’re curious to see how Buffett’s empire has grown over the years, check out this animated graphic that visualizes the growth of Berkshire Hathaway’s portfolio from 1994 to 2022.

-

 Technology2 weeks ago
Ranked: The Most Popular Smartphone Brands in the U.S.
-

 Automotive1 week ago
Almost Every EV Stock is Down After Q1 2024
-

 Money1 week ago
Where Does One U.S. Tax Dollar Go?
-

 Green2 weeks ago
Ranked: Top Countries by Total Forest Loss Since 2001
-

 Real Estate2 weeks ago
Visualizing America’s Shortage of Affordable Homes
-

 Maps2 weeks ago
Mapped: Average Wages Across Europe
-

 Mining2 weeks ago
Charted: The Value Gap Between the Gold Price and Gold Miners
-

 Demographics2 weeks ago
Visualizing the Size of the Global Senior Population