Markets
Visualized: U.S. Corporate Bankruptcies On the Rise


Visualized: U.S. Corporate Bankruptcies on the Rise
In March, Silicon Valley Bank collapsed, plunging its parent company SVB Financial Group into bankruptcy a week later.
While many expected a wave of bank failures to follow, much of this has since been averted—but cracks have begun to emerge with Moody’s recent downgrading of 10 small and mid-sized banks.
Across the wider corporate landscape, bankruptcies have begun to tick higher. Overstretched balance sheets coupled with 11 interest rate hikes since last year have added to mounting challenges for companies across many sectors.
This graphic shows the surge in corporate bankruptcies in 2023 based on data from S&P Global.
U.S. Corporate Bankruptcies Grow
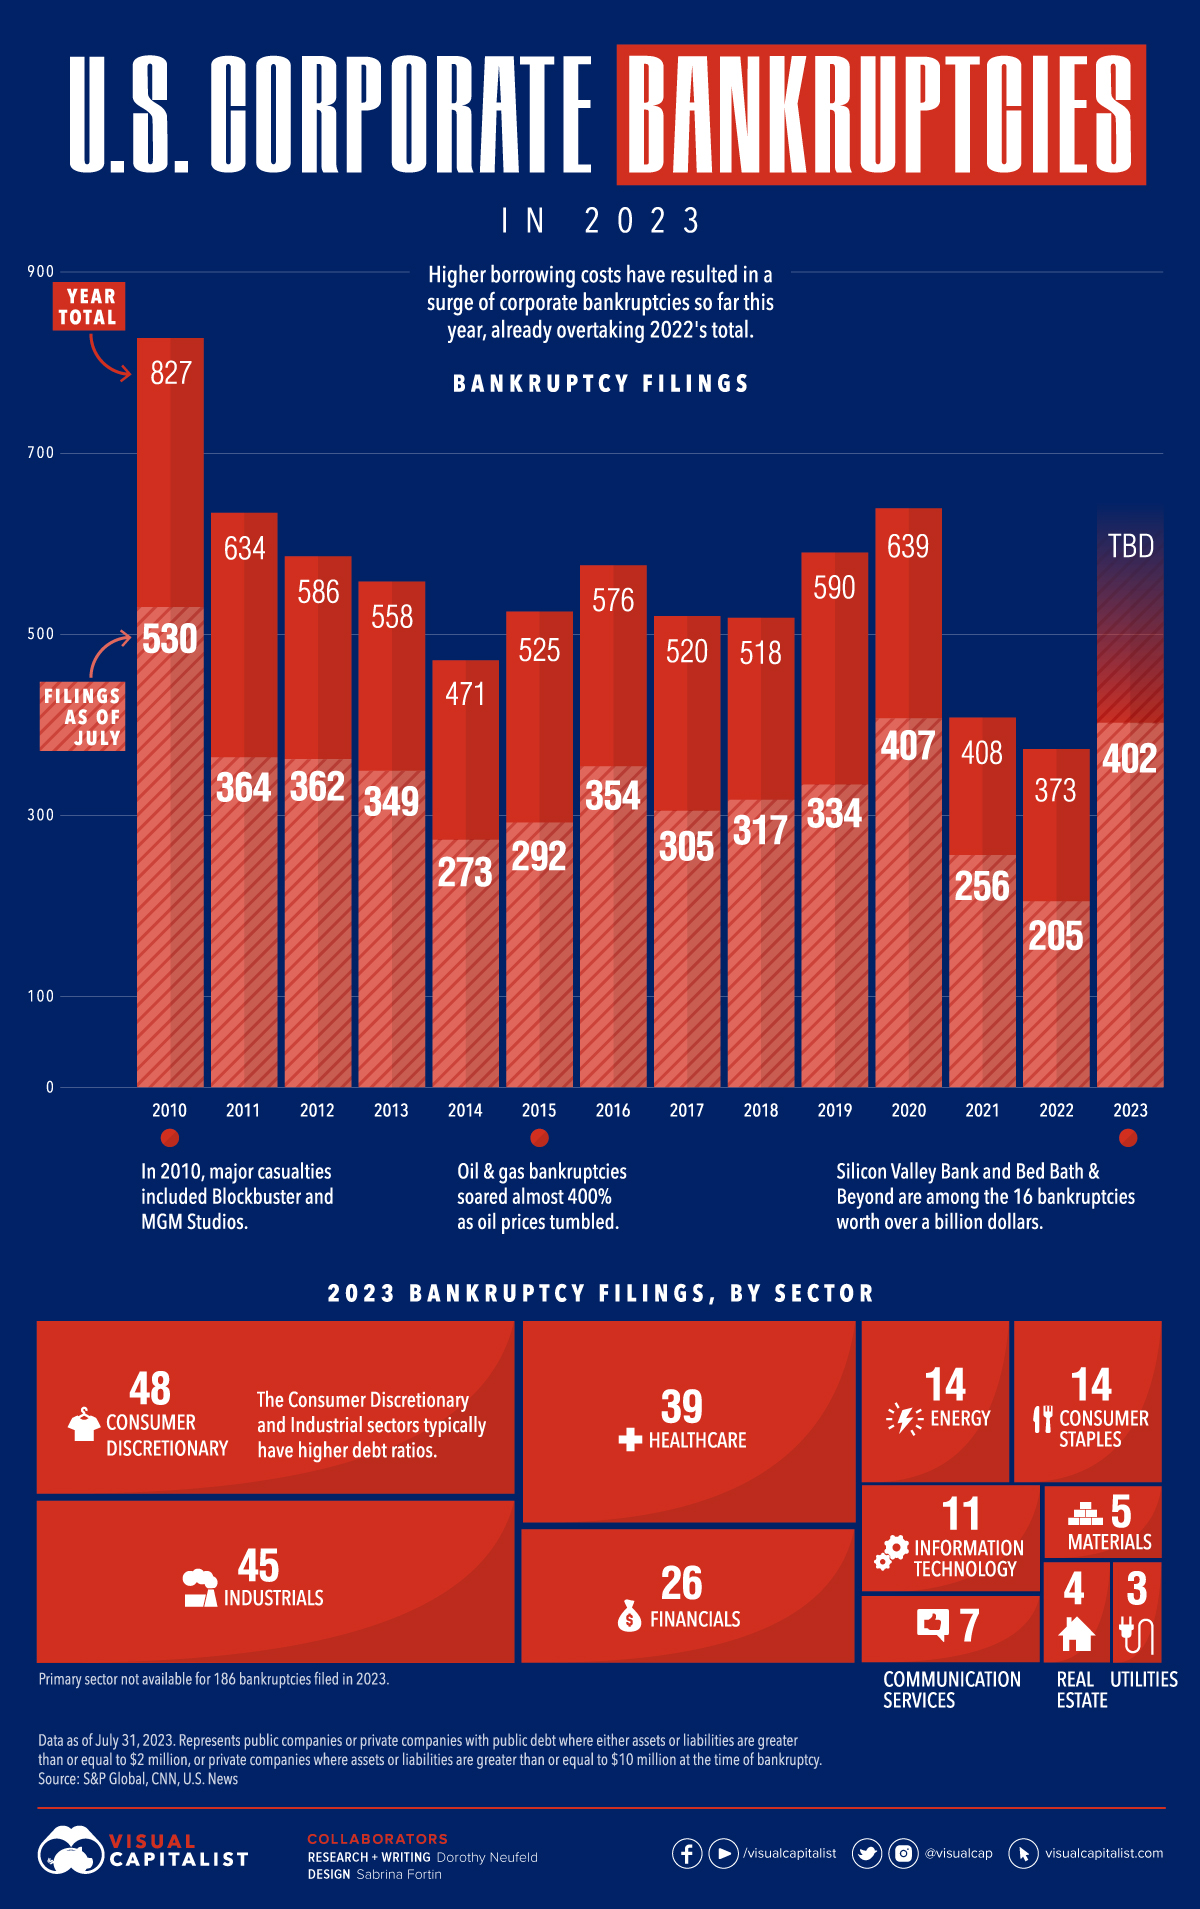
So far in 2023, over 400 corporations have gone under. Corporate bankruptcies are rising at the fastest pace since 2010 (barring the pandemic), and are double the level seen this time last year.
Below, we show trends in corporate casualties with data as of July 31, 2023:
| Year of Filing | Bankruptcy Filings as of July | Annual Total |
|---|---|---|
| 2023 | 402 | N/A |
| 2022 | 205 | 373 |
| 2021 | 256 | 408 |
| 2020 | 407 | 639 |
| 2019 | 334 | 590 |
| 2018 | 317 | 518 |
| 2017 | 305 | 520 |
| 2016 | 354 | 576 |
| 2015 | 292 | 525 |
| 2014 | 273 | 471 |
| 2013 | 349 | 558 |
| 2012 | 362 | 586 |
| 2011 | 364 | 634 |
| 2010 | 530 | 827 |
Represents public or private companies with public debt where either assets or liabilities are greater than or equal to $2 million, or private companies where assets or liabilities are greater than or equal to $10 million at time of bankruptcy.
Firms in the consumer discretionary and industrial sectors have seen the most bankruptcies, based on available data. Historically, both sectors carry significant debt on their balance sheets compared to other sectors, putting them at higher risk in a rising rate environment.
Overall, U.S. corporate interest costs have increased 22% annually compared to the first quarter of 2021. These additional costs, combined with higher wages, energy, and materials, among others, mean that companies may be under greater pressure to cut costs, restructure their debt, or in the worst case, fold.
Billion-Dollar Bankruptcies
This year, 16 companies with over $1 billion in liabilities have filed for bankruptcy. Among the most notable are retail chain Bed Bath & Beyond and the parent company of Silicon Valley Bank.
| Company | Primary Sector | Date |
|---|---|---|
| Party City | Consumer Discretionary | Jan 2023 |
| Serta Simmons Bedding | Consumer Discretionary | Jan 2023 |
| Avaya | Information Technology | Feb 2023 |
| Diamond Sports | Communication Services | Mar 2023 |
| SVB Financial | Financials | Mar 2023 |
| LTL Management | N/A | Apr 2023 |
| Bed Bath & Beyond | Consumer Discretionary | Apr 2023 |
| Whittaker, Clark & Daniels | N/A | Apr 2023 |
| Monitronics | Industrials | May 2023 |
| Kidde-Fenwal | Consumer Discretionary | May 2023 |
| Envision Healthcare | Healthcare | May 2023 |
| Diebold | N/A | Jun 2023 |
| Wesco Aircraft | Industrials | Jun 2023 |
| PGX Holdings | Industrials | Jun 2023 |
| Cyxtera | Information Technology | Jun 2023 |
| Voyager Aviation | Industrials | Jul 2023 |
Mattress giant Serta Simmons filed for bankruptcy early this year. It once made up nearly 20% of bedding sales in America. With a vast share of debt coming due this year, the company was unable to make payments due to higher borrowing costs.
What Comes Next?
In many ways, U.S. corporations have been resilient despite the sharp rise in borrowing costs and economic uncertainty.
This can be explained in part by stronger than anticipated profits seen in 2022. While some companies have cut costs, others have hiked prices in an inflationary environment, creating buffers for rising interest payments. Still, S&P 500 earnings have begun to slow this year, falling over 5% in the second quarter compared to last year.
Secondly, the structure of corporate debt is much different than before the global financial crash. Many companies locked in fixed-rate debt over longer periods after the crisis. Today, roughly 72% of rated U.S. corporate debt has fixed rates.
At the same time, banks are getting more creative with their lending structures when companies get into trouble. There has been a record “extend and amend” activity for certain types of corporate bonds. This debt restructuring is enabling companies to keep operating.
The bad news is that corporate debt swelled during the pandemic, and eventually this debt will come due likely at much higher costs and with more severe consequences.


Markets
The European Stock Market: Attractive Valuations Offer Opportunities
On average, the European stock market has valuations that are nearly 50% lower than U.S. valuations. But how can you access the market?


European Stock Market: Attractive Valuations Offer Opportunities
Europe is known for some established brands, from L’Oréal to Louis Vuitton. However, the European stock market offers additional opportunities that may be lesser known.
The above infographic, sponsored by STOXX, outlines why investors may want to consider European stocks.
Attractive Valuations
Compared to most North American and Asian markets, European stocks offer lower or comparable valuations.
| Index | Price-to-Earnings Ratio | Price-to-Book Ratio |
|---|---|---|
| EURO STOXX 50 | 14.9 | 2.2 |
| STOXX Europe 600 | 14.4 | 2 |
| U.S. | 25.9 | 4.7 |
| Canada | 16.1 | 1.8 |
| Japan | 15.4 | 1.6 |
| Asia Pacific ex. China | 17.1 | 1.8 |
Data as of February 29, 2024. See graphic for full index names. Ratios based on trailing 12 month financials. The price to earnings ratio excludes companies with negative earnings.
On average, European valuations are nearly 50% lower than U.S. valuations, potentially offering an affordable entry point for investors.
Research also shows that lower price ratios have historically led to higher long-term returns.
Market Movements Not Closely Connected
Over the last decade, the European stock market had low-to-moderate correlation with North American and Asian equities.
The below chart shows correlations from February 2014 to February 2024. A value closer to zero indicates low correlation, while a value of one would indicate that two regions are moving in perfect unison.
| EURO STOXX 50 | STOXX EUROPE 600 | U.S. | Canada | Japan | Asia Pacific ex. China |
|
|---|---|---|---|---|---|---|
| EURO STOXX 50 | 1.00 | 0.97 | 0.55 | 0.67 | 0.24 | 0.43 |
| STOXX EUROPE 600 | 1.00 | 0.56 | 0.71 | 0.28 | 0.48 | |
| U.S. | 1.00 | 0.73 | 0.12 | 0.25 | ||
| Canada | 1.00 | 0.22 | 0.40 | |||
| Japan | 1.00 | 0.88 | ||||
| Asia Pacific ex. China | 1.00 |
Data is based on daily USD returns.
European equities had relatively independent market movements from North American and Asian markets. One contributing factor could be the differing sector weights in each market. For instance, technology makes up a quarter of the U.S. market, but health care and industrials dominate the broader European market.
Ultimately, European equities can enhance portfolio diversification and have the potential to mitigate risk for investors.
Tracking the Market
For investors interested in European equities, STOXX offers a variety of flagship indices:
| Index | Description | Market Cap |
|---|---|---|
| STOXX Europe 600 | Pan-regional, broad market | €10.5T |
| STOXX Developed Europe | Pan-regional, broad-market | €9.9T |
| STOXX Europe 600 ESG-X | Pan-regional, broad market, sustainability focus | €9.7T |
| STOXX Europe 50 | Pan-regional, blue-chip | €5.1T |
| EURO STOXX 50 | Eurozone, blue-chip | €3.5T |
Data is as of February 29, 2024. Market cap is free float, which represents the shares that are readily available for public trading on stock exchanges.
The EURO STOXX 50 tracks the Eurozone’s biggest and most traded companies. It also underlies one of the world’s largest ranges of ETFs and mutual funds. As of November 2023, there were €27.3 billion in ETFs and €23.5B in mutual fund assets under management tracking the index.
“For the past 25 years, the EURO STOXX 50 has served as an accurate, reliable and tradable representation of the Eurozone equity market.”
— Axel Lomholt, General Manager at STOXX
Partnering with STOXX to Track the European Stock Market
Are you interested in European equities? STOXX can be a valuable partner:
- Comprehensive, liquid and investable ecosystem
- European heritage, global reach
- Highly sophisticated customization capabilities
- Open architecture approach to using data
- Close partnerships with clients
- Part of ISS STOXX and Deutsche Börse Group
With a full suite of indices, STOXX can help you benchmark against the European stock market.
Learn how STOXX’s European indices offer liquid and effective market access.

-

 Economy2 days ago
Economic Growth Forecasts for G7 and BRICS Countries in 2024
The IMF has released its economic growth forecasts for 2024. How do the G7 and BRICS countries compare?
-

 Markets1 week ago
U.S. Debt Interest Payments Reach $1 Trillion
U.S. debt interest payments have surged past the $1 trillion dollar mark, amid high interest rates and an ever-expanding debt burden.
-

 United States2 weeks ago
Ranked: The Largest U.S. Corporations by Number of Employees
We visualized the top U.S. companies by employees, revealing the massive scale of retailers like Walmart, Target, and Home Depot.
-

 Markets2 weeks ago
The Top 10 States by Real GDP Growth in 2023
This graphic shows the states with the highest real GDP growth rate in 2023, largely propelled by the oil and gas boom.
-

 Markets2 weeks ago
Ranked: The World’s Top Flight Routes, by Revenue
In this graphic, we show the highest earning flight routes globally as air travel continued to rebound in 2023.
-

 Markets2 weeks ago
Ranked: The Most Valuable Housing Markets in America
The U.S. residential real estate market is worth a staggering $47.5 trillion. Here are the most valuable housing markets in the country.


-

 Education1 week ago
How Hard Is It to Get Into an Ivy League School?
-

 Technology2 weeks ago
Ranked: Semiconductor Companies by Industry Revenue Share
-
Markets2 weeks ago
Ranked: The World’s Top Flight Routes, by Revenue
-

 Demographics2 weeks ago
Population Projections: The World’s 6 Largest Countries in 2075
-
Markets2 weeks ago
The Top 10 States by Real GDP Growth in 2023
-

 Demographics2 weeks ago
The Smallest Gender Wage Gaps in OECD Countries
-

 Economy2 weeks ago
Where U.S. Inflation Hit the Hardest in March 2024
-

 Green2 weeks ago
Top Countries By Forest Growth Since 2001