Markets
Animated: Global Debt Projections (2005-2027P)
Animated Chart: Global Debt Projections
Total global debt stands at nearly $305 trillion as of the first quarter of 2023.
Over the next five years, it is projected to jump even further—raising concerns about government leverage in a high interest rate and slower growth environment.
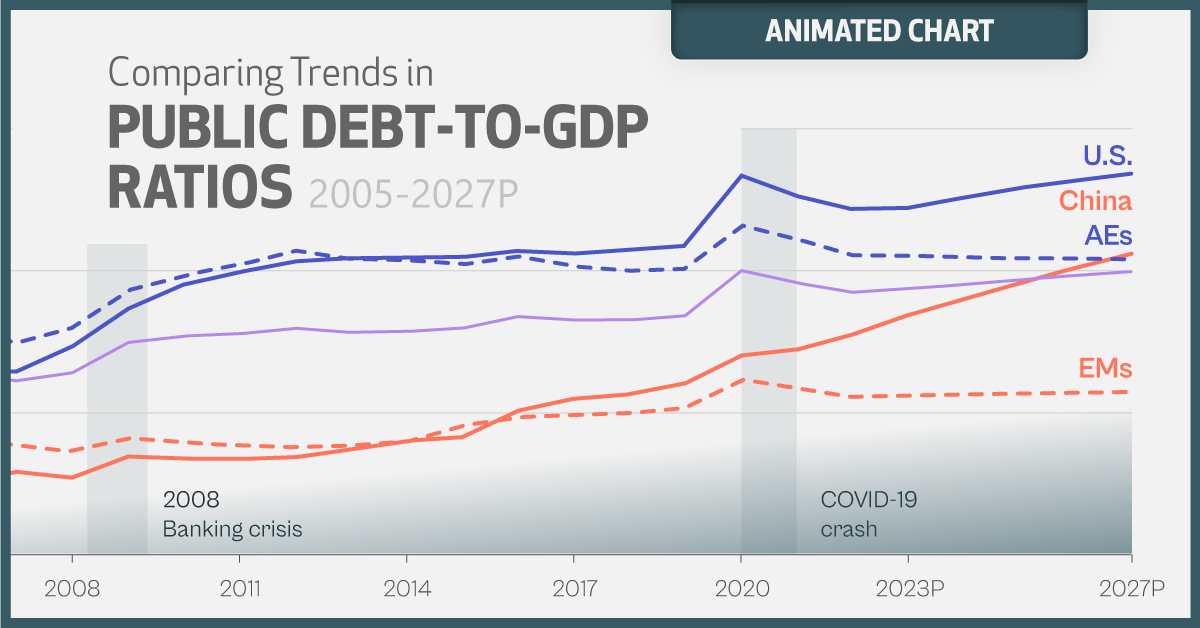
As global debt continues to climb, this animated graphic shows data and projections for public debt-to-GDP ratios using the World Economic Outlook (April 2023 update) from the IMF.
Growing Global Debt Projections
After rising steadily for years, government debt first ballooned to almost 100% of GDP in 2020. While this ratio has fallen amid an economic rebound and high inflation in 2021 and 2022, it is projected to regain ground and continue climbing.
World government debt is now projected to rise to 99.5% of GDP by 2027. Here’s data going back to 2005, as well as the forecast for global public debt-to-GDP:
| Year | 🇺🇸 U.S. | 🇨🇳 China | 🌎 Global Average |
|---|---|---|---|
| 2027P | 134.0% | 105.9% | 99.5% |
| 2026P | 131.8% | 101.0% | 98.2% |
| 2025P | 129.2% | 95.7% | 96.8% |
| 2024P | 125.9% | 90.1% | 95.1% |
| 2023P | 122.2% | 84.4% | 93.6% |
| 2022 | 121.7% | 77.5% | 92.3% |
| 2021 | 126.4% | 72.3% | 95.7% |
| 2020 | 133.5% | 70.1% | 99.8% |
| 2019 | 108.7% | 60.4% | 84.2% |
| 2018 | 107.4% | 56.7% | 82.8% |
| 2017 | 106.2% | 55.0% | 82.6% |
| 2016 | 107.2% | 50.7% | 83.8% |
| 2015 | 105.1% | 41.5% | 79.9% |
| 2014 | 104.5% | 40.0% | 78.6% |
| 2013 | 104.5% | 37.0% | 78.3% |
| 2012 | 103.0% | 34.4% | 79.7% |
| 2011 | 99.5% | 33.8% | 77.9% |
| 2010 | 95.1% | 33.9% | 76.9% |
| 2009 | 86.6% | 34.6% | 74.7% |
| 2008 | 73.4% | 27.2% | 64.3% |
| 2007 | 64.6% | 29.2% | 61.3% |
| 2006 | 64.2% | 25.6% | 64.3% |
| 2005 | 65.4% | 26.3% | 68.1% |
Debt sharply increased in both 2020 and 2009 in conjunction with economic downturns. Historically, debt levels compared to GDP tend to increase as little as 4% and much as 15% in the five years after a global recession has ended.
In the U.S., public debt-to-GDP is set to reach a record 134% by 2027. The sharp rise in interest rates is increasing net debt servicing costs, which stood at $475 billion last year. Over the next 10 years, net interest costs on U.S. debt are projected to total $10.6 trillion.
China’s debt has also risen rapidly, and is projected to eclipse 100% by 2026. Public debt as a percentage of GDP is forecast to jump fourfold between 2005 and 2027. This year alone, new government debt issuance is projected to hit record levels. A large portion of this debt consists of infrastructure bonds that are focused on boosting the economy.
Comparing Trends Across Global Economies
Below, we show how the public debt-to-GDP ratios for advanced economies compare with emerging markets and low-income countries. Both the U.S. and China are excluded here:
| Year | Advanced Economies | Emerging Markets | Low-Income Countries |
|---|---|---|---|
| 2027P | 103.8% | 57.2% | 43.8% |
| 2026P | 104.1% | 56.9% | 44.5% |
| 2025P | 104.4% | 56.6% | 45.3% |
| 2024P | 104.5% | 56.1% | 46.3% |
| 2023P | 105.2% | 55.7% | 47.6% |
| 2022 | 105.5% | 55.2% | 47.9% |
| 2021 | 111.3% | 58.6% | 47.9% |
| 2020 | 115.8% | 61.4% | 48.0% |
| 2019 | 100.8% | 51.6% | 42.6% |
| 2018 | 100.0% | 49.8% | 41.5% |
| 2017 | 101.7% | 49.1% | 41.2% |
| 2016 | 104.9% | 48.3% | 38.6% |
| 2015 | 102.3% | 45.2% | 35.1% |
| 2014 | 103.4% | 39.9% | 31.2% |
| 2013 | 104.0% | 38.4% | 30.9% |
| 2012 | 107.1% | 38.0% | 29.9% |
| 2011 | 102.2% | 38.3% | 29.9% |
| 2010 | 98.4% | 39.6% | 28.4% |
| 2009 | 93.1% | 41.1% | 29.9% |
| 2008 | 79.9% | 36.4% | 27.5% |
| 2007 | 74.7% | 38.4% | 29.4% |
| 2006 | 78.8% | 41.0% | 33.0% |
| 2005 | 82.2% | 45.9% | 42.0% |
In a retreat from 2020 highs, public debt is projected to fall meaningfully compared to GDP by 2027 for advanced economies excluding America. Emerging markets are also projected to see this leverage ratio decline.
Low-income countries have smaller debt levels compared to output, which is expected to continue over the next five years. Despite this, 39 of these countries are in debt distress—or are close to it—as high interest rates add pressure to government balance sheets.
Are High Global Debt Levels Sustainable?
The good news is that 60% of economies are forecast to see their public debt-to-GDP ratios fall below COVID-19 peaks by 2027.
On the other hand, many large advanced and emerging economies, including China, Brazil, Japan, and Türkiye are projected to face steeper debt. In the U.S., payments on public debt have soared to record levels due to rising interest rates.
This comes as aging populations, slower economic growth, and healthcare costs are straining government spending, a trend seen across many advanced economies.
Countries with economic growth rising faster than real interest rates may be more likely to sustain high debt levels. But sticky inflation, prompting higher interest rates, will likely make these debt piles even more fragile.


Markets
The European Stock Market: Attractive Valuations Offer Opportunities
On average, the European stock market has valuations that are nearly 50% lower than U.S. valuations. But how can you access the market?


European Stock Market: Attractive Valuations Offer Opportunities
Europe is known for some established brands, from L’Oréal to Louis Vuitton. However, the European stock market offers additional opportunities that may be lesser known.
The above infographic, sponsored by STOXX, outlines why investors may want to consider European stocks.
Attractive Valuations
Compared to most North American and Asian markets, European stocks offer lower or comparable valuations.
| Index | Price-to-Earnings Ratio | Price-to-Book Ratio |
|---|---|---|
| EURO STOXX 50 | 14.9 | 2.2 |
| STOXX Europe 600 | 14.4 | 2 |
| U.S. | 25.9 | 4.7 |
| Canada | 16.1 | 1.8 |
| Japan | 15.4 | 1.6 |
| Asia Pacific ex. China | 17.1 | 1.8 |
Data as of February 29, 2024. See graphic for full index names. Ratios based on trailing 12 month financials. The price to earnings ratio excludes companies with negative earnings.
On average, European valuations are nearly 50% lower than U.S. valuations, potentially offering an affordable entry point for investors.
Research also shows that lower price ratios have historically led to higher long-term returns.
Market Movements Not Closely Connected
Over the last decade, the European stock market had low-to-moderate correlation with North American and Asian equities.
The below chart shows correlations from February 2014 to February 2024. A value closer to zero indicates low correlation, while a value of one would indicate that two regions are moving in perfect unison.
| EURO STOXX 50 | STOXX EUROPE 600 | U.S. | Canada | Japan | Asia Pacific ex. China |
|
|---|---|---|---|---|---|---|
| EURO STOXX 50 | 1.00 | 0.97 | 0.55 | 0.67 | 0.24 | 0.43 |
| STOXX EUROPE 600 | 1.00 | 0.56 | 0.71 | 0.28 | 0.48 | |
| U.S. | 1.00 | 0.73 | 0.12 | 0.25 | ||
| Canada | 1.00 | 0.22 | 0.40 | |||
| Japan | 1.00 | 0.88 | ||||
| Asia Pacific ex. China | 1.00 |
Data is based on daily USD returns.
European equities had relatively independent market movements from North American and Asian markets. One contributing factor could be the differing sector weights in each market. For instance, technology makes up a quarter of the U.S. market, but health care and industrials dominate the broader European market.
Ultimately, European equities can enhance portfolio diversification and have the potential to mitigate risk for investors.
Tracking the Market
For investors interested in European equities, STOXX offers a variety of flagship indices:
| Index | Description | Market Cap |
|---|---|---|
| STOXX Europe 600 | Pan-regional, broad market | €10.5T |
| STOXX Developed Europe | Pan-regional, broad-market | €9.9T |
| STOXX Europe 600 ESG-X | Pan-regional, broad market, sustainability focus | €9.7T |
| STOXX Europe 50 | Pan-regional, blue-chip | €5.1T |
| EURO STOXX 50 | Eurozone, blue-chip | €3.5T |
Data is as of February 29, 2024. Market cap is free float, which represents the shares that are readily available for public trading on stock exchanges.
The EURO STOXX 50 tracks the Eurozone’s biggest and most traded companies. It also underlies one of the world’s largest ranges of ETFs and mutual funds. As of November 2023, there were €27.3 billion in ETFs and €23.5B in mutual fund assets under management tracking the index.
“For the past 25 years, the EURO STOXX 50 has served as an accurate, reliable and tradable representation of the Eurozone equity market.”
— Axel Lomholt, General Manager at STOXX
Partnering with STOXX to Track the European Stock Market
Are you interested in European equities? STOXX can be a valuable partner:
- Comprehensive, liquid and investable ecosystem
- European heritage, global reach
- Highly sophisticated customization capabilities
- Open architecture approach to using data
- Close partnerships with clients
- Part of ISS STOXX and Deutsche Börse Group
With a full suite of indices, STOXX can help you benchmark against the European stock market.
Learn how STOXX’s European indices offer liquid and effective market access.

-

 Economy4 days ago
Economic Growth Forecasts for G7 and BRICS Countries in 2024
The IMF has released its economic growth forecasts for 2024. How do the G7 and BRICS countries compare?
-

 Markets2 weeks ago
U.S. Debt Interest Payments Reach $1 Trillion
U.S. debt interest payments have surged past the $1 trillion dollar mark, amid high interest rates and an ever-expanding debt burden.
-

 United States2 weeks ago
Ranked: The Largest U.S. Corporations by Number of Employees
We visualized the top U.S. companies by employees, revealing the massive scale of retailers like Walmart, Target, and Home Depot.
-

 Markets2 weeks ago
The Top 10 States by Real GDP Growth in 2023
This graphic shows the states with the highest real GDP growth rate in 2023, largely propelled by the oil and gas boom.
-

 Markets3 weeks ago
Ranked: The World’s Top Flight Routes, by Revenue
In this graphic, we show the highest earning flight routes globally as air travel continued to rebound in 2023.
-

 Markets3 weeks ago
Ranked: The Most Valuable Housing Markets in America
The U.S. residential real estate market is worth a staggering $47.5 trillion. Here are the most valuable housing markets in the country.


-

 Science1 week ago
Visualizing the Average Lifespans of Mammals
-

 Demographics2 weeks ago
The Smallest Gender Wage Gaps in OECD Countries
-

 United States2 weeks ago
Where U.S. Inflation Hit the Hardest in March 2024
-

 Green2 weeks ago
Top Countries By Forest Growth Since 2001
-
United States2 weeks ago
Ranked: The Largest U.S. Corporations by Number of Employees
-

 Maps2 weeks ago
The Largest Earthquakes in the New York Area (1970-2024)
-

 Green2 weeks ago
Ranked: The Countries With the Most Air Pollution in 2023
-

 Green2 weeks ago
Ranking the Top 15 Countries by Carbon Tax Revenue