Markets
The Top Performing S&P 500 Sectors Over the Business Cycle
Subscribe to the Advisor Channel free mailing list for more like this
The Top Performing S&P 500 Sectors Over the Business Cycle
This was originally posted on Advisor Channel. Sign up to the free mailing list to get beautiful visualizations on financial markets that help advisors and their clients.
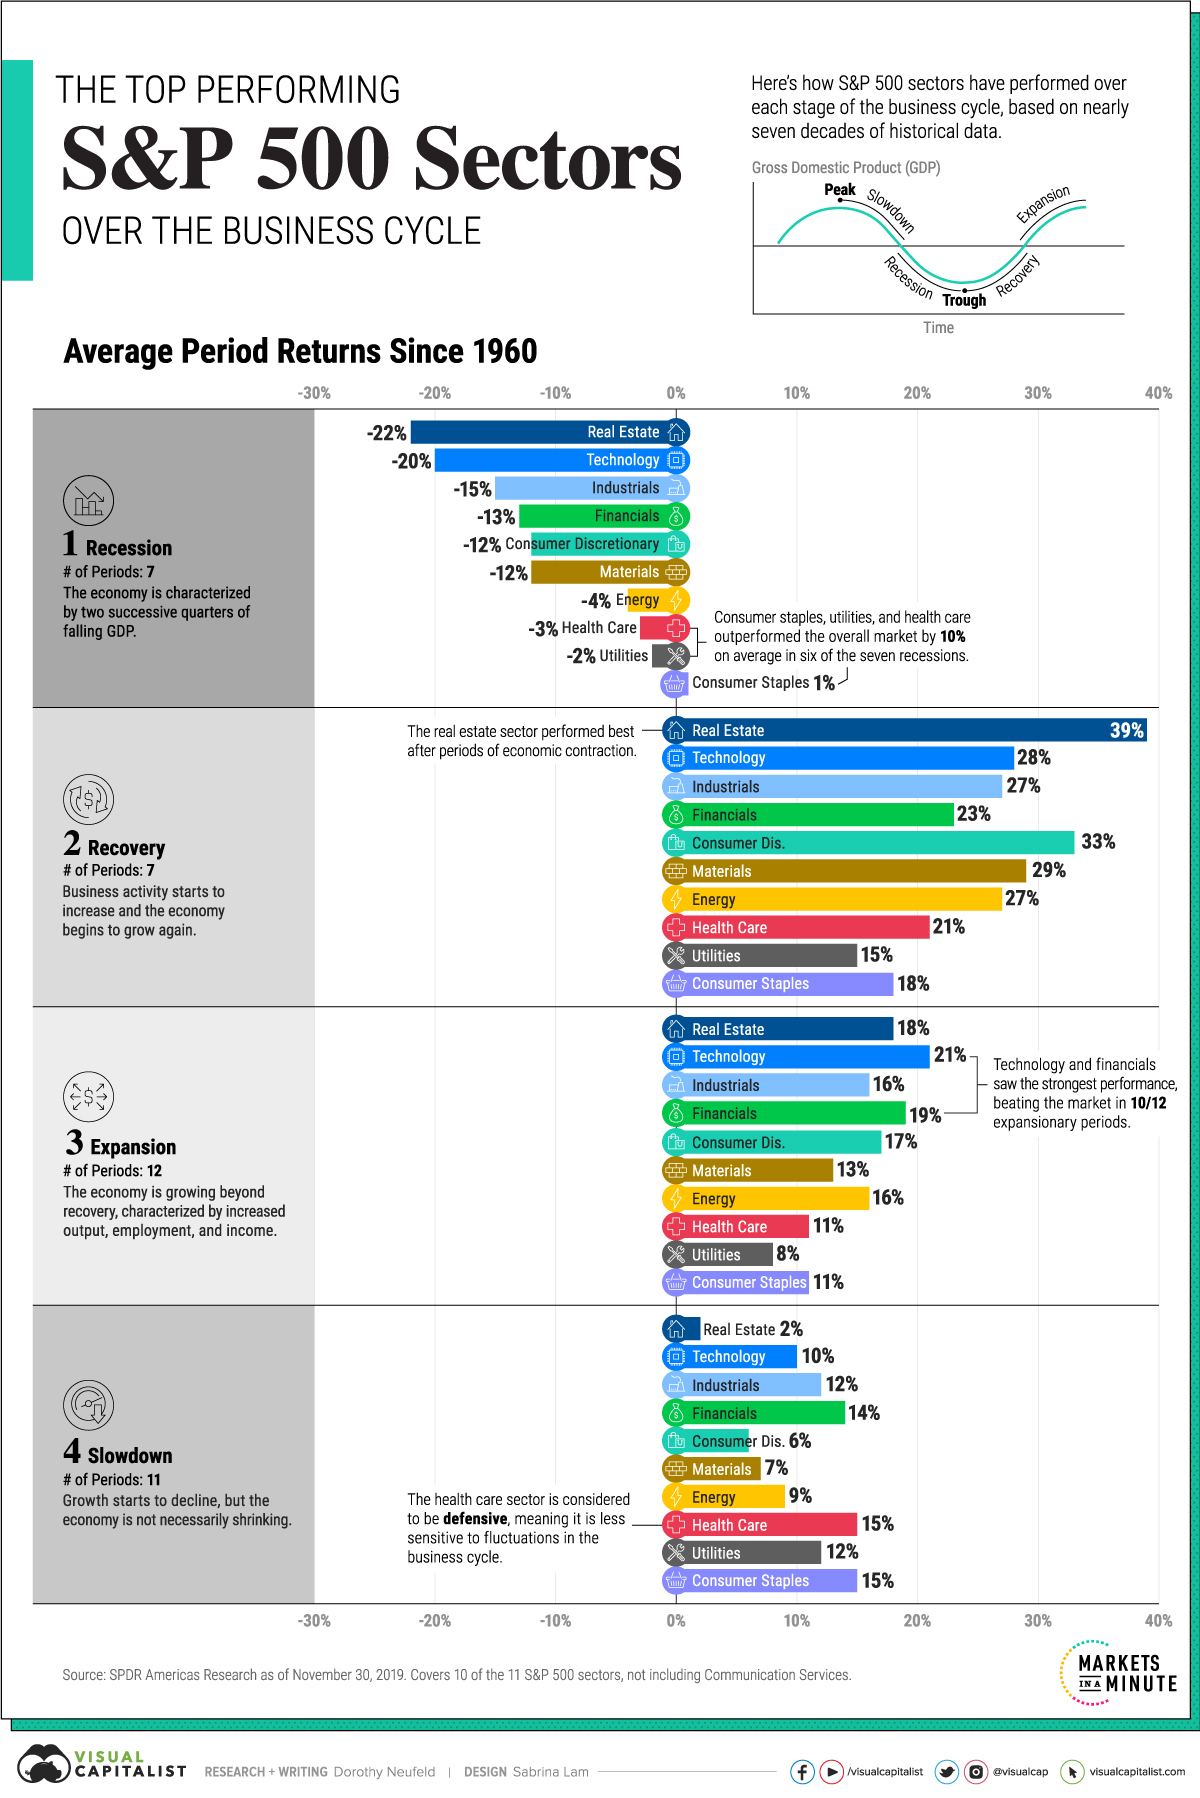
The business cycle fluctuates over time, from the highs of an expansion to the lows of a recession, and each phase impacts the performance of S&P 500 sectors differently.
And though affected sectors have different levels of average performance, any given period may see the outperformance of certain sectors due to external factors, such as technological advancements or high-impact global events (i.e. global pandemics, international conflicts, etc.)
The above graphic uses data from SPDR Americas Research to show the top performing sectors through the business cycle over almost 70 years.
The Business Cycle: Methodology
The dataset is based on the Conference Board’s Leading Economic Index, which assesses U.S. economic activity. This index includes 10 economic indicators that reveal typical turning points in the business cycle covering employment, consumer expectations, and financial conditions.
Overall from December 1, 1960 to November 30, 2019, the dataset covers:
- 7 recessions
- 7 recoveries
- 12 expansions
- 11 slowdowns
Returns are shown for all of the S&P 500 sectors with the exception of the communication services sector. This is because the sector was created relatively recently in 2018 and comprises previous technology, consumer discretionary, and telecommunication stocks already covered in the dataset.
1. Recession
Broadly speaking, a recession is a period of temporary economic decline characterized by two successive quarters of falling GDP.
During this period, consumer staples was the top performing S&P 500 sector, and the only one that has averaged a positive return. Utilities and health care, traditionally defensive sectors, followed next in line. Together, these sectors averaged 10% higher returns than the overall market during six of the seven recessions.
| Rank | S&P 500 Sector | Average Period Return |
|---|---|---|
| 1 | Consumer Staples | +1% |
| 2 | Utilities | -2% |
| 3 | Health Care | -3% |
| 4 | Energy | -4% |
| 5 | Consumer Discretionary | -12% |
| 6 | Materials | -12% |
| 7 | Financials | -13% |
| 8 | Industrials | -15% |
| 9 | Technology | -20% |
| 10 | Real Estate | -22% |
Real estate has been the worst performer during recessions, given its high sensitivity to discretionary spending as both household income and business activity tend to decline.
2. Recovery
A recovery is the phase following a recession where economic activity starts to increase and the economy begins to grow again.
Real estate outperformed all other sectors with an average 39% return. As monetary policy eases and interest rates fall historically after recessions, this makes purchasing real estate more affordable, in turn supporting the sector’s performance.
| Rank | S&P 500 Sector | Average Period Return |
|---|---|---|
| 1 | Real Estate | +39% |
| 2 | Consumer Discretionary | +33% |
| 3 | Materials | +29% |
| 4 | Technology | +28% |
| 5 | Industrials | +27% |
| 6 | Energy | +27% |
| 7 | Financials | +23% |
| 8 | Health Care | +21% |
| 9 | Consumer Staples | +18% |
| 10 | Utilities | +15% |
We can see in the above table that all sectors posted double-digit returns as consumer confidence and labor market conditions improved during recoveries.
3. Expansion
In this phase of the business cycle, the economy is growing beyond recovery. It is characterized by increased economic output, employment, and income.
Interestingly, market returns were the second-best overall after recoveries. Top sectors included technology (21%), financials (19%), and real estate (18%) as economic activity climbed to its peak.
| Rank | S&P 500 Sector | Average Period Return |
|---|---|---|
| 1 | Technology | +21% |
| 2 | Financials | +19% |
| 3 | Real Estate | +18% |
| 4 | Consumer Discretionary | +17% |
| 5 | Industrials | +16% |
| 6 | Energy | +16% |
| 7 | Materials | +13% |
| 8 | Consumer Staples | +11% |
| 9 | Health Care | +11% |
| 10 | Utilities | +8% |
The utilities sector has historically seen the slowest growth across all sectors as investors tend to favor cyclical S&P 500 sectors that rise with an expanding economy.
4. Slowdown
This phase is often considered a peak in the business cycle, where growth starts to decline, but the economy is not necessarily shrinking.
With 15% average returns, health care excelled during slowdowns. Often, investors reduce their exposure to cyclical sectors as they prepare for an economic downturn, looking for more defensive investments. Similarly, consumer staples saw strong performance on average.
| Rank | S&P 500 Sector | Average Period Return |
|---|---|---|
| 1 | Health Care | +15% |
| 2 | Consumer Staples | +15% |
| 3 | Financials | +14% |
| 4 | Utilities | +12% |
| 5 | Industrials | +12% |
| 6 | Technology | +10% |
| 7 | Energy | +9% |
| 8 | Materials | +7% |
| 9 | Consumer Discretionary | +6% |
| 10 | Real Estate | +2% |
Just as real estate saw a steep drop-off during recessions, it witnessed the lowest relative returns when the economy slows and costs tend to increase.
The Case for Diversification
The above data highlights how having a diversified portfolio of investments can help reduce sector-specific risk given the distinct performance trends of individual sectors over the business cycle.


Markets
The Best U.S. Companies to Work for According to LinkedIn
We visualized the results of a LinkedIn study on the best U.S. companies to work for in 2024.
The Best U.S. Companies to Work for According to LinkedIn
This was originally posted on our Voronoi app. Download the app for free on iOS or Android and discover incredible data-driven charts from a variety of trusted sources.
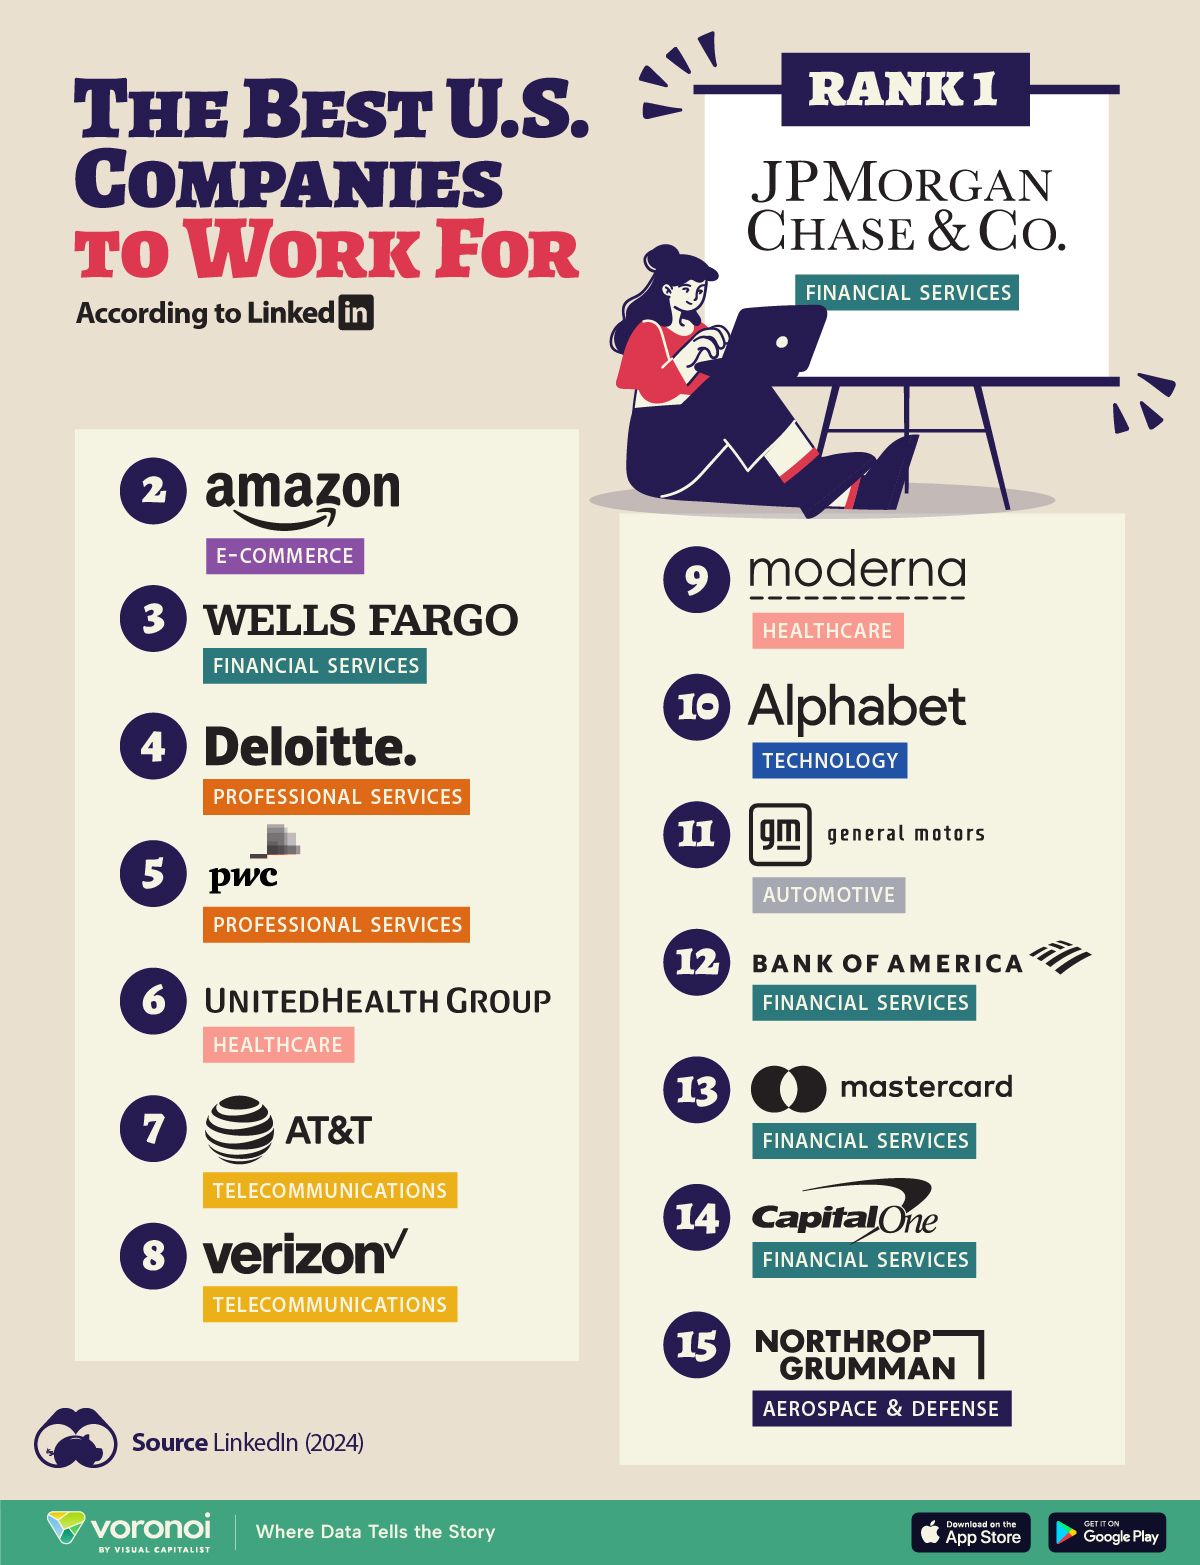
In this graphic, we list the 15 best U.S. companies to work for in 2024, according to LinkedIn data.
LinkedIn ranked companies based on eight pillars: ability to advance, skills growth, company stability, external opportunity, company affinity, gender diversity, educational background, and employee presence in the country.
To be eligible, companies must have had 5,000 or more global employees, with at least 500 in the country as of December 31, 2023.
Data and Highlights
Financial institutions dominate the ranking of the best U.S. companies to work for in 2024, with JP Morgan Chase & Co. ranking first.
| Rank | Company | Industry |
|---|---|---|
| 1 | JP Morgan Chase & Co. | Financial Services |
| 2 | Amazon | E-commerce |
| 3 | Wells Fargo | Financial Services |
| 4 | Deloitte | Professional Services |
| 5 | PwC | Professional Services |
| 6 | UnitedHealth Group | Healthcare |
| 7 | AT&T | Telecommunications |
| 8 | Verizon | Telecommunications |
| 9 | Moderna | Pharmaceuticals |
| 10 | Alphabet Inc. | Technology |
| 11 | General Motors | Automotive |
| 12 | Bank of America | Financial Services |
| 13 | Mastercard | Financial Services |
| 14 | Capital One | Financial Services |
| 15 | Northrop Grumman | Aerospace & Defense |
J.P. Morgan has a program that offers opportunities for candidates without a university degree. In fact, in 2022, 75% of job descriptions at the bank for experienced hires did not require a college degree.
Meanwhile, Deloitte and Amazon offer a variety of free training courses, including in AI.
Moderna includes in its employee package benefits to help avoid employee burnout — from subsidized commuter expenses and pop-up daycare centers, to wellness coaches.
Mastercard offers flexible work availability, with 11.5% remote and 89% hybrid options.
It’s also interesting to note that only Amazon and Alphabet made the cut from the ‘Magnificent Seven’ companies (Apple, Microsoft, Google parent Alphabet, Amazon, Nvidia, Meta Platforms, and Tesla).
See more about the best companies to work for in this infographic, which covers a separate ranking from Glassdoor.

-

 Economy7 days ago
VC+: Get Our Key Takeaways From the IMF’s World Economic Outlook
-

 Maps2 weeks ago
The Largest Earthquakes in the New York Area (1970-2024)
-

 Green2 weeks ago
Ranked: The Countries With the Most Air Pollution in 2023
-

 Green2 weeks ago
Ranking the Top 15 Countries by Carbon Tax Revenue
-

 Markets2 weeks ago
U.S. Debt Interest Payments Reach $1 Trillion
-

 Mining2 weeks ago
Gold vs. S&P 500: Which Has Grown More Over Five Years?
-

 Energy2 weeks ago
The World’s Biggest Nuclear Energy Producers
-

 Misc2 weeks ago
How Hard Is It to Get Into an Ivy League School?