Markets
Ranked: The Most Profitable U.S. Companies, by Sector
Subscribe to the Advisor Channel free mailing list for more like this
The Most Profitable U.S. Companies, by Sector
This was originally posted on Advisor Channel. Sign up to the free mailing list to get beautiful visualizations on financial markets that help advisors and their clients.
U.S. corporate profits hit record levels in 2022, even as stocks fell into a bear market and inflation reached 40-year highs.
Given these headwinds, investors are watching corporate fundamentals very closely. Corporate profit margins provide a buffer against higher borrowing costs and price pressures and for many reasons, they are a key measure of financial health.
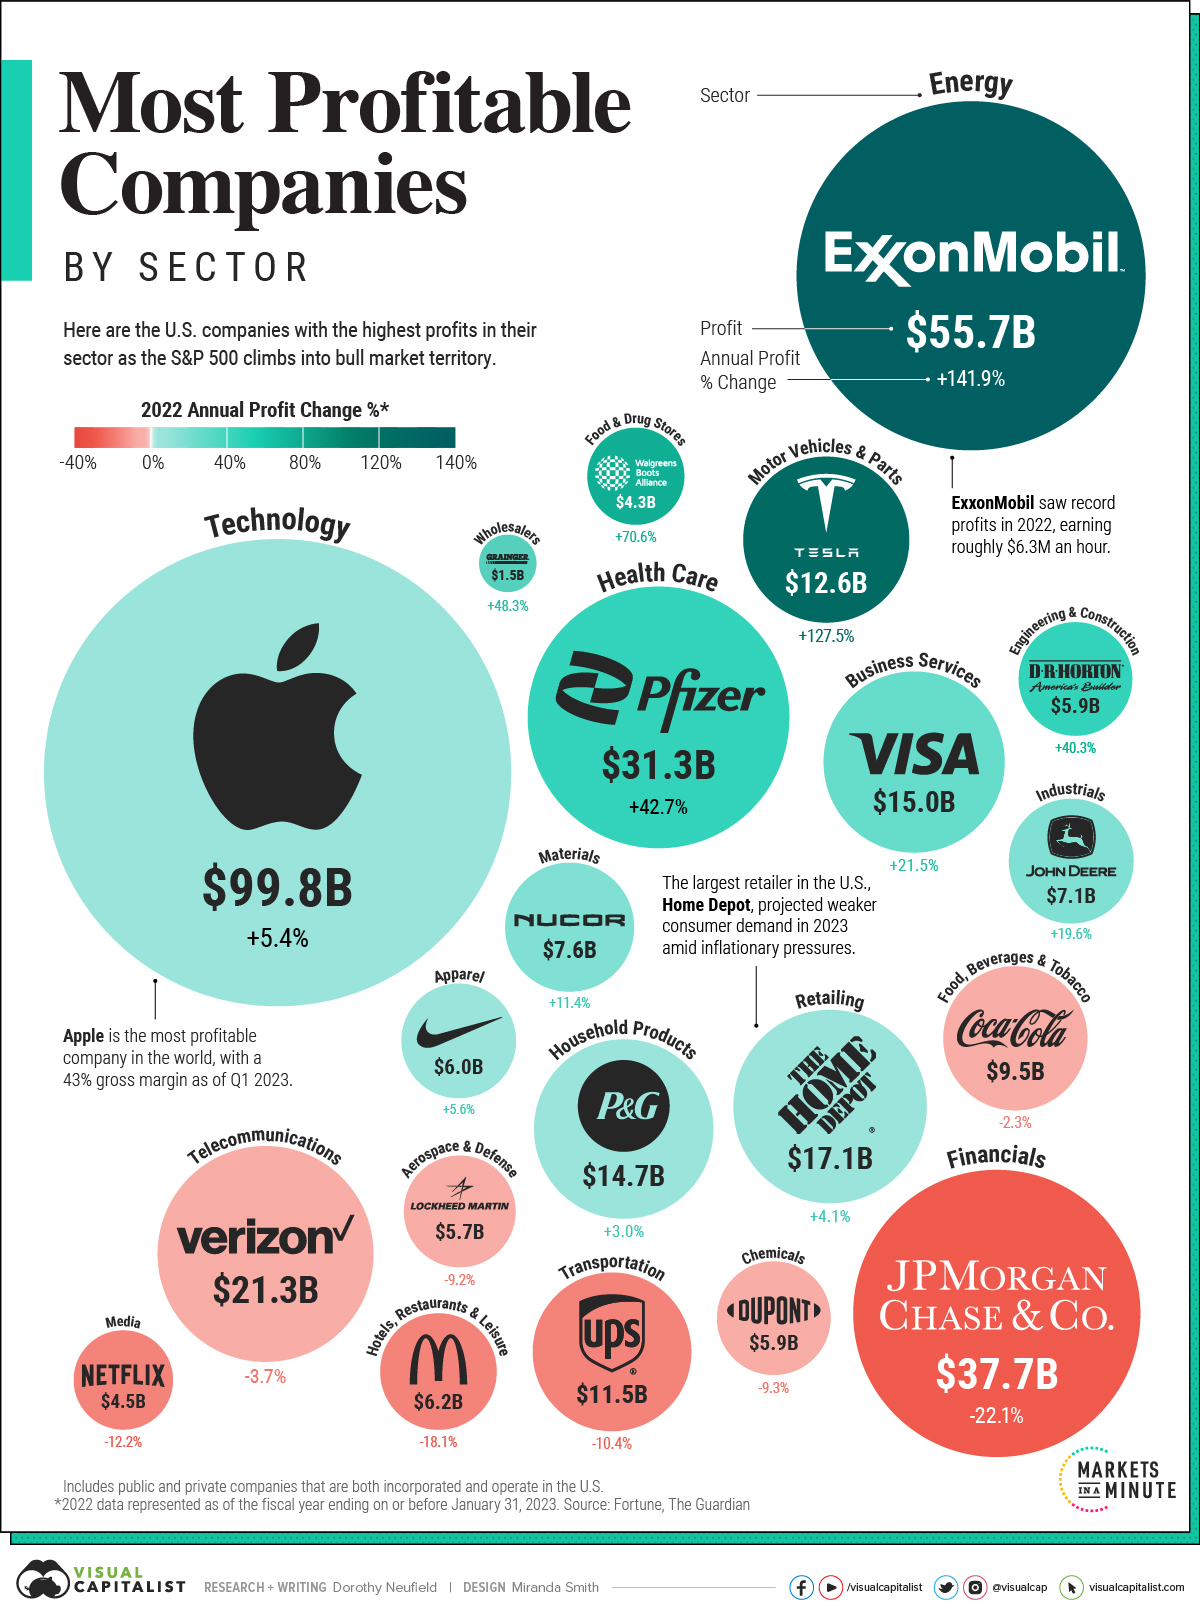
This graphic shows America’s most profitable companies by sector, using data from Fortune.
America’s Most Profitable Companies
Here are the U.S. firms with the highest annual profits in their sector. Data is based on the fiscal year ending on or before January 31, 2023 across companies in the Fortune 500.
Both public and private companies that are incorporated and operate in the U.S. are included.
| Name | Sector | 2022 Annual Profit | Annual % Change |
|---|---|---|---|
| Apple | Technology | $99.8B | 5.4% |
| Exxon Mobil | Energy | $55.7B | 141.9% |
| JPMorgan Chase | Financials | $37.7B | -22.1% |
| Pfizer | Health Care | $31.3B | 42.7% |
| Verizon Communications | Telecommunications | $21.3B | -3.7% |
| Home Depot | Retailing | $17.1B | 4.1% |
| Visa | Business Services | $15.0B | 21.5% |
| Procter & Gamble | Household Products | $14.7B | 3.0% |
| Tesla | Motor Vehicles & Parts | $12.6B | 127.5% |
| UPS | Transportation | $11.5B | -10.4% |
| Coca-Cola | Food, Beverages & Tobacco | $9.5B | -2.3% |
| Nucor | Materials | $7.6B | 11.4% |
| Deere | Industrials | $7.1B | 19.6% |
| McDonald's | Hotels, Restaurants & Leisure | $6.2B | -18.1% |
| Nike | Apparel | $6.0B | 5.6% |
| DuPont | Chemicals | $5.9B | -9.3% |
| D.R. Horton | Engineering & Construction | $5.9B | 40.3% |
| Lockheed Martin | Aerospace & Defense | $5.7B | -9.2% |
| Netflix | Media | $4.5B | -12.2% |
| Walgreens Boots Alliance | Food & Drug Stores | $4.3B | 70.6% |
| W.W. Grainger | Wholesalers | $1.5B | 48.3% |
Apple is the most profitable company in America. Reaching almost $100 billion in profits in 2022, it outpaces the profit leaders in both the energy and financials sectors combined. Furthermore, at the end of 2022, its net profit margin stood at nearly 25%.
Amid a maturing smartphone market, the company is focusing more on service-based revenue. iPhones make up roughly half of its total net sales, yet growth is plateauing. Last year, iPhone sales growth was 7%, compared to 39% the year before. Meanwhile, services sales—including cloud, AppleCare, and advertising—increased 14% annually.
Within the energy sector, Exxon Mobil took the top spot with record profits of over $55 billion. Profits jumped almost 142% last year as oil prices spiked with Russia’s invasion of Ukraine. Steep cuts in costs through the pandemic also helped to bolster the company’s returns.
JPMorgan Chase saw the highest profits in the financial sector. As the nation’s largest bank by assets, it saw a sharp decline in its investment banking division as higher interest rates made financing mergers and acquisitions less lucrative. Overall, profits sank more than 22% annually.
Corporate Profits in Perspective
Low taxes and interest rates contributed to about one-third of profit growth across nonfinancial companies in the S&P 500 over the last 20 years, a paper from the Federal Reserve shows.
Now, as interest rates climb higher, steeper costs could cut into bottom lines. The good news is so far, corporations have shown resilience to a shifting interest rate regime. In the first quarter of 2023, U.S. corporate profits fell moderately by just over 5%.
Profitability and Competitive Advantage
What does this mean for investors?
For investors looking for companies that can weather higher rates, profitability is one factor to consider. Companies with strong profitability can reinvest in their business, pay dividends, and better withstand road bumps from rising costs.
Going further, companies with high profitability often have a strong market share thanks to economies of scale lowering costs, brand loyalty driving demand, and economic moats. We can see this with Apple and Visa, for example.
Over time, this builds a sustainable competitive advantage. As companies preserve profitability, it adds value to shareholders, often supporting share prices over the longer-term.


Markets
The European Stock Market: Attractive Valuations Offer Opportunities
On average, the European stock market has valuations that are nearly 50% lower than U.S. valuations. But how can you access the market?


European Stock Market: Attractive Valuations Offer Opportunities
Europe is known for some established brands, from L’Oréal to Louis Vuitton. However, the European stock market offers additional opportunities that may be lesser known.
The above infographic, sponsored by STOXX, outlines why investors may want to consider European stocks.
Attractive Valuations
Compared to most North American and Asian markets, European stocks offer lower or comparable valuations.
| Index | Price-to-Earnings Ratio | Price-to-Book Ratio |
|---|---|---|
| EURO STOXX 50 | 14.9 | 2.2 |
| STOXX Europe 600 | 14.4 | 2 |
| U.S. | 25.9 | 4.7 |
| Canada | 16.1 | 1.8 |
| Japan | 15.4 | 1.6 |
| Asia Pacific ex. China | 17.1 | 1.8 |
Data as of February 29, 2024. See graphic for full index names. Ratios based on trailing 12 month financials. The price to earnings ratio excludes companies with negative earnings.
On average, European valuations are nearly 50% lower than U.S. valuations, potentially offering an affordable entry point for investors.
Research also shows that lower price ratios have historically led to higher long-term returns.
Market Movements Not Closely Connected
Over the last decade, the European stock market had low-to-moderate correlation with North American and Asian equities.
The below chart shows correlations from February 2014 to February 2024. A value closer to zero indicates low correlation, while a value of one would indicate that two regions are moving in perfect unison.
| EURO STOXX 50 | STOXX EUROPE 600 | U.S. | Canada | Japan | Asia Pacific ex. China |
|
|---|---|---|---|---|---|---|
| EURO STOXX 50 | 1.00 | 0.97 | 0.55 | 0.67 | 0.24 | 0.43 |
| STOXX EUROPE 600 | 1.00 | 0.56 | 0.71 | 0.28 | 0.48 | |
| U.S. | 1.00 | 0.73 | 0.12 | 0.25 | ||
| Canada | 1.00 | 0.22 | 0.40 | |||
| Japan | 1.00 | 0.88 | ||||
| Asia Pacific ex. China | 1.00 |
Data is based on daily USD returns.
European equities had relatively independent market movements from North American and Asian markets. One contributing factor could be the differing sector weights in each market. For instance, technology makes up a quarter of the U.S. market, but health care and industrials dominate the broader European market.
Ultimately, European equities can enhance portfolio diversification and have the potential to mitigate risk for investors.
Tracking the Market
For investors interested in European equities, STOXX offers a variety of flagship indices:
| Index | Description | Market Cap |
|---|---|---|
| STOXX Europe 600 | Pan-regional, broad market | €10.5T |
| STOXX Developed Europe | Pan-regional, broad-market | €9.9T |
| STOXX Europe 600 ESG-X | Pan-regional, broad market, sustainability focus | €9.7T |
| STOXX Europe 50 | Pan-regional, blue-chip | €5.1T |
| EURO STOXX 50 | Eurozone, blue-chip | €3.5T |
Data is as of February 29, 2024. Market cap is free float, which represents the shares that are readily available for public trading on stock exchanges.
The EURO STOXX 50 tracks the Eurozone’s biggest and most traded companies. It also underlies one of the world’s largest ranges of ETFs and mutual funds. As of November 2023, there were €27.3 billion in ETFs and €23.5B in mutual fund assets under management tracking the index.
“For the past 25 years, the EURO STOXX 50 has served as an accurate, reliable and tradable representation of the Eurozone equity market.”
— Axel Lomholt, General Manager at STOXX
Partnering with STOXX to Track the European Stock Market
Are you interested in European equities? STOXX can be a valuable partner:
- Comprehensive, liquid and investable ecosystem
- European heritage, global reach
- Highly sophisticated customization capabilities
- Open architecture approach to using data
- Close partnerships with clients
- Part of ISS STOXX and Deutsche Börse Group
With a full suite of indices, STOXX can help you benchmark against the European stock market.
Learn how STOXX’s European indices offer liquid and effective market access.

-

 Economy2 days ago
Economic Growth Forecasts for G7 and BRICS Countries in 2024
The IMF has released its economic growth forecasts for 2024. How do the G7 and BRICS countries compare?
-

 Markets1 week ago
U.S. Debt Interest Payments Reach $1 Trillion
U.S. debt interest payments have surged past the $1 trillion dollar mark, amid high interest rates and an ever-expanding debt burden.
-

 United States2 weeks ago
Ranked: The Largest U.S. Corporations by Number of Employees
We visualized the top U.S. companies by employees, revealing the massive scale of retailers like Walmart, Target, and Home Depot.
-

 Markets2 weeks ago
The Top 10 States by Real GDP Growth in 2023
This graphic shows the states with the highest real GDP growth rate in 2023, largely propelled by the oil and gas boom.
-

 Markets2 weeks ago
Ranked: The World’s Top Flight Routes, by Revenue
In this graphic, we show the highest earning flight routes globally as air travel continued to rebound in 2023.
-

 Markets2 weeks ago
Ranked: The Most Valuable Housing Markets in America
The U.S. residential real estate market is worth a staggering $47.5 trillion. Here are the most valuable housing markets in the country.

-

 Education1 week ago
How Hard Is It to Get Into an Ivy League School?
-

 Technology2 weeks ago
Ranked: Semiconductor Companies by Industry Revenue Share
-
Markets2 weeks ago
Ranked: The World’s Top Flight Routes, by Revenue
-

 Demographics2 weeks ago
Population Projections: The World’s 6 Largest Countries in 2075
-
Markets2 weeks ago
The Top 10 States by Real GDP Growth in 2023
-

 Demographics2 weeks ago
The Smallest Gender Wage Gaps in OECD Countries
-

 Economy2 weeks ago
Where U.S. Inflation Hit the Hardest in March 2024
-

 Environment2 weeks ago
Top Countries By Forest Growth Since 2001