Markets
The Fastest Growing and Declining Industries in the U.S. (2021-2031P)
Click to view this graphic in a higher-resolution.
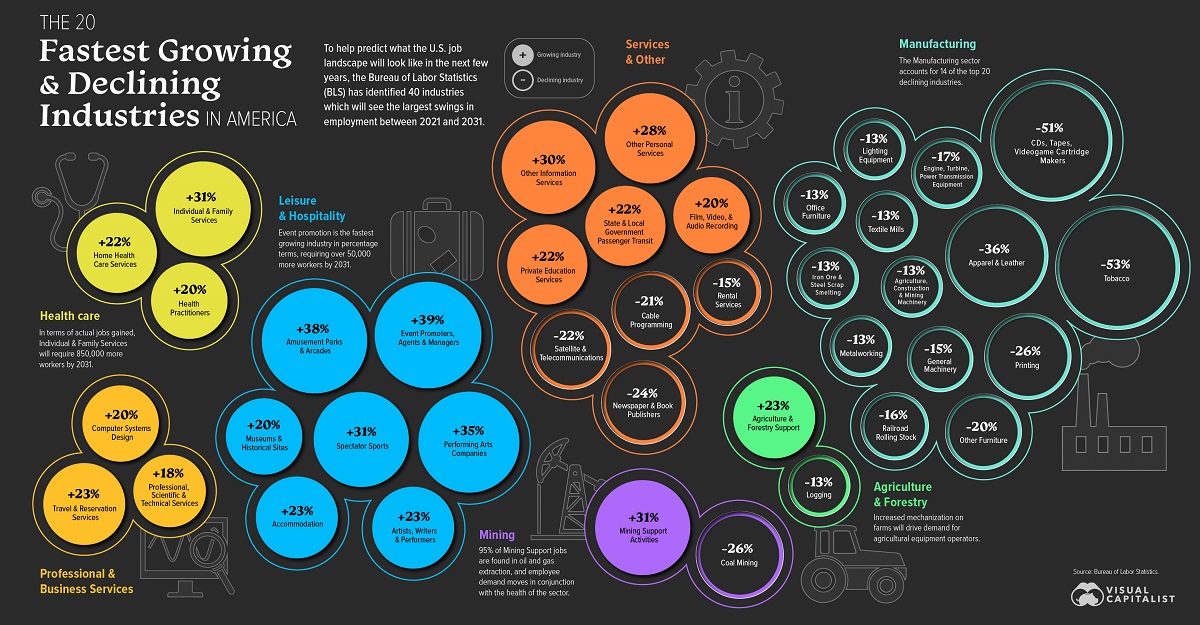


U.S. Employment Trends by Industry (2021–2031)
The labor force is always shifting, responding to technological or societal changes.
For that reason, keeping an eye on the fastest growing industries can help workers and businesses stay on top of the crucial trends driving employment.
Today, we look through projections from the U.S. Bureau of Labor Statistics (BLS) on the fastest growing industries, as well as those that are the fastest declining, by percentage employment change between 2021 and 2031.
Ranked: Fastest Growing Industries By Employment Change
Event Promoters, Agents, and Managers top the list of fastest growing industries, with an impressive predicted growth of 39%, employing over 180,000 workers by 2031.
Amusement Parks and Arcades follows close behind, with an expected 38% increase—adding over 60,000 new employees—in the same time period. Ranked third, the Performing Arts industry will start the next decade with around a 100,000-strong workforce, up 35% from 2021.
Below is the full list of BLS’ projected fastest growing industries, ranked by percent change in employment, between 2021–2031.
| Rank | Industry | Sector | Change (2021-2031) | % Change (2021-2031) |
|---|---|---|---|---|
| 1 | Event Promoters, Agents & Managers | Leisure & Hospitality | 50,800 | +39% |
| 2 | Amusement Parks & Arcades | Leisure & Hospitality | 60,500 | +38% |
| 3 | Performing Arts Companies | Leisure & Hospitality | 28,400 | +35% |
| 4 | Individual & Family services | Health Care | 850,000 | +31% |
| 5 | Mining Support Activities | Mining | 69,700 | +31% |
| 6 | Spectator Sports | Leisure & Hospitality | 36,500 | +31% |
| 7 | Other Information Services | Services & Other | 112,900 | +30% |
| 8 | Other Personal Services | Services & Other | 87,200 | +28% |
| 9 | Travel & Reservation Services | Professional & Business Services | 32,300 | +23% |
| 10 | Agriculture & Forestry Support | Agriculture & Forestry | 26,200 | +23% |
| 11 | Artists, Writers & Performers | Leisure & Hospitality | 11,500 | +23% |
| 12 | Accommodation | Leisure & Hospitality | 333,700 | +23% |
| 13 | Private Education Services | Services & Other | 169,200 | +22% |
| 14 | Government Transit | Services & Other | 61,200 | +22% |
| 15 | Home Health Care Services | Health Care | 330,100 | +22% |
| 16 | Health Practitioners | Health Care | 205,500 | +20% |
| 17 | Film, Video, & Audio Recording | Services & Other | 75,300 | +20% |
| 18 | Museums & Historical Sites | Leisure & Hospitality | 27,600 | +20% |
| 19 | Computer Systems Design | Professional & Business Services | 455,200 | +20% |
| 20 | Professional, Scientific & Technical Services | Professional & Business Services | 144,100 | +18% |
Note: Services & Other sector includes Information, Education and State & Local Government industries.
All of the top three industries belong to the Leisure and Hospitality sector, which accounts for seven of the 20 fastest growing industries. This outsized performance reflects recovery more than pure growth, as the BLS notes that the Leisure and Hospitality sector was unduly affected by the COVID-19 pandemic, giving it a lower-than-usual baseline in 2021.
Ranked fourth by employment change percentage is Individual and Family Services, though it is actually expected to see the largest growth in total employment terms, adding 850,000 new workers by the end of the decade. It is one of three industries in the Health Care and Social Assistance sector with large projected growth, thanks to an increased need for care service due to an aging American population.
Not to be missed is Computer Systems Design, projected to grow by 20% in employment thanks to growing demand for computing infrastructure and IT security. Due the industry’s sheer size in employment force with 2.3 million workers in 2021, that’s close to half a million additional workers over the next decade.
Ranked: Fastest Declining Industries By Employment Change
Tobacco Manufacturing leads the group of industries expected to register employment declines by 2031, with a projected decrease of 53% in employment, bringing its already small workforce down to only 5,000 employees by the end of the decade. This stark decline is not necessarily driven by waning smoking habits, as cigarette sales in the U.S. went up during the pandemic. Instead, further automation of the industry may replace tobacco manufacturing employees.
Another industry facing a similar situation is CDs & Tapes Manufacturing, which is expected to witness a 51% reduction in employees by 2031.
Below is the full list of BLS’ projected fastest declining industries, ranked by percent change in employment, between 2021–2031.
| Rank | Industry | Sector | Change (2021-31) | % Change (2021-2031) |
|---|---|---|---|---|
| 1 | Tobacco Manufacturing | Manufacturing | -5,700 | -53% |
| 2 | CDs & Tapes Manufacturing | Manufacturing | -5,800 | -51% |
| 3 | Apparel & Leather Manufacturing | Manufacturing | -41,800 | -36% |
| 4 | Printing | Manufacturing | -96,800 | -26% |
| 5 | Coal Mining | Mining | -9,500 | -26% |
| 6 | Newspaper & Book Publishers | Services & Other | -60,000 | -24% |
| 7 | Satellite & Telecommunications | Services & Other | -19,300 | -22% |
| 8 | Cable Programming | Services & Other | -9,700 | -21% |
| 9 | Other Furniture Manufacturing | Manufacturing | -7,600 | -20% |
| 10 | Engine & Power Transmission Equipment Manufacturing | Manufacturing | -14,800 | -17% |
| 11 | Railroad Rolling Stock Manufacturing | Manufacturing | -3,100 | -16% |
| 12 | Rental Services | Services & Other | -22,200 | -15% |
| 13 | General Machinery Manufacturing | Manufacturing | -39,800 | -15% |
| 14 | Iron Ore & Steel Scrap Smelting | Manufacturing | -10,600 | -13% |
| 15 | Lighting Equipment Manufacturing | Manufacturing | -5,600 | -13% |
| 16 | Metalworking Manufacturing | Manufacturing | -21,100 | -13% |
| 17 | Logging | Agriculture & Forestry | -6,000 | -13% |
| 18 | Textile Mills | Manufacturing | -26,100 | -13% |
| 19 | Agriculture, Construction & Mining Machinery Manufacturing | Manufacturing | -25,500 | -13% |
| 20 | Office Furniture Manufacturing | Manufacturing | -12,600 | -13% |
Most of the industries facing large total employment contraction belong to the Manufacturing sector. The troubles of American manufacturing aren’t new, but the variety of industries presented suggests a mix of factors causing slumps across the sector.
Some industries like Printing, Cable Programming, and Newspaper and Book Publishers face shifting consumption habits.
Meanwhile, others like Textiles, Apparel, and Furniture Manufacturing are expected to suffer from further automation and shifted production abroad.
Factors Shaping Future Employment Trends in the U.S.
It’s important to note that these projections by the BLS were released in September 2022. That means they do not reflect the rapid rise of generative AI like ChatGPT and how they have begun to affect the economy.
A recent Goldman Sachs report, for example, stated that AI could replace 300 million jobs—almost the size of the U.S. population—around the world in the next 10 years.
That makes it an open and important question as to whether AI or powerful demographic trends, such as slower population growth and an aging workforce, will be the most impactful in terms of determining the future employment landscape.


Markets
The European Stock Market: Attractive Valuations Offer Opportunities
On average, the European stock market has valuations that are nearly 50% lower than U.S. valuations. But how can you access the market?


European Stock Market: Attractive Valuations Offer Opportunities
Europe is known for some established brands, from L’Oréal to Louis Vuitton. However, the European stock market offers additional opportunities that may be lesser known.
The above infographic, sponsored by STOXX, outlines why investors may want to consider European stocks.
Attractive Valuations
Compared to most North American and Asian markets, European stocks offer lower or comparable valuations.
| Index | Price-to-Earnings Ratio | Price-to-Book Ratio |
|---|---|---|
| EURO STOXX 50 | 14.9 | 2.2 |
| STOXX Europe 600 | 14.4 | 2 |
| U.S. | 25.9 | 4.7 |
| Canada | 16.1 | 1.8 |
| Japan | 15.4 | 1.6 |
| Asia Pacific ex. China | 17.1 | 1.8 |
Data as of February 29, 2024. See graphic for full index names. Ratios based on trailing 12 month financials. The price to earnings ratio excludes companies with negative earnings.
On average, European valuations are nearly 50% lower than U.S. valuations, potentially offering an affordable entry point for investors.
Research also shows that lower price ratios have historically led to higher long-term returns.
Market Movements Not Closely Connected
Over the last decade, the European stock market had low-to-moderate correlation with North American and Asian equities.
The below chart shows correlations from February 2014 to February 2024. A value closer to zero indicates low correlation, while a value of one would indicate that two regions are moving in perfect unison.
| EURO STOXX 50 | STOXX EUROPE 600 | U.S. | Canada | Japan | Asia Pacific ex. China |
|
|---|---|---|---|---|---|---|
| EURO STOXX 50 | 1.00 | 0.97 | 0.55 | 0.67 | 0.24 | 0.43 |
| STOXX EUROPE 600 | 1.00 | 0.56 | 0.71 | 0.28 | 0.48 | |
| U.S. | 1.00 | 0.73 | 0.12 | 0.25 | ||
| Canada | 1.00 | 0.22 | 0.40 | |||
| Japan | 1.00 | 0.88 | ||||
| Asia Pacific ex. China | 1.00 |
Data is based on daily USD returns.
European equities had relatively independent market movements from North American and Asian markets. One contributing factor could be the differing sector weights in each market. For instance, technology makes up a quarter of the U.S. market, but health care and industrials dominate the broader European market.
Ultimately, European equities can enhance portfolio diversification and have the potential to mitigate risk for investors.
Tracking the Market
For investors interested in European equities, STOXX offers a variety of flagship indices:
| Index | Description | Market Cap |
|---|---|---|
| STOXX Europe 600 | Pan-regional, broad market | €10.5T |
| STOXX Developed Europe | Pan-regional, broad-market | €9.9T |
| STOXX Europe 600 ESG-X | Pan-regional, broad market, sustainability focus | €9.7T |
| STOXX Europe 50 | Pan-regional, blue-chip | €5.1T |
| EURO STOXX 50 | Eurozone, blue-chip | €3.5T |
Data is as of February 29, 2024. Market cap is free float, which represents the shares that are readily available for public trading on stock exchanges.
The EURO STOXX 50 tracks the Eurozone’s biggest and most traded companies. It also underlies one of the world’s largest ranges of ETFs and mutual funds. As of November 2023, there were €27.3 billion in ETFs and €23.5B in mutual fund assets under management tracking the index.
“For the past 25 years, the EURO STOXX 50 has served as an accurate, reliable and tradable representation of the Eurozone equity market.”
— Axel Lomholt, General Manager at STOXX
Partnering with STOXX to Track the European Stock Market
Are you interested in European equities? STOXX can be a valuable partner:
- Comprehensive, liquid and investable ecosystem
- European heritage, global reach
- Highly sophisticated customization capabilities
- Open architecture approach to using data
- Close partnerships with clients
- Part of ISS STOXX and Deutsche Börse Group
With a full suite of indices, STOXX can help you benchmark against the European stock market.
Learn how STOXX’s European indices offer liquid and effective market access.

-

 Economy3 days ago
Economic Growth Forecasts for G7 and BRICS Countries in 2024
The IMF has released its economic growth forecasts for 2024. How do the G7 and BRICS countries compare?
-

 Markets2 weeks ago
U.S. Debt Interest Payments Reach $1 Trillion
U.S. debt interest payments have surged past the $1 trillion dollar mark, amid high interest rates and an ever-expanding debt burden.
-

 United States2 weeks ago
Ranked: The Largest U.S. Corporations by Number of Employees
We visualized the top U.S. companies by employees, revealing the massive scale of retailers like Walmart, Target, and Home Depot.
-

 Markets2 weeks ago
The Top 10 States by Real GDP Growth in 2023
This graphic shows the states with the highest real GDP growth rate in 2023, largely propelled by the oil and gas boom.
-

 Markets3 weeks ago
Ranked: The World’s Top Flight Routes, by Revenue
In this graphic, we show the highest earning flight routes globally as air travel continued to rebound in 2023.
-

 Markets3 weeks ago
Ranked: The Most Valuable Housing Markets in America
The U.S. residential real estate market is worth a staggering $47.5 trillion. Here are the most valuable housing markets in the country.


-

 Debt1 week ago
How Debt-to-GDP Ratios Have Changed Since 2000
-

 Countries2 weeks ago
Population Projections: The World’s 6 Largest Countries in 2075
-
Markets2 weeks ago
The Top 10 States by Real GDP Growth in 2023
-

 Demographics2 weeks ago
The Smallest Gender Wage Gaps in OECD Countries
-

 United States2 weeks ago
Where U.S. Inflation Hit the Hardest in March 2024
-

 Green2 weeks ago
Top Countries By Forest Growth Since 2001
-
United States2 weeks ago
Ranked: The Largest U.S. Corporations by Number of Employees
-

 Maps2 weeks ago
The Largest Earthquakes in the New York Area (1970-2024)