Markets
Ranked: The Top 100 Brands by Value in 2023
View a higher resolution version of this graphic.
 Can I share this graphic?
 When do I need a license?
 Interested in this piece?
Ranked: The Top 100 Brands by Value in 2023
View a higher resolution version of this graphic.
Brand value can be a critical part of any company’s intangible assets.
These kind of non-physical assets, such as patents and brand names, are having an increasing influence on a company’s overall value. A 2020 analysis found that intangibles made up 90% of the S&P 500’s market value, an increase of 22 percentage points since 1995.
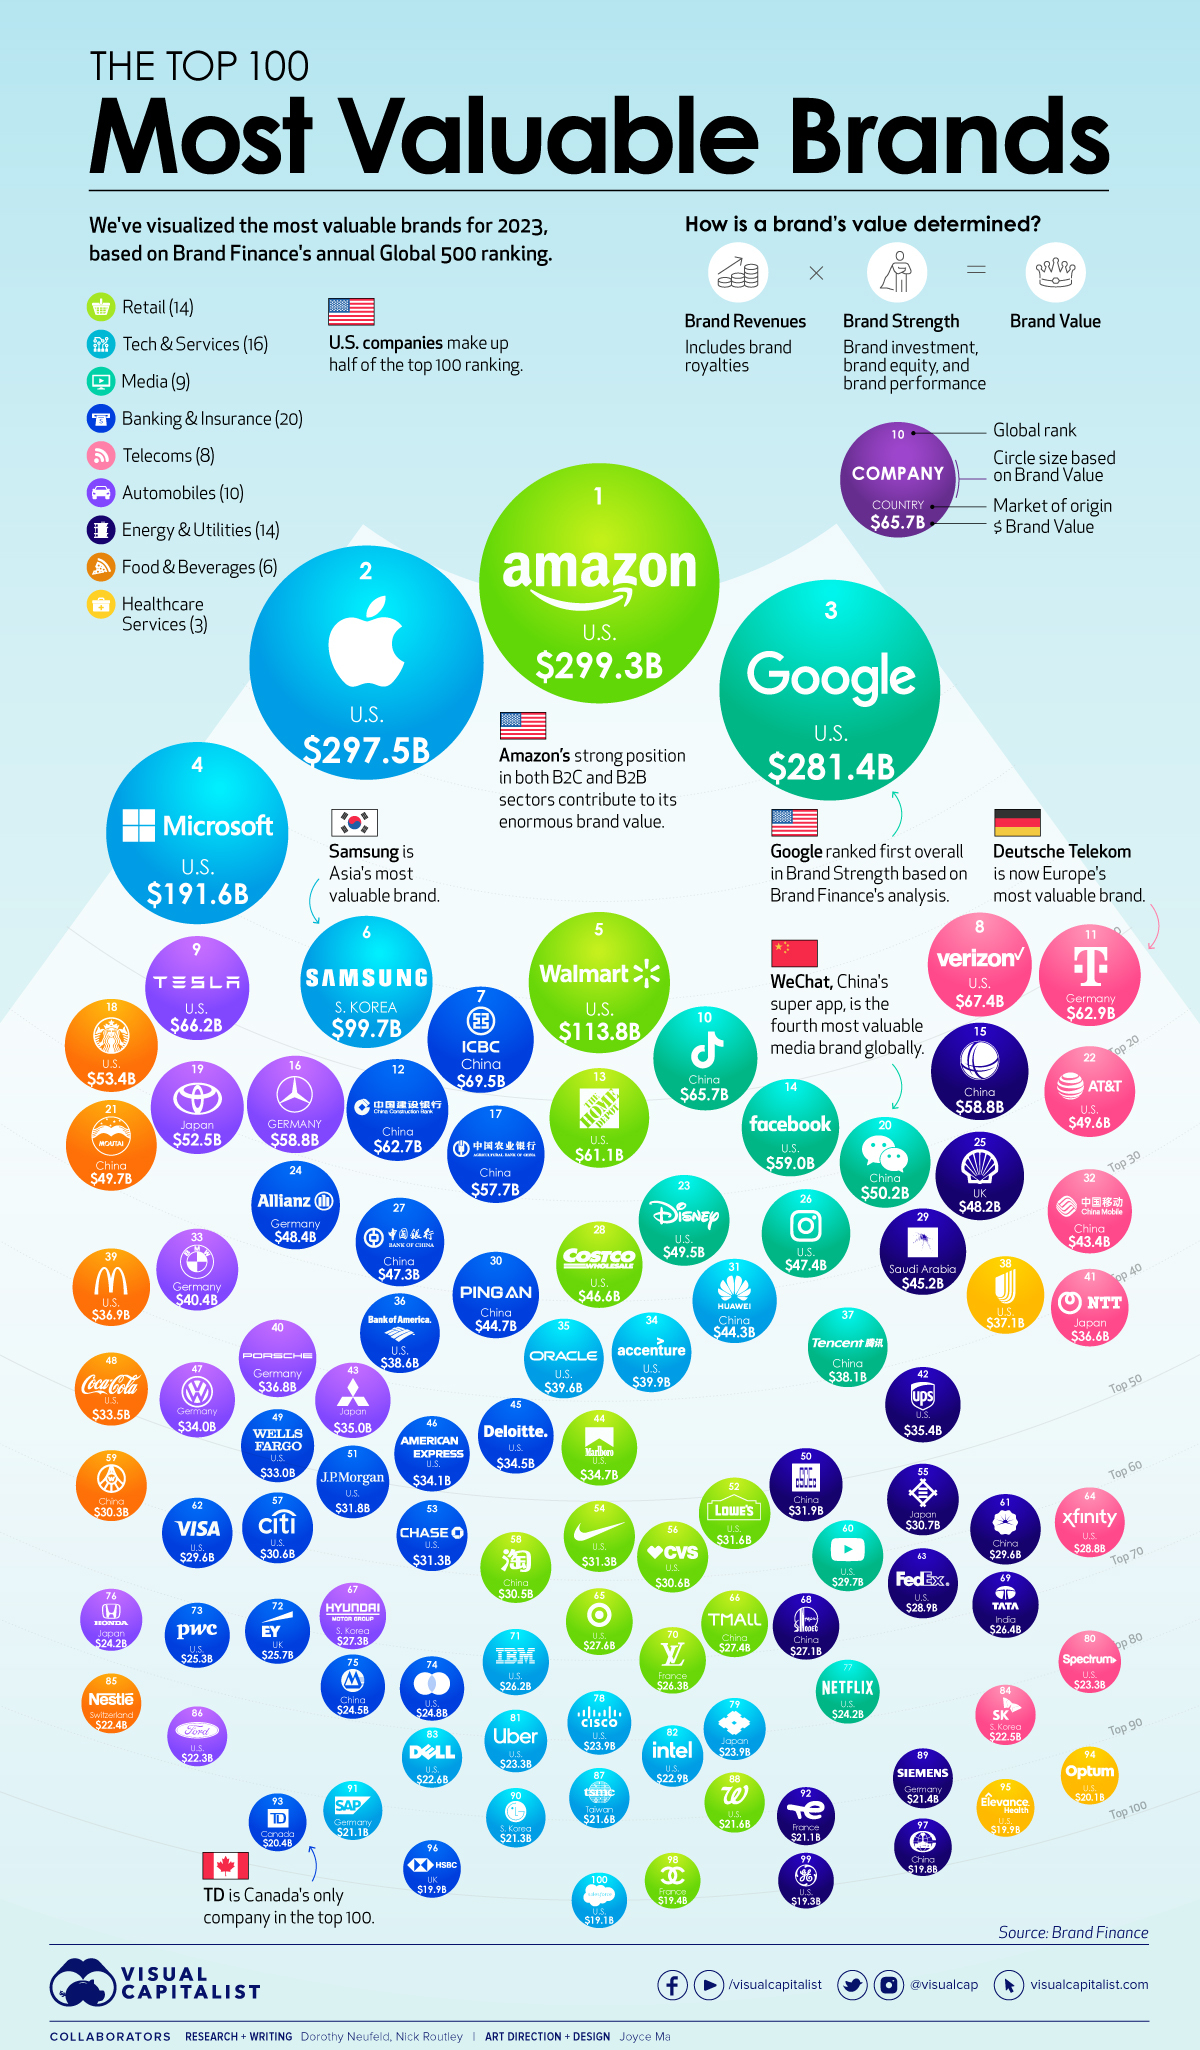
This graphic shows the world’s 100 most valuable brands in 2023 based on an annual ranking from Brand Finance, illustrating the role brand equity plays in a company’s market position.
The Top 100 Companies, by Brand Value
Brand Finance examined over 5,000 companies (and in cases of groups like Alphabet and Meta, their subsidiary brands) across 38 countries.
Broadly speaking, a brand’s value represents the allocation of company earnings that are linked to the brand. More details on the methodology are found at the end of this article.
Here are the most valuable brands in 2023:
| Rank | Brand | Brand Value (B) | Country | Sector |
|---|---|---|---|---|
| 1 | Amazon | $299.3 | U.S. | Retail |
| 2 | Apple | $297.5 | U.S. | Tech |
| 3 | $281.4 | U.S. | Media | |
| 4 | Microsoft | $191.6 | U.S. | Tech |
| 5 | Walmart | $113.8 | U.S. | Retail |
| 6 | Samsung Group | $99.7 | South Korea | Tech |
| 7 | ICBC | $69.5 | China | Banking |
| 8 | Verizon | $67.4 | U.S. | Telecoms |
| 9 | Tesla | $66.2 | U.S. | Automobiles |
| 10 | TikTok/Douyin | $65.7 | China | Media |
| 11 | Deutsche Telekom | $62.9 | Germany | Telecoms |
| 12 | China Construction Bank | $62.7 | China | Banking |
| 13 | Home Depot | $61.1 | U.S. | Retail |
| 14 | $59.0 | U.S. | Media | |
| 15 | State Grid | $58.8 | China | Utilities |
| 16 | Mercedes-Benz | $58.8 | Germany | Automobiles |
| 17 | Agricultural Bank Of China | $57.7 | China | Banking |
| 18 | Starbucks | $53.4 | U.S. | Restaurants |
| 19 | Toyota | $52.5 | Japan | Automobiles |
| 20 | $50.2 | China | Media | |
| 21 | Moutai | $49.7 | China | Spirits |
| 22 | AT&T | $49.6 | U.S. | Telecoms |
| 23 | Disney | $49.5 | U.S. | Media |
| 24 | Allianz Group | $48.4 | Germany | Insurance |
| 25 | Shell | $48.2 | UK | Oil & Gas |
| 26 | $47.4 | U.S. | Media | |
| 27 | Bank of China | $47.3 | China | Banking |
| 28 | Costco | $46.6 | U.S. | Retail |
| 29 | Aramco | $45.2 | Saudi Arabia | Oil & Gas |
| 30 | Ping An | $44.7 | China | Insurance |
| 31 | Huawei | $44.3 | China | Tech |
| 32 | China Mobile | $43.4 | China | Telecoms |
| 33 | BMW | $40.4 | Germany | Automobiles |
| 34 | accenture | $39.9 | U.S. | Tech |
| 35 | Oracle | $39.6 | U.S. | Tech |
| 36 | Bank of America | $38.6 | U.S. | Banking |
| 37 | Tencent | $38.1 | China | Media |
| 38 | UnitedHealthcare | $37.1 | U.S. | Healthcare Services |
| 39 | McDonald's | $36.9 | U.S. | Restaurants |
| 40 | Porsche | $36.8 | Germany | Automobiles |
| 41 | NTT Group | $36.6 | Japan | Telecoms |
| 42 | UPS | $35.4 | U.S. | Logistics |
| 43 | Mitsubishi Group | $35.0 | Japan | Automobiles |
| 44 | Marlboro | $34.7 | U.S. | Tobacco |
| 45 | Deloitte | $34.5 | U.S. | Commercial Services |
| 46 | American Express | $34.1 | U.S. | Commercial Services |
| 47 | Volkswagen | $34.0 | Germany | Automobiles |
| 48 | Coca-Cola | $33.5 | U.S. | Soft Drinks |
| 49 | Wells Fargo | $33.0 | U.S. | Banking |
| 50 | CSCEC | $31.9 | China | Engineering & Construction |
| 51 | J.P. Morgan | $31.8 | U.S. | Banking |
| 52 | Lowe's | $31.6 | U.S. | Retail |
| 53 | Chase | $31.3 | U.S. | Banking |
| 54 | Nike | $31.3 | U.S. | Apparel |
| 55 | Mitsui | $30.7 | Japan | Engineering & Construction |
| 56 | CVS | $30.6 | U.S. | Retail |
| 57 | Citi | $30.6 | U.S. | Banking |
| 58 | Taobao | $30.5 | China | Retail |
| 59 | Wuliangye | $30.3 | China | Spirits |
| 60 | YouTube | $29.7 | U.S. | Media |
| 61 | PetroChina | $29.6 | China | Oil & Gas |
| 62 | VISA | $29.6 | U.S. | Commercial Services |
| 63 | FedEx | $28.9 | U.S. | Logistics |
| 64 | Xfinity | $28.8 | U.S. | Telecoms |
| 65 | Target | $27.6 | U.S. | Retail |
| 66 | Tmall | $27.4 | China | Retail |
| 67 | Hyundai Group | $27.3 | South Korea | Automobiles |
| 68 | Sinopec | $27.1 | China | Oil & Gas |
| 69 | Tata Group | $26.4 | India | Engineering & Construction |
| 70 | Louis Vuitton | $26.3 | France | Apparel |
| 71 | IBM | $26.2 | U.S. | Tech |
| 72 | EY | $25.7 | UK | Commercial Services |
| 73 | PWC | $25.3 | U.S. | Commercial Services |
| 74 | Mastercard | $24.8 | U.S. | Commercial Services |
| 75 | China Merchants Bank | $24.5 | China | Banking |
| 76 | Honda | $24.2 | Japan | Automobiles |
| 77 | Netflix | $24.2 | U.S. | Media |
| 78 | Cisco | $23.9 | U.S. | Tech |
| 79 | Sumitomo Group | $23.9 | Japan | Trading Houses |
| 80 | Spectrum | $23.3 | U.S. | Telecoms |
| 81 | Uber | $23.3 | U.S. | Mobility |
| 82 | Intel | $22.9 | U.S. | Tech |
| 83 | Dell Technologies | $22.6 | U.S. | Tech |
| 84 | SK Group | $22.5 | South Korea | Telecoms |
| 85 | Nestlé | $22.4 | Switzerland | Food |
| 86 | Ford | $22.3 | U.S. | Automobiles |
| 87 | TSMC | $21.6 | Taiwan | Tech |
| 88 | Walgreens | $21.6 | U.S. | Retail |
| 89 | Siemens Group | $ 21.4 | Germany | Engineering & Construction |
| 90 | LG Group | $21.3 | South Korea | Tech |
| 91 | SAP | $21.1 | Germany | Tech |
| 92 | TotalEnergies | $20.7 | France | Oil & Gas |
| 93 | TD | $20.4 | Canada | Banking |
| 94 | Optum | $20.1 | U.S. | Healthcare Services |
| 95 | Elevance Health (formerly Anthem) | $19.9 | U.S. | Healthcare Services |
| 96 | HSBC | $19.9 | UK | Banking |
| 97 | CREC | $19.8 | China | Engineering & Construction |
| 98 | CHANEL | $19.4 | France | Apparel |
| 99 | General Electric | $19.3 | U.S. | Engineering & Construction |
| 100 | Salesforce | $19.1 | U.S. | Tech |
Amazon ranks number one globally with its brand valued at $299 billion. As a market leader in online retail, it has strong brand loyalty in its B2C segment which generates its largest share of revenue, and is a key player in cloud services for its B2B platforms.
Apple is in close second with a $298 billion brand. It’s important to note that both tech giants brands fell in value from last year, as supply chain disruptions, labor market constraints, and slower forecasted revenue impacted their brands.
Other big tech brands Google (#3) and Microsoft (#4) were next in the ranking. Korean conglomerate Samsung (#6) was the highest-ranking firm based outside of America.
Brand Value: Leading Sectors in 2023
Looking at brand value based on sector, we can see that tech continues to dominate. The sector breakdown below uses data from the top 500 brands covered by Brand Finance.
| Rank | Sector | % of Total | Total Brand Value (B) |
|---|---|---|---|
| 1 | Tech | 19.4% | $891.2 |
| 2 | Retail | 15.0% | $690.0 |
| 3 | Media | 14.0% | $645.2 |
| 4 | Banking | 10.2% | $467.4 |
| 5 | Automobiles | 8.6% | $397.3 |
| 6 | Telecoms | 7.3% | $334.6 |
| 7 | Commercial Services | 3.8% | $174.0 |
| 8 | Oil & Gas | 3.7% | $171.0 |
| 9 | Engineering & Construction | 3.3% | $149.5 |
| 10 | Insurance | 2.0% | $93.0 |
| 11 | Restaurants | 2.0% | $90.3 |
| 12 | Spirits | 1.7% | $80.0 |
| 13 | Healthcare Services | 1.7% | $77.1 |
| 14 | Apparel | 1.7% | $77.0 |
| 15 | Logistics | 1.4% | $64.3 |
| 16 | Utilities | 1.3% | $58.8 |
| 17 | Tobacco | 0.8% | $34.7 |
| 18 | Soft Drinks | 0.7% | $33.5 |
| 19 | Trading Houses | 0.5% | $23.9 |
| 20 | Mobility | 0.5% | $23.3 |
| 21 | Food | 0.5% | $22.4 |
Overall, the top tech brands were worth a combined $891 billion largely thanks to the outsized influence of Apple, Microsoft, and Samsung.
After retail and media, the banking sector still held significant brand sway at $467 billion. Automobiles rounded out the top five sectors at $397 billion, led by companies like Tesla and Mercedes-Benz.
The Fastest Rising Brands in 2023
While some brands such as Apple and Amazon fell in value over the last year, others have increased their brand value.
Below, we show the fastest rising brands across the top 500 around the world:
| Rank | Name | Brand Value % Change (2022-2023) |
|---|---|---|
| 1 | BYD | 57% |
| 2 | ConocoPhillips | 56% |
| 3 | Maersk | 53% |
| 4 | 49% | |
| 5 | Christian Dior | 46% |
| 6 | Tesla | 44% |
| 7 | ADP | 44% |
| 8 | United Airlines | 42% |
| 9 | 42% | |
| 10 | Equinor | 40% |
BYD, a leading electric vehicle (EV) firm in China, jumped the sharpest. Focused on budget EVs and backed by Warren Buffett, it has become a growing competitor to Tesla, and is the second-largest producer of lithium-ion batteries globally.
Energy firm ConocoPhillips saw the second-largest gain in brand value, driven by its focus on energy transition fuels, cutting production emissions, and lowering supply costs.
Following a series of difficult years for the airline industry, United Airline’s brand value increased 42% as travel demand accelerated.
As the economic landscape continues to shift, the value of these brands will shift as well.
Where does this data come from?
Source: Brand Finance Global 500 Report
Important note: The values shown above are brand value calculations as opposed to market capitalization. See below for more details.
How is brand value calculated? Generally speaking, the methodology for calculating “brand value” is a formula that is as follows:
Brand Strength (BSI) x Brand Royalty Rate x Brand Revenues = Brand Value
Brand Strength Index (BSI) looks at brand investment, brand equity, and brand performance. The brand royalty rate is determined based on sector. Lastly, forecast brand-specific revenues are determined based on the proportion of parent company revenues attributable to the brand in question. Brand value itself is discounted to net present value.
We recommend visiting page 83 of the report to view the full explanation of the methodology.


Markets
The European Stock Market: Attractive Valuations Offer Opportunities
On average, the European stock market has valuations that are nearly 50% lower than U.S. valuations. But how can you access the market?


European Stock Market: Attractive Valuations Offer Opportunities
Europe is known for some established brands, from L’Oréal to Louis Vuitton. However, the European stock market offers additional opportunities that may be lesser known.
The above infographic, sponsored by STOXX, outlines why investors may want to consider European stocks.
Attractive Valuations
Compared to most North American and Asian markets, European stocks offer lower or comparable valuations.
| Index | Price-to-Earnings Ratio | Price-to-Book Ratio |
|---|---|---|
| EURO STOXX 50 | 14.9 | 2.2 |
| STOXX Europe 600 | 14.4 | 2 |
| U.S. | 25.9 | 4.7 |
| Canada | 16.1 | 1.8 |
| Japan | 15.4 | 1.6 |
| Asia Pacific ex. China | 17.1 | 1.8 |
Data as of February 29, 2024. See graphic for full index names. Ratios based on trailing 12 month financials. The price to earnings ratio excludes companies with negative earnings.
On average, European valuations are nearly 50% lower than U.S. valuations, potentially offering an affordable entry point for investors.
Research also shows that lower price ratios have historically led to higher long-term returns.
Market Movements Not Closely Connected
Over the last decade, the European stock market had low-to-moderate correlation with North American and Asian equities.
The below chart shows correlations from February 2014 to February 2024. A value closer to zero indicates low correlation, while a value of one would indicate that two regions are moving in perfect unison.
| EURO STOXX 50 | STOXX EUROPE 600 | U.S. | Canada | Japan | Asia Pacific ex. China |
|
|---|---|---|---|---|---|---|
| EURO STOXX 50 | 1.00 | 0.97 | 0.55 | 0.67 | 0.24 | 0.43 |
| STOXX EUROPE 600 | 1.00 | 0.56 | 0.71 | 0.28 | 0.48 | |
| U.S. | 1.00 | 0.73 | 0.12 | 0.25 | ||
| Canada | 1.00 | 0.22 | 0.40 | |||
| Japan | 1.00 | 0.88 | ||||
| Asia Pacific ex. China | 1.00 |
Data is based on daily USD returns.
European equities had relatively independent market movements from North American and Asian markets. One contributing factor could be the differing sector weights in each market. For instance, technology makes up a quarter of the U.S. market, but health care and industrials dominate the broader European market.
Ultimately, European equities can enhance portfolio diversification and have the potential to mitigate risk for investors.
Tracking the Market
For investors interested in European equities, STOXX offers a variety of flagship indices:
| Index | Description | Market Cap |
|---|---|---|
| STOXX Europe 600 | Pan-regional, broad market | €10.5T |
| STOXX Developed Europe | Pan-regional, broad-market | €9.9T |
| STOXX Europe 600 ESG-X | Pan-regional, broad market, sustainability focus | €9.7T |
| STOXX Europe 50 | Pan-regional, blue-chip | €5.1T |
| EURO STOXX 50 | Eurozone, blue-chip | €3.5T |
Data is as of February 29, 2024. Market cap is free float, which represents the shares that are readily available for public trading on stock exchanges.
The EURO STOXX 50 tracks the Eurozone’s biggest and most traded companies. It also underlies one of the world’s largest ranges of ETFs and mutual funds. As of November 2023, there were €27.3 billion in ETFs and €23.5B in mutual fund assets under management tracking the index.
“For the past 25 years, the EURO STOXX 50 has served as an accurate, reliable and tradable representation of the Eurozone equity market.”
— Axel Lomholt, General Manager at STOXX
Partnering with STOXX to Track the European Stock Market
Are you interested in European equities? STOXX can be a valuable partner:
- Comprehensive, liquid and investable ecosystem
- European heritage, global reach
- Highly sophisticated customization capabilities
- Open architecture approach to using data
- Close partnerships with clients
- Part of ISS STOXX and Deutsche Börse Group
With a full suite of indices, STOXX can help you benchmark against the European stock market.
Learn how STOXX’s European indices offer liquid and effective market access.

-

 Economy3 days ago
Economic Growth Forecasts for G7 and BRICS Countries in 2024
The IMF has released its economic growth forecasts for 2024. How do the G7 and BRICS countries compare?
-

 Markets2 weeks ago
U.S. Debt Interest Payments Reach $1 Trillion
U.S. debt interest payments have surged past the $1 trillion dollar mark, amid high interest rates and an ever-expanding debt burden.
-

 United States2 weeks ago
Ranked: The Largest U.S. Corporations by Number of Employees
We visualized the top U.S. companies by employees, revealing the massive scale of retailers like Walmart, Target, and Home Depot.
-

 Markets2 weeks ago
The Top 10 States by Real GDP Growth in 2023
This graphic shows the states with the highest real GDP growth rate in 2023, largely propelled by the oil and gas boom.
-

 Markets3 weeks ago
Ranked: The World’s Top Flight Routes, by Revenue
In this graphic, we show the highest earning flight routes globally as air travel continued to rebound in 2023.
-

 Markets3 weeks ago
Ranked: The Most Valuable Housing Markets in America
The U.S. residential real estate market is worth a staggering $47.5 trillion. Here are the most valuable housing markets in the country.

-

 Debt1 week ago
How Debt-to-GDP Ratios Have Changed Since 2000
-

 Countries2 weeks ago
Population Projections: The World’s 6 Largest Countries in 2075
-
Markets2 weeks ago
The Top 10 States by Real GDP Growth in 2023
-

 Demographics2 weeks ago
The Smallest Gender Wage Gaps in OECD Countries
-

 United States2 weeks ago
Where U.S. Inflation Hit the Hardest in March 2024
-

 Green2 weeks ago
Top Countries By Forest Growth Since 2001
-
United States2 weeks ago
Ranked: The Largest U.S. Corporations by Number of Employees
-

 Maps2 weeks ago
The Largest Earthquakes in the New York Area (1970-2024)