Brands
Ranked: Top 10 Most Valuable Airline Brands Since 2013
Article/Editing:
Click to view this graphic in a higher-resolution.
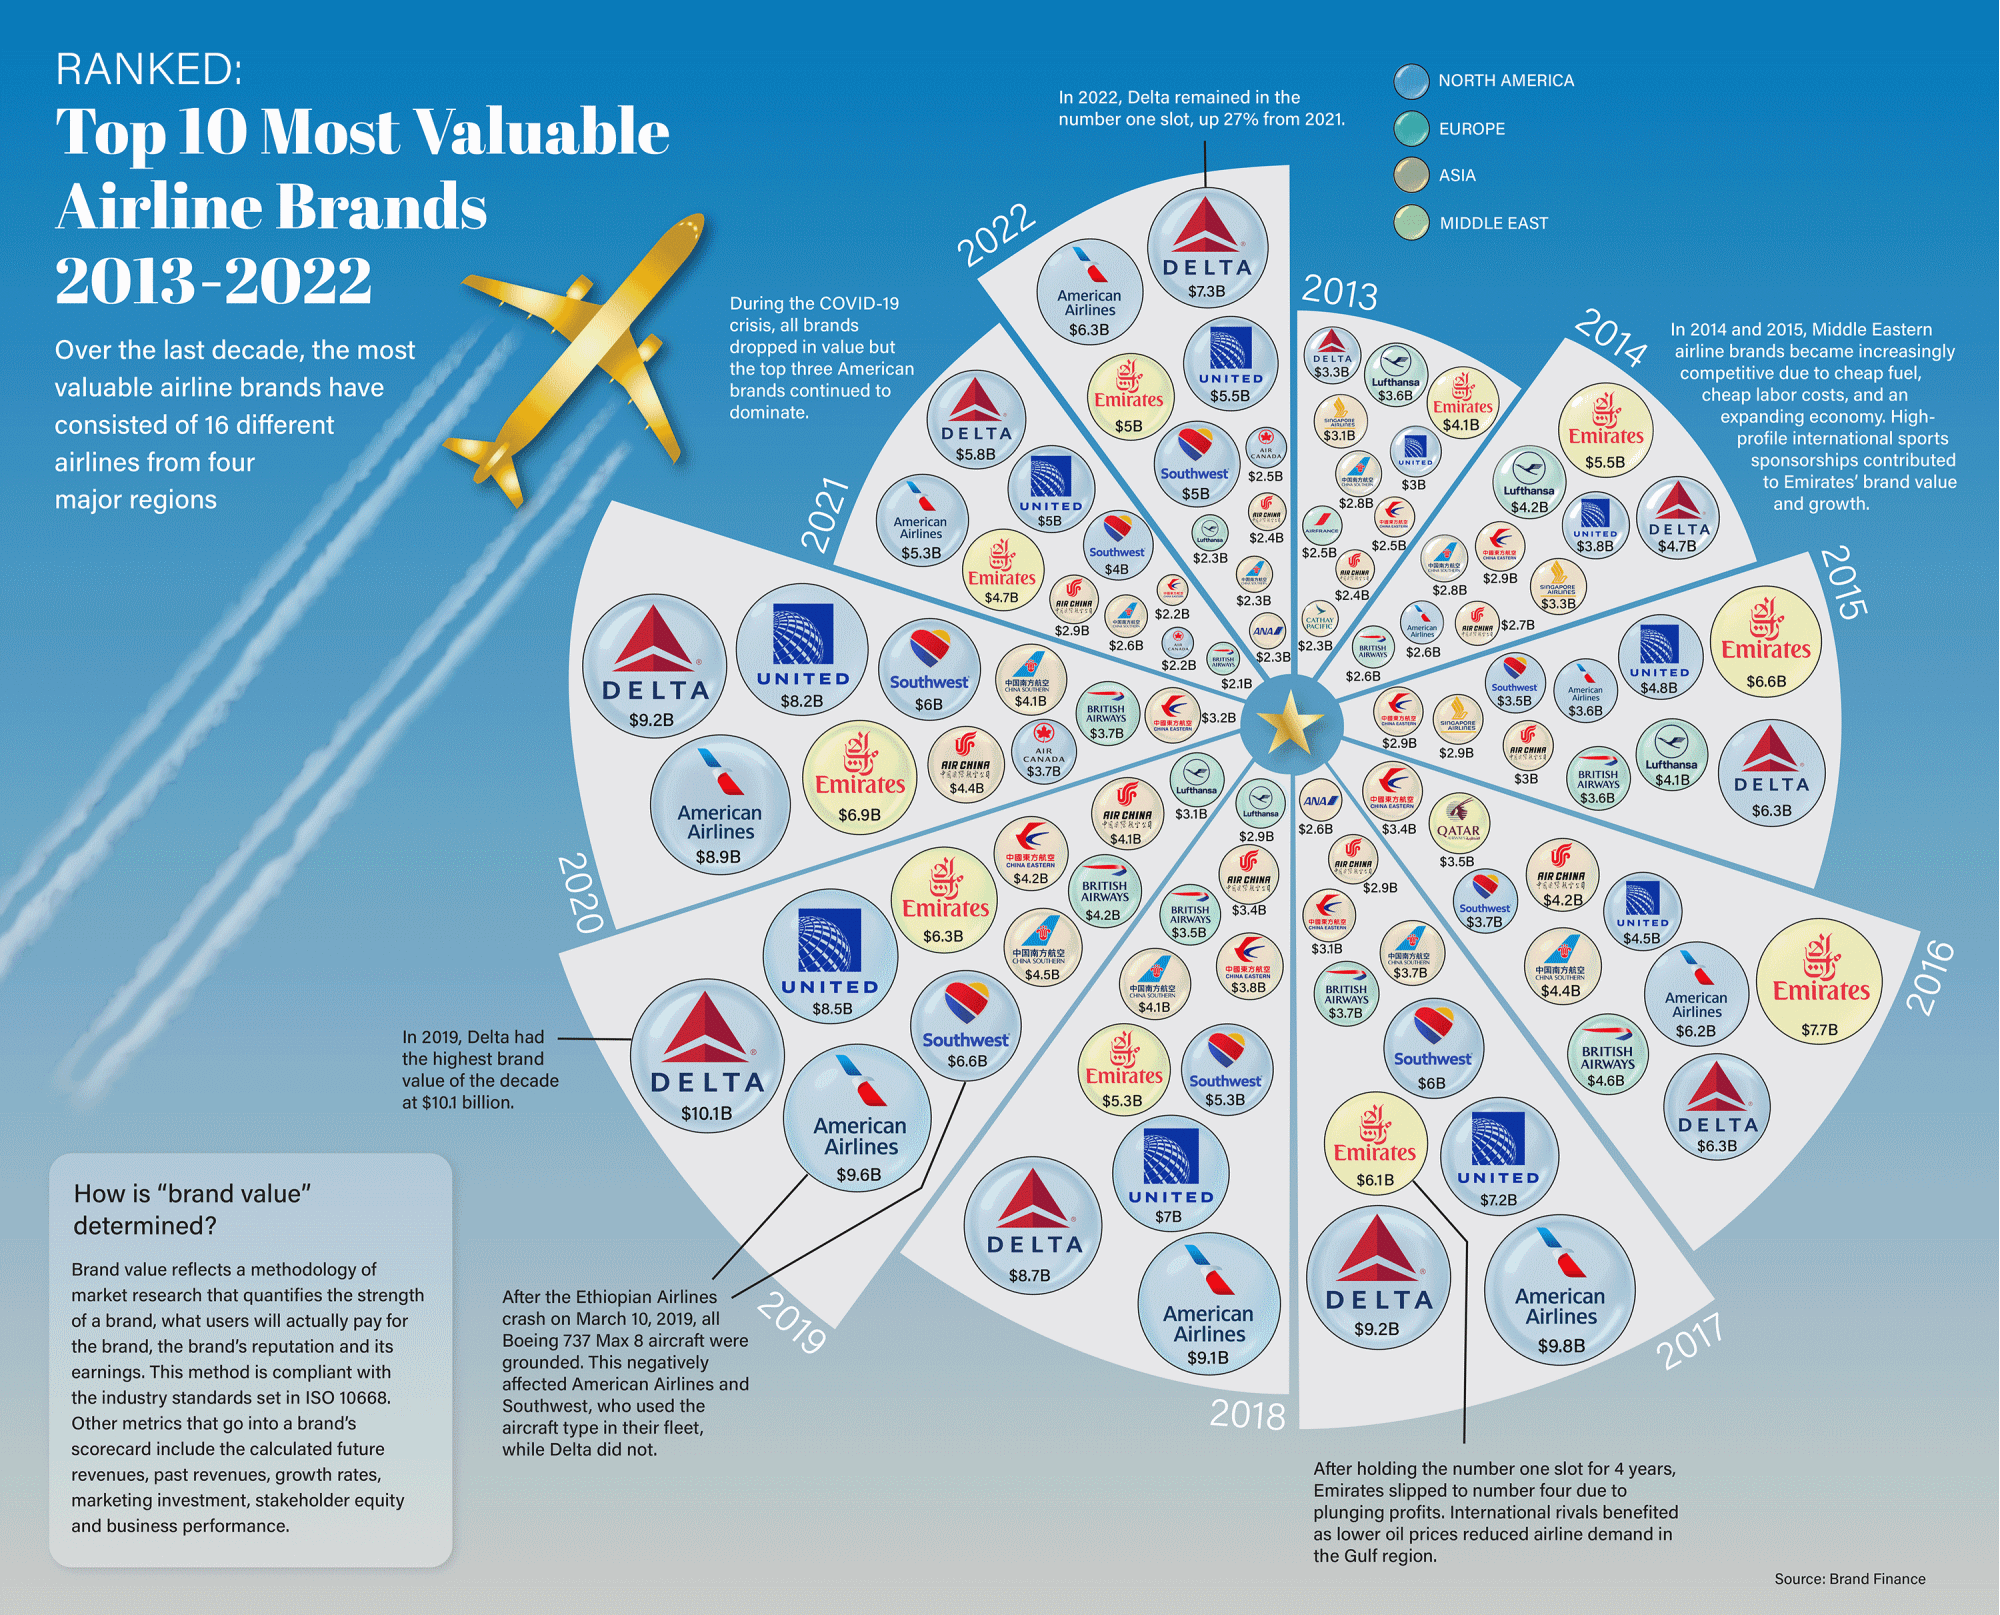
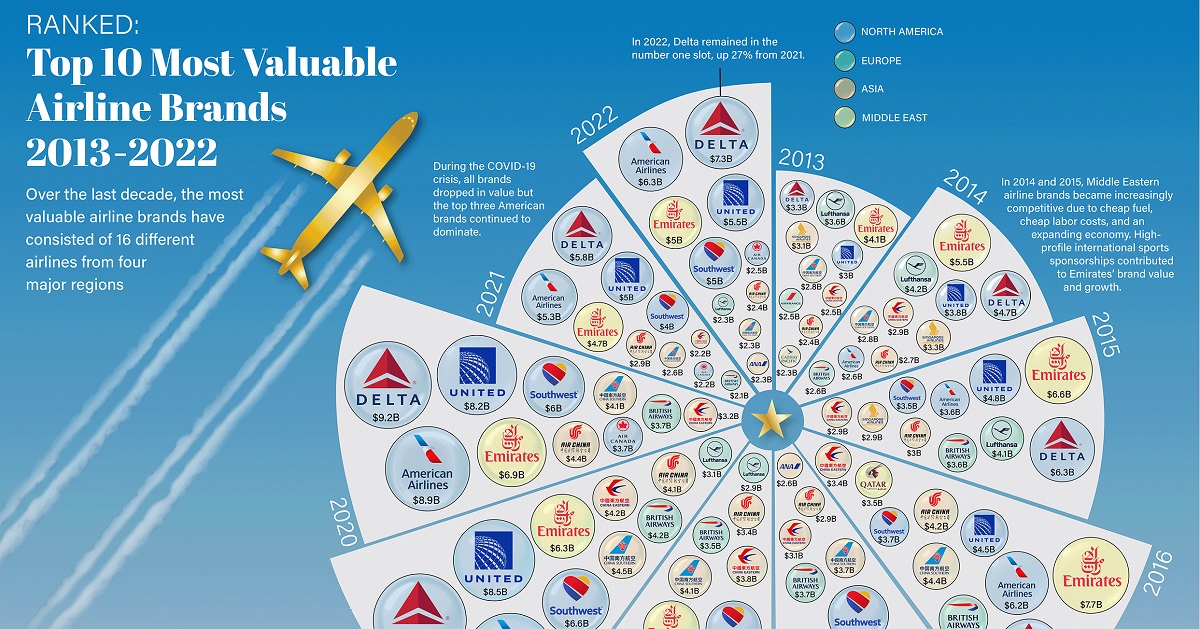
Top 10 Most Valuable Airline Brands Since 2013
The global airline industry was experiencing strong growth before the pandemic wiped out years of momentum.
Global travel went from 1.9 billion scheduled passengers per year in 2004 to 4.7 billion in 2019, before dropping back down to 1.8 billion in 2020. And while the recovery story has begun, the values of the top airline brands have been significantly impacted.
This graphic from Julie R. Peasley shows the most valuable airline brands from 2013 to 2022, using data from Brand Finance. Each airline brand is also categorized by home continent.
Most Valuable Airlines From 2013‒2022
After two back-to-back years of suffered declines, brand values for the top airlines changed course and rose in 2022.
American companies have long dominated the airline space when categorized by brand value. American Airlines, Delta, United, and Southwest have represented four of the top five since 2017, with their brands worth a collective value of $24.1 billion in 2022.
| Company | Brand Value ($B) | Region |
|---|---|---|
| Delta | $7.3 | North America |
| American Airlines | $6.3 | North America |
| United Airlines | $5.5 | North America |
| Emirates | $5.0 | Middle East |
| Southwest Airlines | $5.0 | North America |
| Air Canada | $2.5 | North America |
| Air China | $2.4 | Asia |
| Lufthansa | $2.3 | Europe |
| China southern | $2.3 | Asia |
| ANA | $2.3 | Asia |
First-place Delta in particular has remained in either the top spot or second place since 2014. On the other hand, second-place American Airlines was not even in the top 10 in 2013, but rapidly climbed past companies like United, Lufthansa, and British Airways.
Emirates is also a serious competitor and has won numerous awards for customer service. The UAE-based airliner even held the most valuable title for four consecutive years from 2013 to 2016.
Will Airline Brands Recover?
While views amongst some airline executives are a lot more optimistic now, it’s fair to say the pandemic resulted in some considerable industry turmoil.
After all, in 2020 industry revenues declined by 54% from $838 billion in 2019.
As a result, you’ll notice each brand is below their historic high values. But as travel is projected to make a full comeback, recovery and higher brand values might be on the horizon.

This article was published as a part of Visual Capitalist's Creator Program, which features data-driven visuals from some of our favorite Creators around the world.


Markets
Swiss Watches: Market Share by Brand in 2023
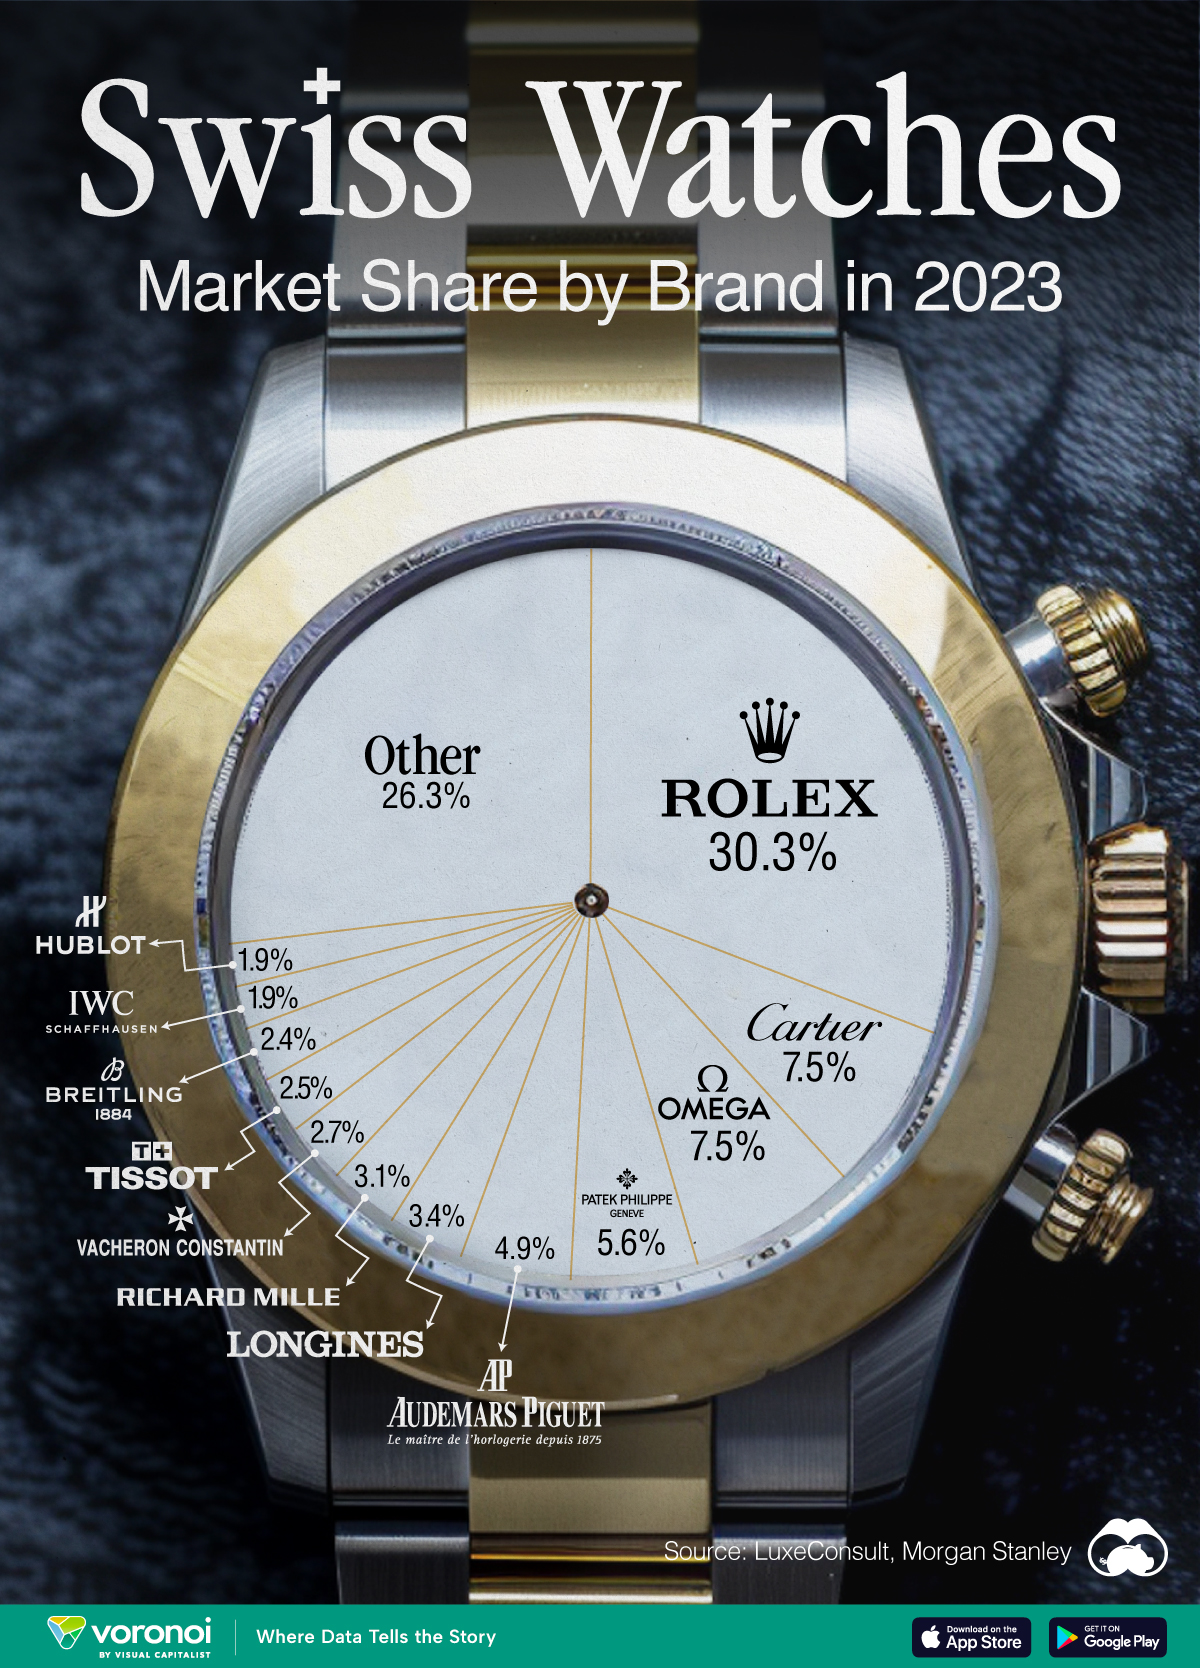
In this graphic we rank the top Swiss watch brands, based on their estimated 2023 market share.
Swiss Watches: Market Share by Brand in 2023
This was originally posted on our Voronoi app. Download the app for free on iOS or Android and discover incredible data-driven charts from a variety of trusted sources.
Swiss watches are renowned for their precision, craftsmanship, and quality. In this visualization, we rank the top Swiss watch brands based on their estimated 2023 market share, which comes from data provided by LuxeConsult and Morgan Stanley.
Rolex Dominates the Swiss Watch Market
Sales of Rolex watches are believed to have surpassed 10 billion Swiss francs ($11.2 billion) for the first time in 2023, significantly outpacing rivals like Cartier CHF 3.1 billion ($3.5 billion) and Omega CHF 2.6 billion ($2.9 billion).
Additionally, Rolex has strengthened its dominant position in the market, capturing a remarkable 30.3% retail market share.
| Brand | Market Share (%) |
|---|---|
| Rolex | 30.3 |
| Cartier | 7.5 |
| Omega | 7.5 |
| Patek Philippe | 5.6 |
| Audemars Piguet | 4.9 |
| Longines | 3.4 |
| Richard Mille | 3.1 |
| Vacheron Constantin | 2.7 |
| Tissot | 2.5 |
| Breitling | 2.4 |
| IWC | 1.9 |
| Hublot | 1.9 |
| Jaeger-LeCoultre | 1.7 |
| TAG Heur | 1.7 |
| Other | 22.9 |
In 2023, the Swiss watch industry achieved record sales totaling CHF 26.7 billion ($30 billion). The “Big Four” watch brands—Rolex, Patek Philippe, Audemars Piguet, and Richard Mille—achieved a combined 43.9% market share last year, compared to a pre-Covid 2019 market share of 36.9%.
Also noteworthy is that Vacheron Constantin joined the billionaires’ club as the 8th brand to surpass CHF 1 billion in sales, reaching CHF 1.097 billion ($1.23 billion).
In conclusion, premium watches priced over CHF 25,000 ($28,000) drove 69% of the market’s growth in 2023, and constituted 44% of the total value of Swiss watch exports. Despite this significant value contribution, this segment represents only 2.5% of the total volume in terms of units sold.
See Related Infographics
If you enjoyed this content, check out The World’s Biggest Fashion Companies by Market Cap, or Ranked: Gen Z’s Favorite Brands in 2023.

-

 Maps2 weeks ago
Mapped: Average Wages Across Europe
-

 Money1 week ago
Which States Have the Highest Minimum Wage in America?
-

 Real Estate1 week ago
Ranked: The Most Valuable Housing Markets in America
-

 Markets1 week ago
Charted: Big Four Market Share by S&P 500 Audits
-

 AI1 week ago
The Stock Performance of U.S. Chipmakers So Far in 2024
-

 Automotive2 weeks ago
Almost Every EV Stock is Down After Q1 2024
-

 Money2 weeks ago
Where Does One U.S. Tax Dollar Go?
-

 Green2 weeks ago
Ranked: Top Countries by Total Forest Loss Since 2001