Datastream
The Soaring Value of Intangible Assets in the S&P 500
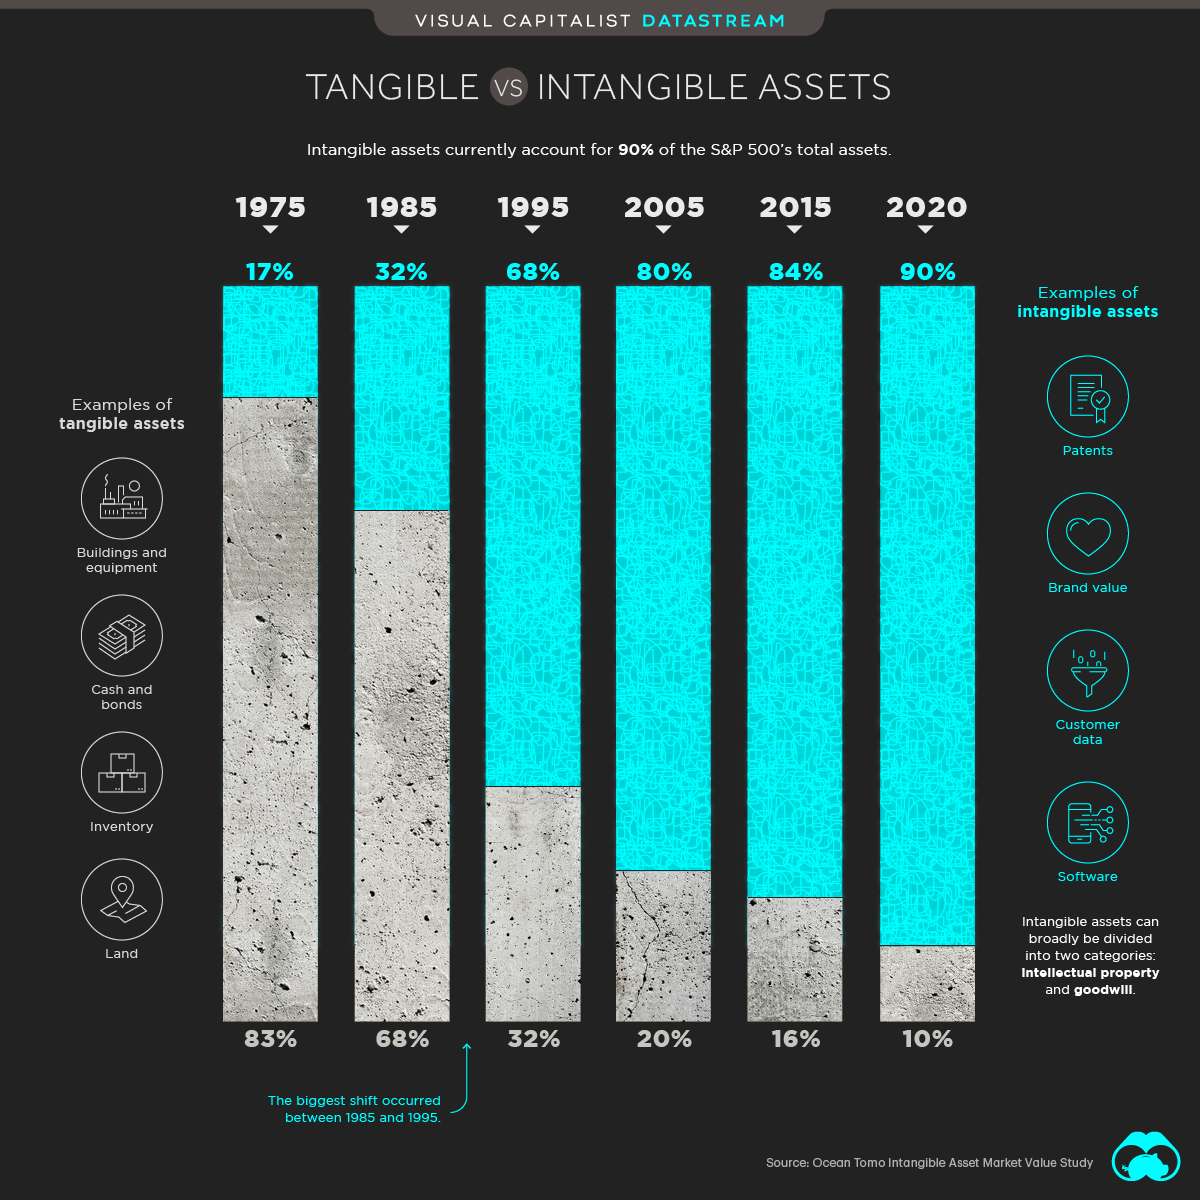


The Briefing
- Intangibles as a portion of total assets in the S&P 500 have reached unprecedented levels.
- As of 2020, 90% of all assets in the S&P 500 are now intangible.
The Soaring Value of Intangible Assets in the S&P 500
When it comes to the S&P 500’s market value, abstract is in.
Intangible assets currently account for 90% of the index’s total assets. Not only is this a historical high—it’s a nod to just how prevalent technology has become in our lives.
Intangible assets are holdings that don’t carry any physical or financial embodiment. This includes R&D, intellectual property, and computerized information such as data and software. While they’re often difficult to value due to certain accounting practices, today, intangibles are worth over $21 trillion.
| Year | Value of Intangibles in S&P 500 |
|---|---|
| 1975 | $122 Billion |
| 1985 | $428 Billion |
| 1995 | $3.12 Trillion |
| 2005 | $9.28 Trillion |
| 2018 | $21.03 Trillion |
The value of intangible assets in dollar terms has risen from $122 billion in 1975, eventually soaring past the $1 trillion mark in the coming decades.
The 1990s ushered society into an era of tech, where intangible assets first began to take majority status. The timeline was hardly linear and smooth transition, and some serious bumps took place along the way including two market crashes in 2000 and 2008.
There are reasons to suggest that influence of tech and thus intangible assets has more steam in its engine. The looming 5G revolution, more internet users on the horizon, and the powerful potential of new technologies are all supporting considerations.
Where does this data come from?
Source: Ocean Tomo Intellectual Capital Equity and IP CloseUp.
Notes: Certain accounting practices can lead to difficulties in valuing an intangible asset and at times must be estimated based on transactions or the difference between company book and market value.


Datastream
Can You Calculate Your Daily Carbon Footprint?
Discover how the average person’s carbon footprint impacts the environment and learn how carbon credits can offset your carbon footprint.


The Briefing
- A person’s carbon footprint is substantial, with activities such as food consumption creating as much as 4,500 g of CO₂ emissions daily.
- By purchasing carbon credits from Carbon Streaming Corporation, you can offset your own emissions and fund positive climate action.
Your Everyday Carbon Footprint
While many large businesses and countries have committed to net-zero goals, it is essential to acknowledge that your everyday activities also contribute to global emissions.
In this graphic, sponsored by Carbon Streaming Corporation, we will explore how the choices we make and the products we use have a profound impact on our carbon footprint.
Carbon Emissions by Activity
Here are some of the daily activities and products of the average person and their carbon footprint, according to Clever Carbon.
| Household Activities & Products | CO2 Emissions (g) |
|---|---|
| 💡 Standard Light Bulb (100 watts, four hours) | 172 g |
| 📱 Mobile Phone Use (195 minutes per day)* | 189 g |
| 👕 Washing Machine (0.63 kWh) | 275 g |
| 🔥 Electric Oven (1.56 kWh) | 675 g |
| ♨️ Tumble Dryer (2.5 kWh) | 1,000 g |
| 🧻 Toilet Roll (2 ply) | 1,300 g |
| 🚿 Hot Shower (10 mins) | 2,000 g |
| 🚙 Daily Commute (one hour, by car) | 3,360 g |
| 🍽️ Average Daily Food Consumption (three meals of 600 calories) | 4,500 g |
| *Phone use based on yearly use of 69kg per the source, Reboxed | |
Your choice of transportation plays a crucial role in determining your carbon footprint. For instance, a 15 km daily commute to work on public transport generates an average of 1,464 g of CO₂ emissions. Compared to 3,360 g—twice the volume for a journey the same length by car.
By opting for more sustainable modes of transport, such as cycling, walking, or public transportation, you can significantly reduce your carbon footprint.
Addressing Your Carbon Footprint
One way to compensate for your emissions is by purchasing high-quality carbon credits.
Carbon credits are used to help fund projects that avoid, reduce or remove CO₂ emissions. This includes nature-based solutions such as reforestation and improved forest management, or technology-based solutions such as the production of biochar and carbon capture and storage (CCS).
While carbon credits offer a potential solution for individuals to help reduce global emissions, public awareness remains a significant challenge. A BCG-Patch survey revealed that only 34% of U.S. consumers are familiar with carbon credits, and only 3% have purchased them in the past.
About Carbon Streaming
By financing the creation or expansion of carbon projects, Carbon Streaming Corporation secures the rights to future carbon credits generated by these sustainable projects. You can then purchase these carbon credits to help fund climate solutions around the world and compensate for your own emissions.
Ready to get involved?
>> Learn more about purchasing carbon credits at Carbon Streaming

-

 Markets1 week ago
U.S. Debt Interest Payments Reach $1 Trillion
-

 Markets2 weeks ago
Ranked: The Most Valuable Housing Markets in America
-

 Money2 weeks ago
Which States Have the Highest Minimum Wage in America?
-

 AI2 weeks ago
Ranked: Semiconductor Companies by Industry Revenue Share
-

 Markets2 weeks ago
Ranked: The World’s Top Flight Routes, by Revenue
-

 Countries2 weeks ago
Population Projections: The World’s 6 Largest Countries in 2075
-

 Markets2 weeks ago
The Top 10 States by Real GDP Growth in 2023
-

 Money2 weeks ago
The Smallest Gender Wage Gaps in OECD Countries