Markets
The Top 100 Most Valuable Brands in 2022
View a higher resolution version of this graphic.


The Top 100 Most Valuable Brands in 2022
View a higher resolution version of this graphic.
Given the elusive nature of brands, determining a brand’s financial value is a difficult task.
Despite a brand’s intangibility, it’s hard to deny just how effective a strong one can be at boosting a company’s bottom line.
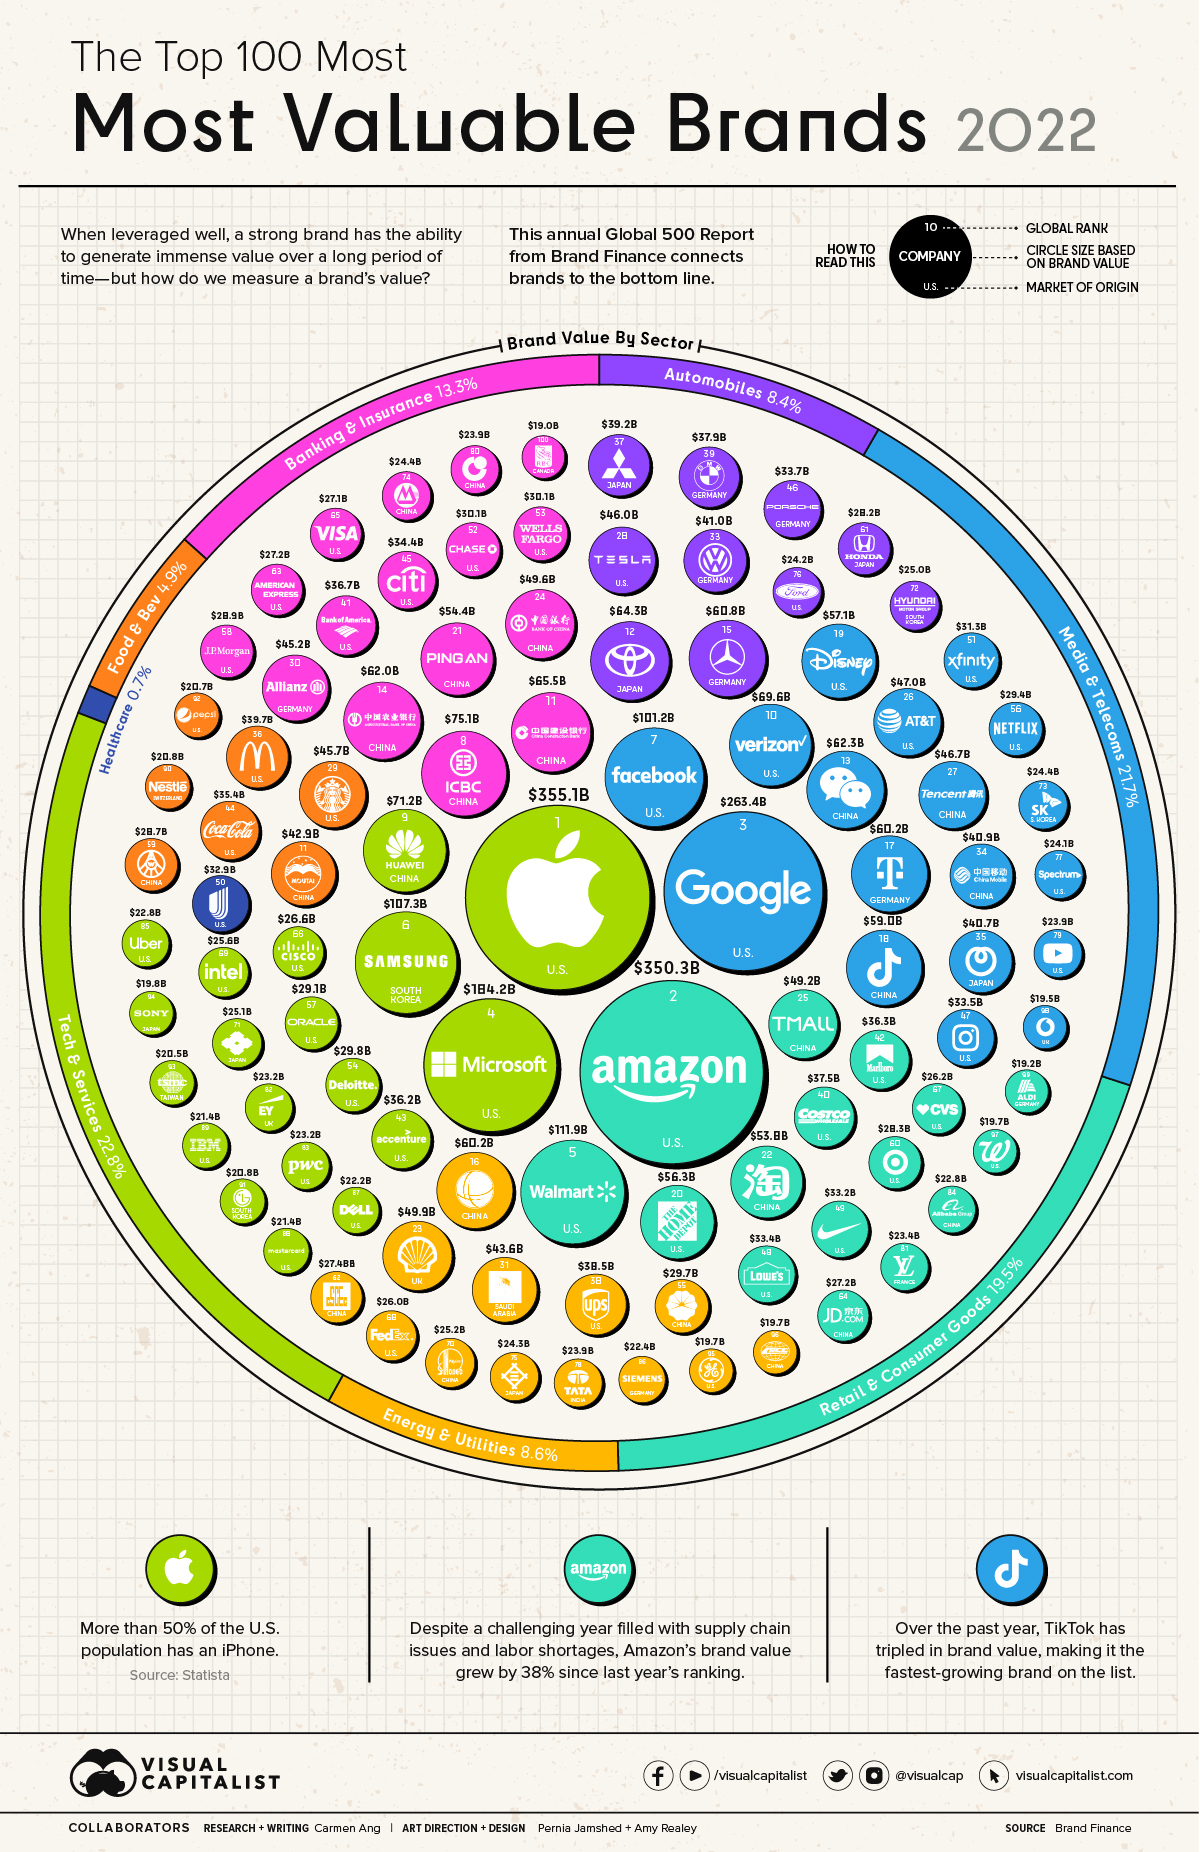
With this in mind, Brand Finance takes on the challenge of identifying the world’s most valuable brands in the world in its annual Global 500 Report. The graphic above, using data from the latest edition of the report, highlights the top 100 most valuable brands in 2022.
Editor’s note: This ranking measures the value of brands, which can be thought of as marketing-related intangible assets that create a brand identity and reputation in the minds of consumers. It attempts to measure this in financial terms, calculating what the brand is worth to the company that owns it. For more information on methodology, calculations, and sourcing, go to the bottom of this article.
A Full Breakdown of the Most Valuable Brands
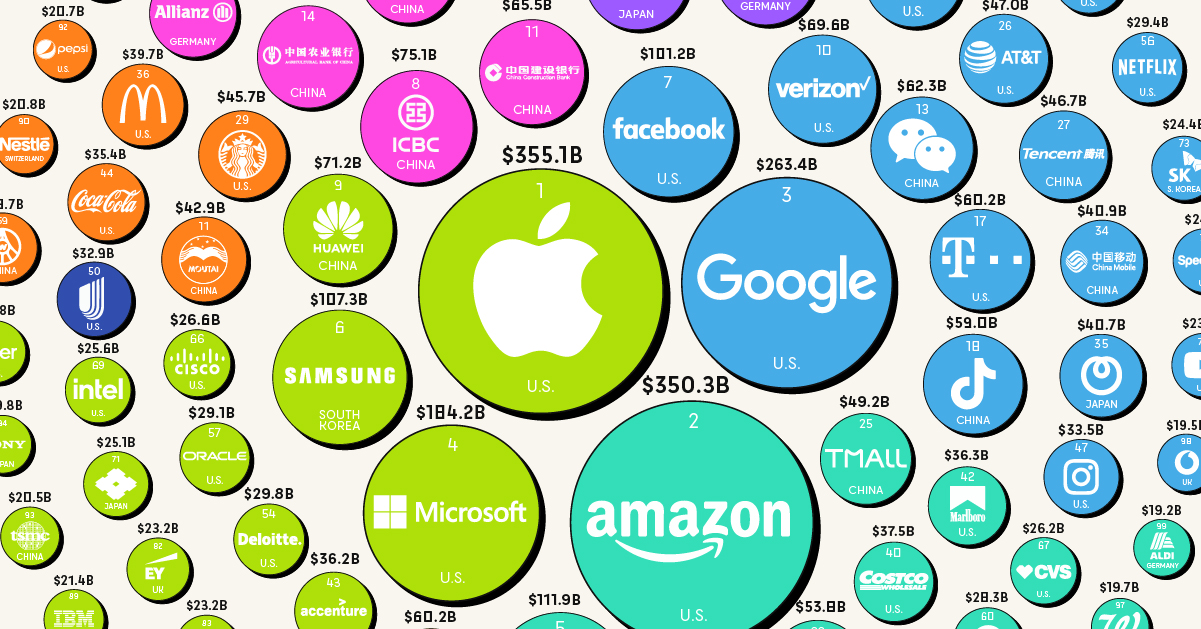
With an increase of 35% since last year’s report, Apple retains its top spot on the ranking as the world’s most valuable brand, with a total brand value of $335.1 billion.
This is the highest brand value ever recorded in the history of the Global 500 report, which has been published each year since 2007.
As one of the world’s largest tech companies, Apple dominates the smartphone market, especially in the U.S., where more than 50% of operating smartphones are now an iPhone.
Here’s a complete list of the 100 most valuable brands according to the report:
| Rank | Brand | 2022 Brand Value ($B) | Country | Sector |
|---|---|---|---|---|
| 1 | Apple | $355.1 | United States | Tech & Services |
| 2 | Amazon | $350.3 | United States | Retail & Consumer Goods |
| 3 | $263.4 | United States | Media & Telecoms | |
| 4 | Microsoft | $184.2 | United States | Tech & Services |
| 5 | Walmart | $111.9 | United States | Retail & Consumer Goods |
| 6 | Samsung Group | $107.3 | South Korea | Tech & Services |
| 7 | $101.2 | United States | Media & Telecoms | |
| 8 | ICBC | $75.1 | China | Banking & Insurance |
| 9 | Huawei | $71.2 | China | Tech & Services |
| 10 | Verizon | $69.6 | United States | Media & Telecoms |
| 11 | China Construction Bank | $65.5 | China | Banking & Insurance |
| 12 | Toyota | $64.3 | Japan | Automobiles |
| 13 | $62.3 | China | Media & Telecoms | |
| 14 | Agricultural Bank Of China | $62.0 | China | Banking & Insurance |
| 15 | Mercedes-Benz | $60.8 | Germany | Automobiles |
| 16 | State Grid | $60.2 | China | Energy & Utilities |
| 17 | Deutsche Telekom | $60.2 | Germany | Media & Telecoms |
| 18 | TikTok/Douyin | $59.0 | China | Media & Telecoms |
| 19 | Disney | $57.1 | United States | Media & Telecoms |
| 20 | Home Depot | $56.3 | United States | Retail & Consumer Goods |
| 21 | Ping An | $54.4 | China | Banking & Insurance |
| 22 | Taobao | $53.8 | China | Retail & Consumer Goods |
| 23 | Shell | $49.9 | United Kingdom | Energy & Utilities |
| 24 | Bank of China | $49.6 | China | Banking & Insurance |
| 25 | Tmall | $49.2 | China | Retail & Consumer Goods |
| 26 | AT&T | $47.0 | United States | Media & Telecoms |
| 27 | Tencent | $46.7 | China | Media & Telecoms |
| 28 | Tesla | $46.0 | United States | Automobiles |
| 29 | Starbucks | $45.7 | United States | Food & Bev |
| 30 | Allianz Group | $45.2 | Germany | Banking & Insurance |
| 31 | Aramco | $43.6 | Saudi Arabia | Energy & Utilities |
| 32 | Moutai | $42.9 | China | Food & Bev |
| 33 | Volkswagen | $41.0 | Germany | Automobiles |
| 34 | China Mobile | $40.9 | China | Media & Telecoms |
| 35 | NTT Group | $40.7 | Japan | Media & Telecoms |
| 36 | McDonald's | $39.7 | United States | Food & Bev |
| 37 | Mitsubishi Group | $39.2 | Japan | Automobiles |
| 38 | UPS | $38.5 | United States | Energy & Utilities |
| 39 | BMW | $37.9 | Germany | Automobiles |
| 40 | Costco | $37.5 | United States | Retail & Consumer Goods |
| 41 | Bank of America | $36.7 | United States | Banking & Insurance |
| 42 | Marlboro | $36.3 | United States | Retail & Consumer Goods |
| 43 | accenture | $36.2 | United States | Tech & Services |
| 44 | Coca-Cola | $35.4 | United States | Food & Bev |
| 45 | Citi | $34.4 | United States | Banking & Insurance |
| 46 | Porsche | $33.7 | Germany | Automobiles |
| 47 | $33.5 | United States | Media & Telecoms | |
| 48 | Lowe's | $33.4 | United States | Retail & Consumer Goods |
| 49 | Nike | $33.2 | United States | Retail & Consumer Goods |
| 50 | UnitedHealthcare | $32.9 | United States | Healthcare |
| 51 | Xfinity | $31.3 | United States | Media & Telecoms |
| 52 | Chase | $30.1 | United States | Banking & Insurance |
| 53 | Wells Fargo | $30.1 | United States | Banking & Insurance |
| 54 | Deloitte | $29.8 | United States | Tech & Services |
| 55 | PetroChina | $29.7 | China | Energy & Utilities |
| 56 | Netflix | $29.4 | United States | Media & Telecoms |
| 57 | Oracle | $29.1 | United States | Tech & Services |
| 58 | JP Morgan | $28.9 | United States | Banking & Insurance |
| 59 | Wuliangye | $28.7 | China | Food & Bev |
| 60 | Target | $28.3 | United States | Retail & Consumer Goods |
| 61 | Honda | $28.2 | Japan | Automobiles |
| 62 | CSCEC | $27.4 | China | Energy & Utilities |
| 63 | American Express | $27.2 | United States | Banking & Insurance |
| 64 | JD.com | $27.2 | China | Retail & Consumer Goods |
| 65 | VISA | $27.1 | United States | Banking & Insurance |
| 66 | Cisco | $26.6 | United States | Tech & Services |
| 67 | CVS | $26.2 | United States | Retail & Consumer Goods |
| 68 | FedEx | $26.0 | United States | Energy & Utilities |
| 69 | Intel | $25.6 | United States | Tech & Services |
| 70 | Sinopec | $25.2 | China | Energy & Utilities |
| 71 | Sumitomo Group | $25.1 | Japan | Tech & Services |
| 72 | Hyundai Group | $25.0 | South Korea | Automobiles |
| 73 | SK Group | $24.4 | South Korea | Media & Telecoms |
| 74 | China Merchants Bank | $24.4 | China | Banking & Insurance |
| 75 | Mitsui | $24.3 | Japan | Energy & Utilities |
| 76 | Ford | $24.2 | United States | Automobiles |
| 77 | Spectrum | $24.1 | United States | Media & Telecoms |
| 78 | TATA Group | $23.9 | India | Energy & Utilities |
| 79 | YouTube | $23.9 | United States | Media & Telecoms |
| 80 | China Life | $23.9 | China | Banking & Insurance |
| 81 | Louis Vuitton | $23.4 | France | Retail & Consumer Goods |
| 82 | EY | $23.2 | United Kingdom | Tech & Services |
| 83 | PWC | $23.2 | United States | Tech & Services |
| 84 | Alibaba.com | $22.8 | China | Retail & Consumer Goods |
| 85 | Uber | $22.8 | United States | Tech & Services |
| 86 | Siemens Group | $22.4 | Germany | Energy & Utilities |
| 87 | Dell Technologies | $22.2 | United States | Tech & Services |
| 88 | Mastercard | $21.4 | United States | Tech & Services |
| 89 | IBM | $21.4 | United States | Tech & Services |
| 90 | Nestlé | $20.8 | Switzerland | Food & Bev |
| 91 | LG Group | $20.8 | South Korea | Tech & Services |
| 92 | Pepsi | $20.7 | United States | Food & Bev |
| 93 | TSMC | $20.5 | Taiwan | Tech & Services |
| 94 | Sony | $19.8 | Japan | Tech & Services |
| 95 | General Electric | $19.7 | United States | Energy & Utilities |
| 96 | CRCC | $19.7 | China | Energy & Utilities |
| 97 | Walgreens | $19.7 | United States | Retail & Consumer Goods |
| 98 | Vodafone | $19.5 | United Kingdom | Media & Telecoms |
| 99 | Aldi | $19.2 | Germany | Retail & Consumer Goods |
| 100 | RBC | $19.0 | Canada | Banking & Insurance |
After Apple, coming in a close second is Amazon with a brand value of $350.3 billion. This is not surprising, considering the tech giant has often found itself neck-and-neck with Apple in the rankings, and has even come in first place in previous editions of the report.
One other brand worth highlighting is TikTok. The social media company saw a 215% increase in its brand value year-over-year, making it the fastest-growing brand on the entire list.
Between 2019 and 2021, the platform saw its userbase skyrocket, growing from 291.4 million to 655.9 million in just two years. If this growth continues, TikTok could reach nearly one billion users by 2025, according to projections from Insider Intelligence.
Most Valuable Sectors
Over a third of the brands on the list fall into the tech and services sector. Combined, this category has a brand value of $2.0 trillion.
| Sector | Brand Value | % of Top 100 |
|---|---|---|
| Tech & Services | $2.0 trillion | 36.8% |
| Media & Telecoms | $1.0 trillion | 19.2% |
| Retail & Consumer Goods | $910 billion | 16.8% |
| Banking & Insurance | $634 billion | 11.7% |
| Energy & Utilities | $411 billion | 7.6% |
| Automobiles | $400 billion | 7.4% |
| Healthcare | $33 billion | 0.6% |
Media is the second most valuable sector—19% of the top 100 brands fall under the media and telecoms sector, including Google, Facebook, and WeChat.
COVID-19 is partly the reason for this, as media consumption increased throughout the global pandemic. For example, in the first nine months of 2021, Snapchat’s daily usage grew by 77%. Despite increased traction with users, it’s worth noting the company is now feeling the sting as the real world competes for attention spans once again and advertisers begin to ghost the app due to recession jitters.
As pandemic restrictions fade out around the world, and murmurs of a global recession threaten global economic growth, next year’s report could see some big shifts in brand value.
The Geography of Valuable Brands
When looking at where these brands are based, we see that the United States and China account for 73 of the top 100 brands on the ranking. Even more surprising—just six countries make up 94% of the list.
The growth of Chinese companies on the global stage is reflected in this visualization. As a point of comparison, a decade ago, only six Chinese companies made Brand Finance’s Top 100 ranking, and none of them were in the top 30 for brand value.
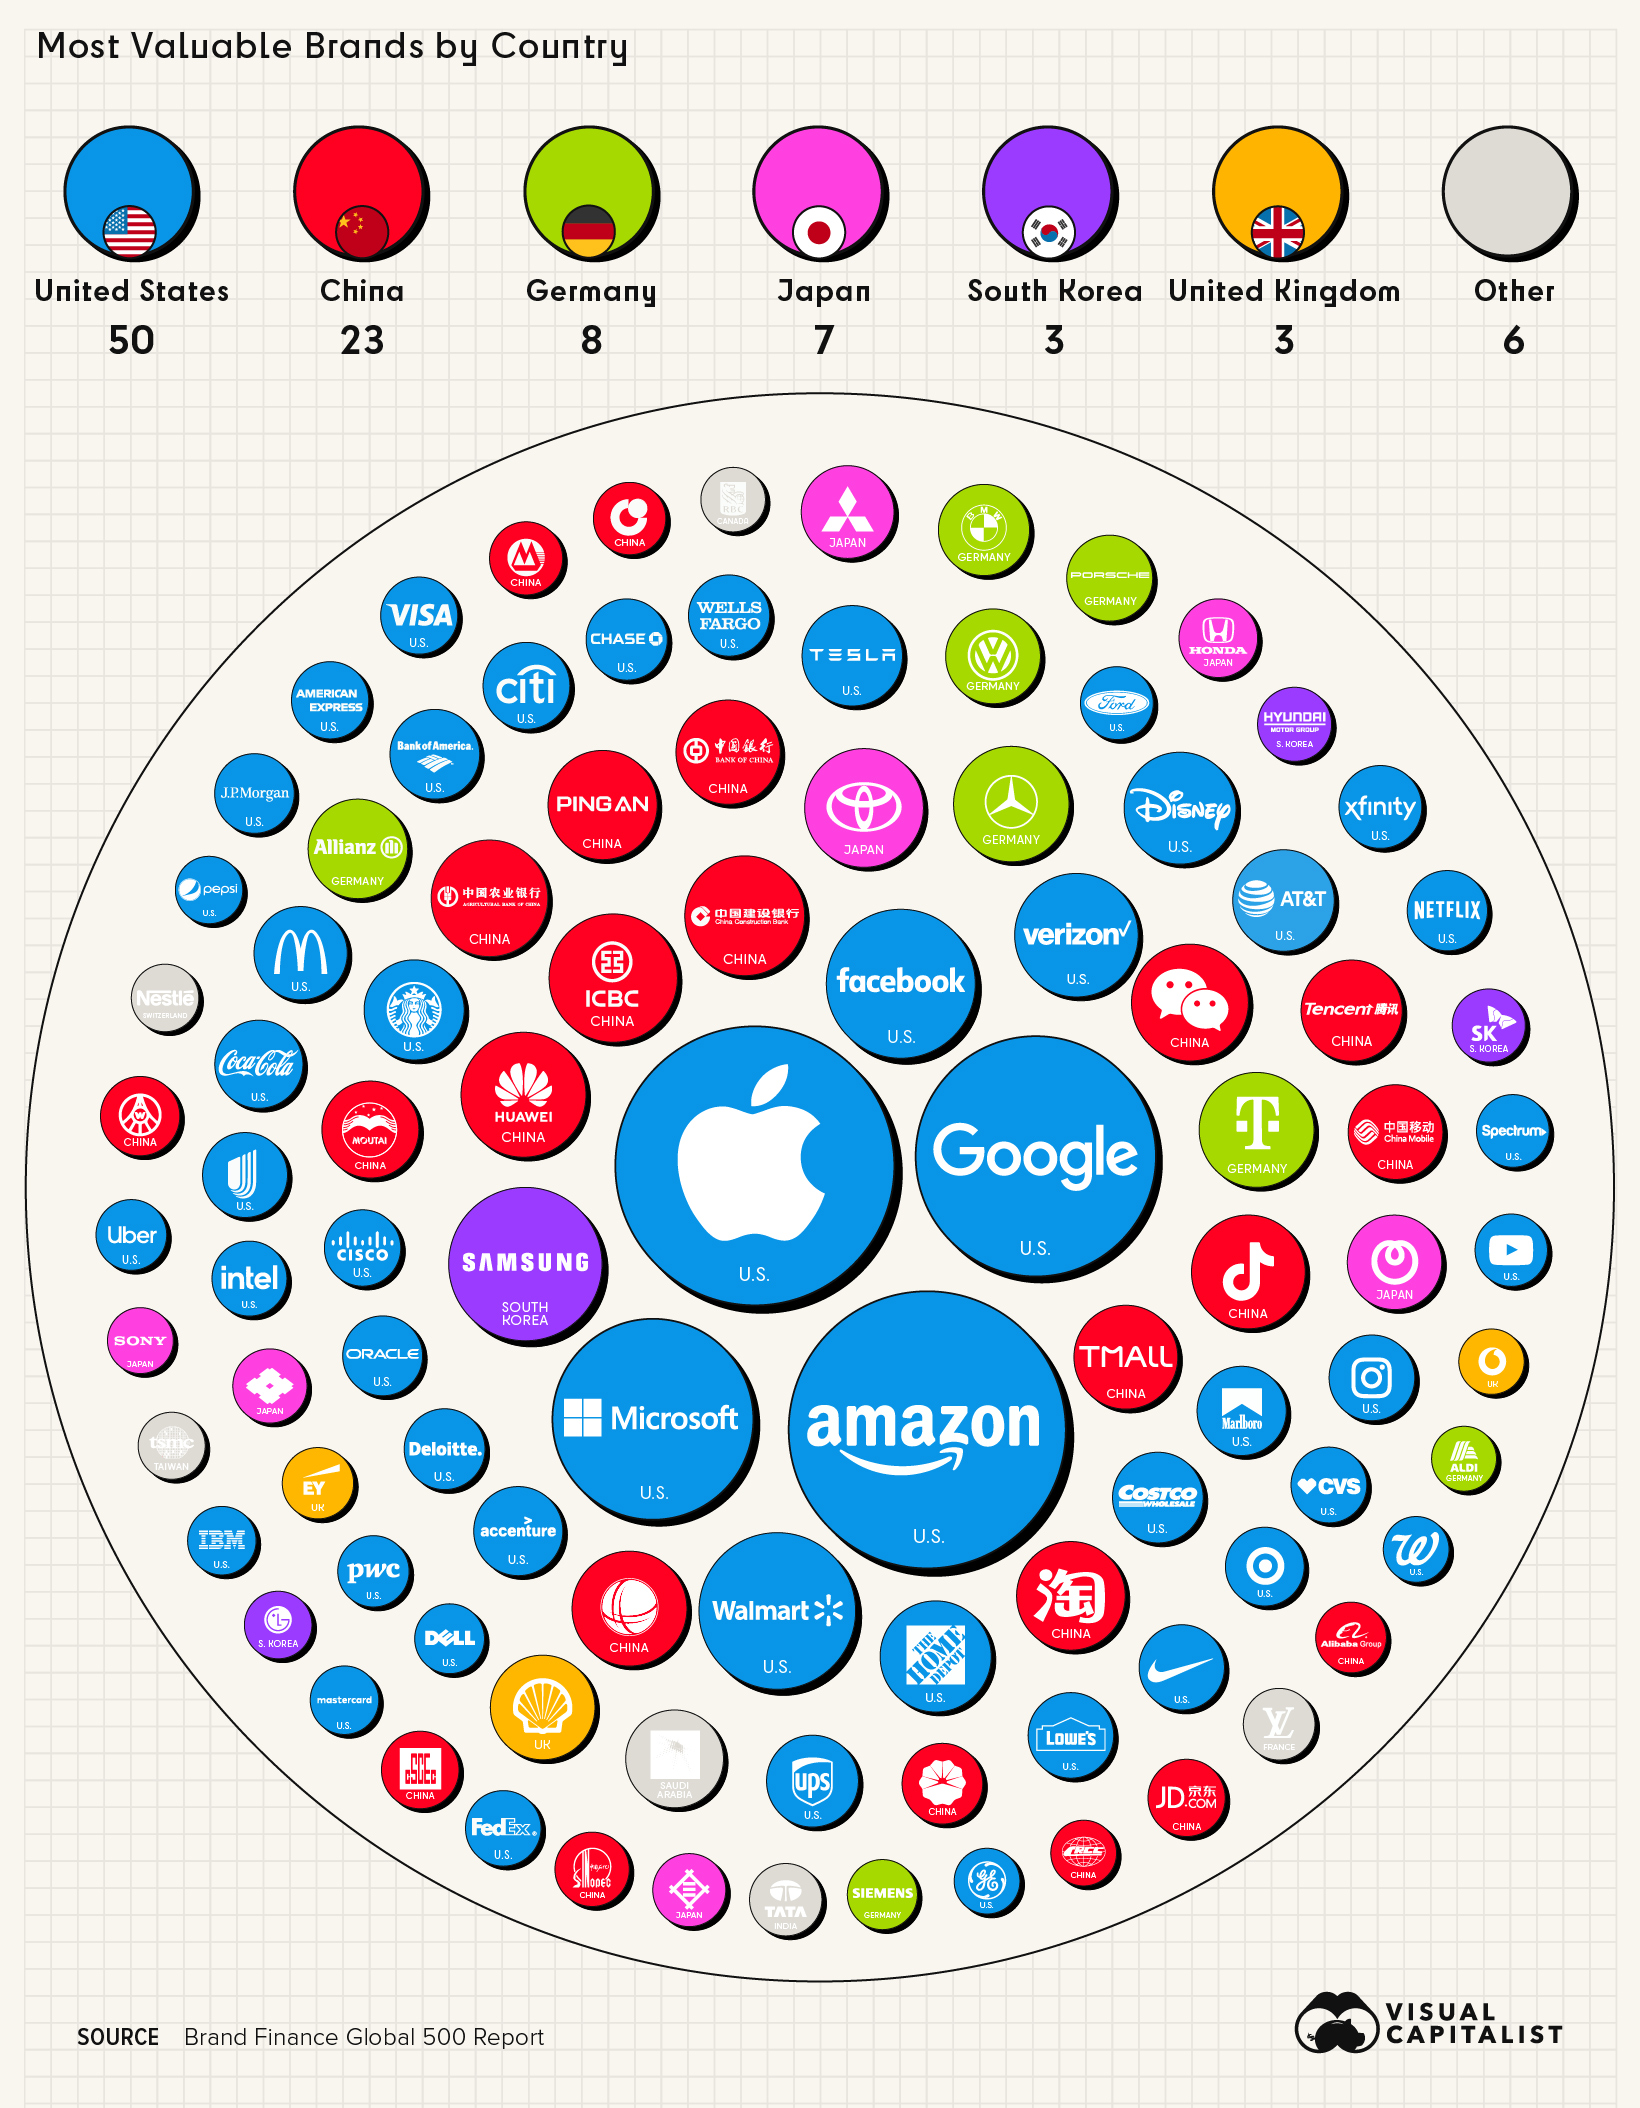
Interestingly, European countries only make up 14% of the list, which is a testament to just how much Europe’s economic dominance has dwindled over the last few decades.
Back in the 1960s, Europe accounted for nearly a third of the world’s total GDP. But by 2017, it had dropped down to 16%. According to a forecast by the Pardee Center of the University of Denver, the EU’s share of global GDP is expected to drop down to 10% by 2100.
Of course, if history has taught us anything, it’s that a lot can change over the span of a century. How a ranking like this will look in coming decades is anyone’s guess.
Where does this data come from?
Source: Brand Finance Global 500 Report
Important note: The values shown above are brand value calculations as opposed to market capitalization. See below for more details.
How is brand value calculated? In simple terms, the methodology for calculating “brand value” is a formula that is as follows:
Brand Strength (BSI) x Brand Royalty Rate x Brand Revenues = Brand Value
Brand Strength Index (BSI) looks at brand investment, brand equity, and brand performance. The brand royalty rate is determined based on sector. Lastly, forecast brand-specific revenues are determined based on the proportion of parent company revenues attributable to the brand in question. Brand value itself is discounted to net present value.
We recommend visiting page 94 and 99 of the report to view the full explanation of the methodology.


Markets
The European Stock Market: Attractive Valuations Offer Opportunities
On average, the European stock market has valuations that are nearly 50% lower than U.S. valuations. But how can you access the market?


European Stock Market: Attractive Valuations Offer Opportunities
Europe is known for some established brands, from L’Oréal to Louis Vuitton. However, the European stock market offers additional opportunities that may be lesser known.
The above infographic, sponsored by STOXX, outlines why investors may want to consider European stocks.
Attractive Valuations
Compared to most North American and Asian markets, European stocks offer lower or comparable valuations.
| Index | Price-to-Earnings Ratio | Price-to-Book Ratio |
|---|---|---|
| EURO STOXX 50 | 14.9 | 2.2 |
| STOXX Europe 600 | 14.4 | 2 |
| U.S. | 25.9 | 4.7 |
| Canada | 16.1 | 1.8 |
| Japan | 15.4 | 1.6 |
| Asia Pacific ex. China | 17.1 | 1.8 |
Data as of February 29, 2024. See graphic for full index names. Ratios based on trailing 12 month financials. The price to earnings ratio excludes companies with negative earnings.
On average, European valuations are nearly 50% lower than U.S. valuations, potentially offering an affordable entry point for investors.
Research also shows that lower price ratios have historically led to higher long-term returns.
Market Movements Not Closely Connected
Over the last decade, the European stock market had low-to-moderate correlation with North American and Asian equities.
The below chart shows correlations from February 2014 to February 2024. A value closer to zero indicates low correlation, while a value of one would indicate that two regions are moving in perfect unison.
| EURO STOXX 50 | STOXX EUROPE 600 | U.S. | Canada | Japan | Asia Pacific ex. China |
|
|---|---|---|---|---|---|---|
| EURO STOXX 50 | 1.00 | 0.97 | 0.55 | 0.67 | 0.24 | 0.43 |
| STOXX EUROPE 600 | 1.00 | 0.56 | 0.71 | 0.28 | 0.48 | |
| U.S. | 1.00 | 0.73 | 0.12 | 0.25 | ||
| Canada | 1.00 | 0.22 | 0.40 | |||
| Japan | 1.00 | 0.88 | ||||
| Asia Pacific ex. China | 1.00 |
Data is based on daily USD returns.
European equities had relatively independent market movements from North American and Asian markets. One contributing factor could be the differing sector weights in each market. For instance, technology makes up a quarter of the U.S. market, but health care and industrials dominate the broader European market.
Ultimately, European equities can enhance portfolio diversification and have the potential to mitigate risk for investors.
Tracking the Market
For investors interested in European equities, STOXX offers a variety of flagship indices:
| Index | Description | Market Cap |
|---|---|---|
| STOXX Europe 600 | Pan-regional, broad market | €10.5T |
| STOXX Developed Europe | Pan-regional, broad-market | €9.9T |
| STOXX Europe 600 ESG-X | Pan-regional, broad market, sustainability focus | €9.7T |
| STOXX Europe 50 | Pan-regional, blue-chip | €5.1T |
| EURO STOXX 50 | Eurozone, blue-chip | €3.5T |
Data is as of February 29, 2024. Market cap is free float, which represents the shares that are readily available for public trading on stock exchanges.
The EURO STOXX 50 tracks the Eurozone’s biggest and most traded companies. It also underlies one of the world’s largest ranges of ETFs and mutual funds. As of November 2023, there were €27.3 billion in ETFs and €23.5B in mutual fund assets under management tracking the index.
“For the past 25 years, the EURO STOXX 50 has served as an accurate, reliable and tradable representation of the Eurozone equity market.”
— Axel Lomholt, General Manager at STOXX
Partnering with STOXX to Track the European Stock Market
Are you interested in European equities? STOXX can be a valuable partner:
- Comprehensive, liquid and investable ecosystem
- European heritage, global reach
- Highly sophisticated customization capabilities
- Open architecture approach to using data
- Close partnerships with clients
- Part of ISS STOXX and Deutsche Börse Group
With a full suite of indices, STOXX can help you benchmark against the European stock market.
Learn how STOXX’s European indices offer liquid and effective market access.

-

 Economy2 days ago
Economic Growth Forecasts for G7 and BRICS Countries in 2024
The IMF has released its economic growth forecasts for 2024. How do the G7 and BRICS countries compare?
-

 Markets1 week ago
U.S. Debt Interest Payments Reach $1 Trillion
U.S. debt interest payments have surged past the $1 trillion dollar mark, amid high interest rates and an ever-expanding debt burden.
-

 United States2 weeks ago
Ranked: The Largest U.S. Corporations by Number of Employees
We visualized the top U.S. companies by employees, revealing the massive scale of retailers like Walmart, Target, and Home Depot.
-

 Markets2 weeks ago
The Top 10 States by Real GDP Growth in 2023
This graphic shows the states with the highest real GDP growth rate in 2023, largely propelled by the oil and gas boom.
-

 Markets2 weeks ago
Ranked: The World’s Top Flight Routes, by Revenue
In this graphic, we show the highest earning flight routes globally as air travel continued to rebound in 2023.
-

 Markets3 weeks ago
Ranked: The Most Valuable Housing Markets in America
The U.S. residential real estate market is worth a staggering $47.5 trillion. Here are the most valuable housing markets in the country.


-

 Education1 week ago
How Hard Is It to Get Into an Ivy League School?
-

 Technology2 weeks ago
Ranked: Semiconductor Companies by Industry Revenue Share
-
Markets2 weeks ago
Ranked: The World’s Top Flight Routes, by Revenue
-

 Demographics2 weeks ago
Population Projections: The World’s 6 Largest Countries in 2075
-
Markets2 weeks ago
The Top 10 States by Real GDP Growth in 2023
-

 Demographics2 weeks ago
The Smallest Gender Wage Gaps in OECD Countries
-

 Economy2 weeks ago
Where U.S. Inflation Hit the Hardest in March 2024
-

 Green2 weeks ago
Top Countries By Forest Growth Since 2001