Markets
These Global Cities Show the Highest Real Estate Bubble Risk


These Global Cities Show the Highest Real Estate Bubble Risk
Housing bubbles are a tricky phenomenon. As a market gathers steam and prices increase, it remains a matter of debate whether that market is overvalued and flooded with speculation, or it’s simply experiencing robust demand.
Of course, once a bubble bursts, it’s all obvious in hindsight.
One common red flag is when prices decouple from local incomes and rents. As well, imbalances in the real economy, such as excessive construction activity and lending can signal a bubble in the making.
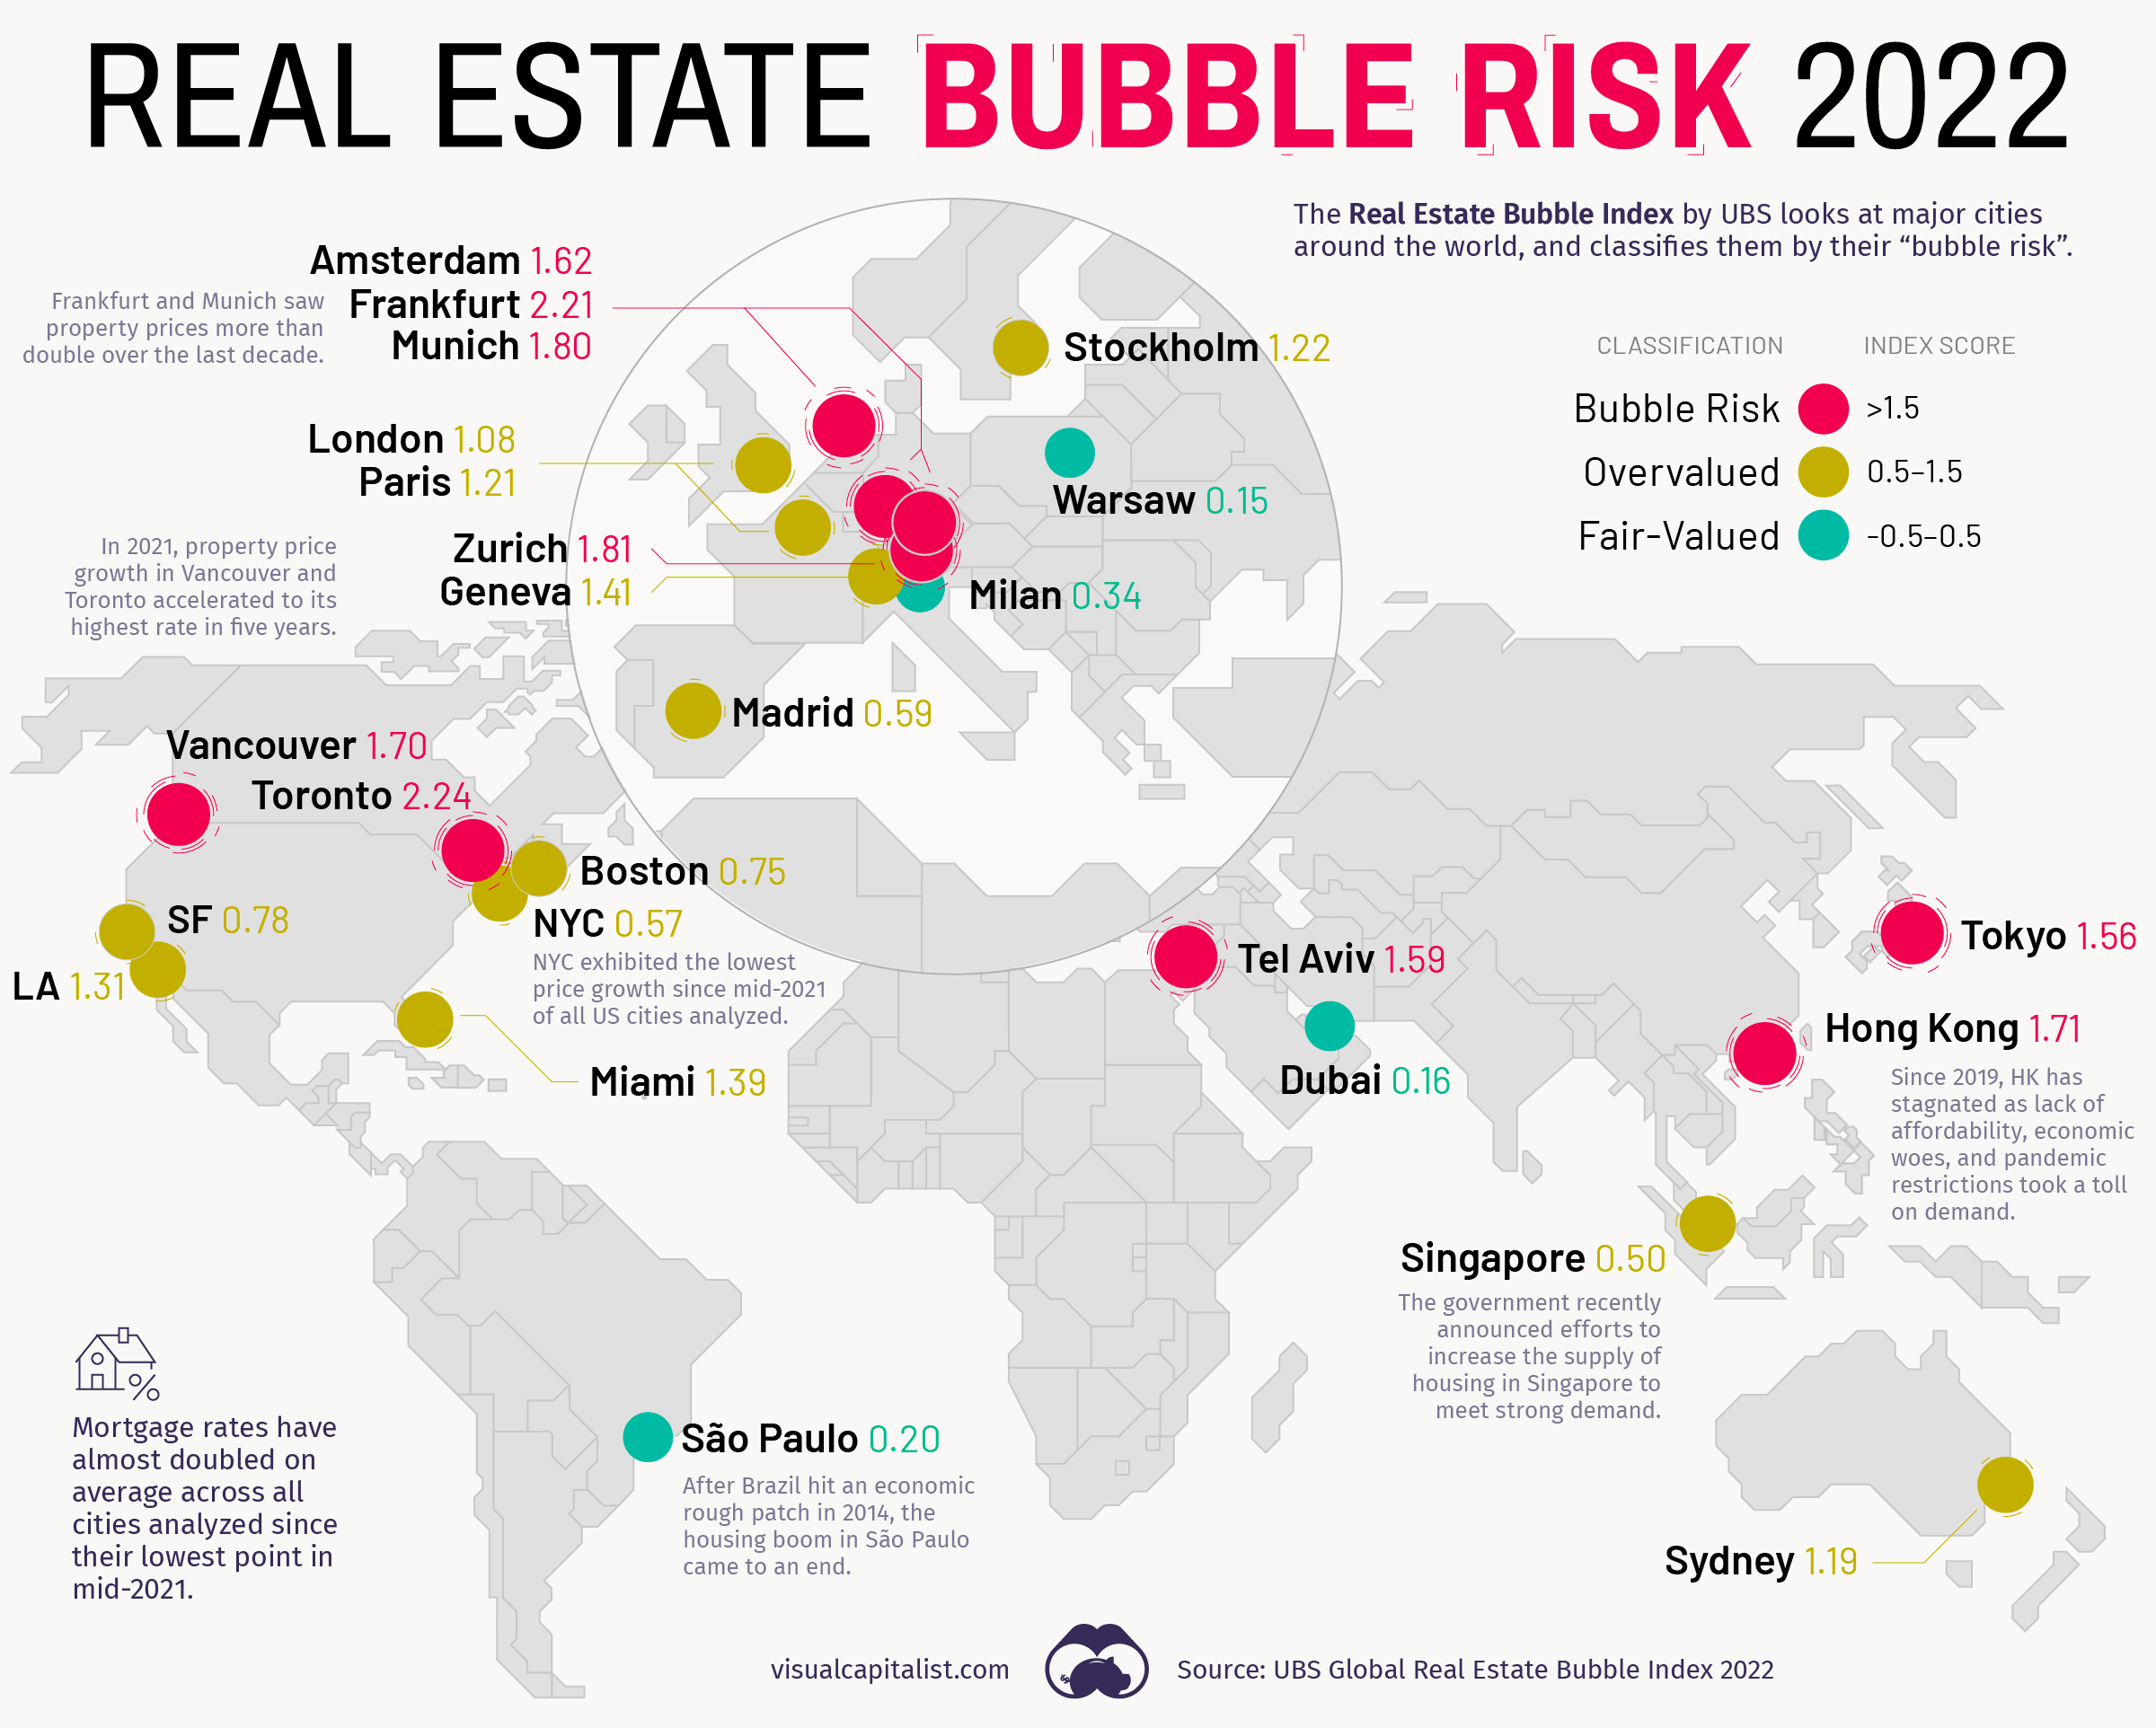
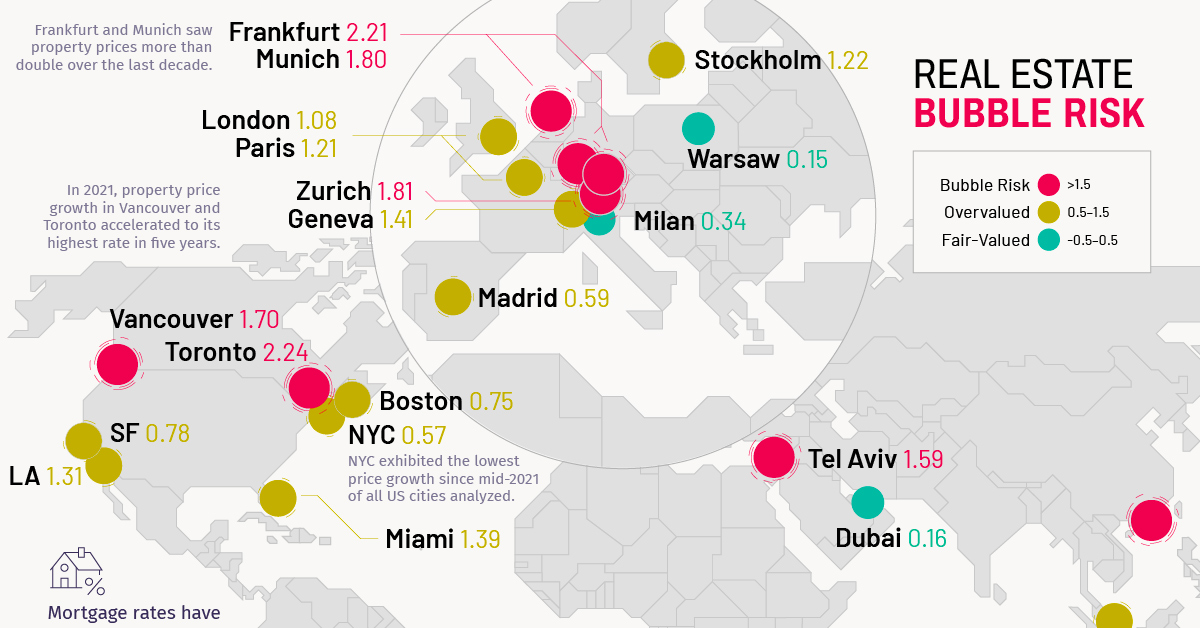
The map above, based on data from the Real Estate Bubble Index by UBS, examines 25 global cities, scoring them based on their bubble risk.
Overinflated Markets
In the 2022 edition of the Real Estate Bubble Index, nine of the cities covered were classified as having extreme bubble risk (1.5 or higher score).
| Rank | Risk Category | City | Bubble Index Score |
|---|---|---|---|
| #1 | 🔴 | 🇨🇦 Toronto | 2.24 |
| #2 | 🔴 | 🇩🇪 Frankfurt | 2.21 |
| #3 | 🔴 | 🇨🇭 Zurich | 1.81 |
| #4 | 🔴 | 🇩🇪 Munich | 1.80 |
| #5 | 🔴 | 🇭🇰 Hong Kong | 1.71 |
| #6 | 🔴 | 🇨🇦 Vancouver | 1.70 |
| #7 | 🔴 | 🇳🇱 Amsterdam | 1.62 |
| #8 | 🔴 | 🇮🇱 Tel Aviv | 1.59 |
| #9 | 🔴 | 🇯🇵 Tokyo | 1.56 |
| #10 | 🟠 | 🇺🇸 Miami | 1.39 |
| #11 | 🟠 | 🇺🇸 Los Angeles | 1.31 |
| #12 | 🟠 | 🇸🇪 Stockholm | 1.22 |
| #13 | 🟠 | 🇫🇷 Paris | 1.21 |
| #14 | 🟠 | 🇦🇺 Sydney | 1.19 |
| #15 | 🟠 | 🇨🇭 Geneva | 1.14 |
| #16 | 🟠 | 🇬🇧 London | 1.08 |
| #17 | 🟠 | 🇺🇸 San Francisco | 0.78 |
| #18 | 🟠 | 🇺🇸 Boston | 0.75 |
| #19 | 🟠 | 🇪🇸 Madrid | 0.59 |
| #20 | 🟠 | 🇺🇸 New York | 0.57 |
| #21 | 🟠 | 🇸🇬 Singapore | 0.50 |
| #22 | 🟢 | 🇮🇹 Milan | 0.34 |
| #23 | 🟢 | 🇧🇷 Sao Paulo | 0.20 |
| #24 | 🟢 | 🇦🇪 Dubai | 0.16 |
| #25 | 🟢 | 🇵🇱 Warsaw | 0.15 |
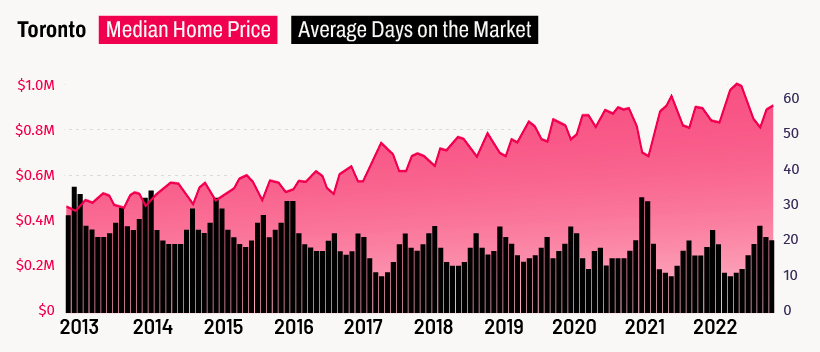
Canada’s largest city finds itself at the top of a ranking no city wants to end up on. Toronto’s home prices have been rising steadily for years now, and many, including UBS, believe that the city is now firmly in bubble territory.
Vancouver also finds itself in a similar position. Both Canadian cities have a high quality of life and have thriving tech industries.
Notably, none of the U.S. cities analyzed find themselves in the most extreme bubble risk category. The closest scoring U.S. city was Miami, which sits firmly in overvalued territory (0.5-1.5 range) with a score of 1.39.
Examining the Trends
In recent years, low interest rates helped push home prices and incomes further apart.
For cities in the bubble risk zone, prices have climbed by an average of 60% in inflation-adjusted terms over the past decade, while rents and real incomes increased by just 12%. And, while COVID-19 briefly put a dent in urban demand, rents in the cities analyzed rose at around the same pace as pre-pandemic times.
As a result, all but three of the cities saw positive price growth over the past year from a nominal price perspective:
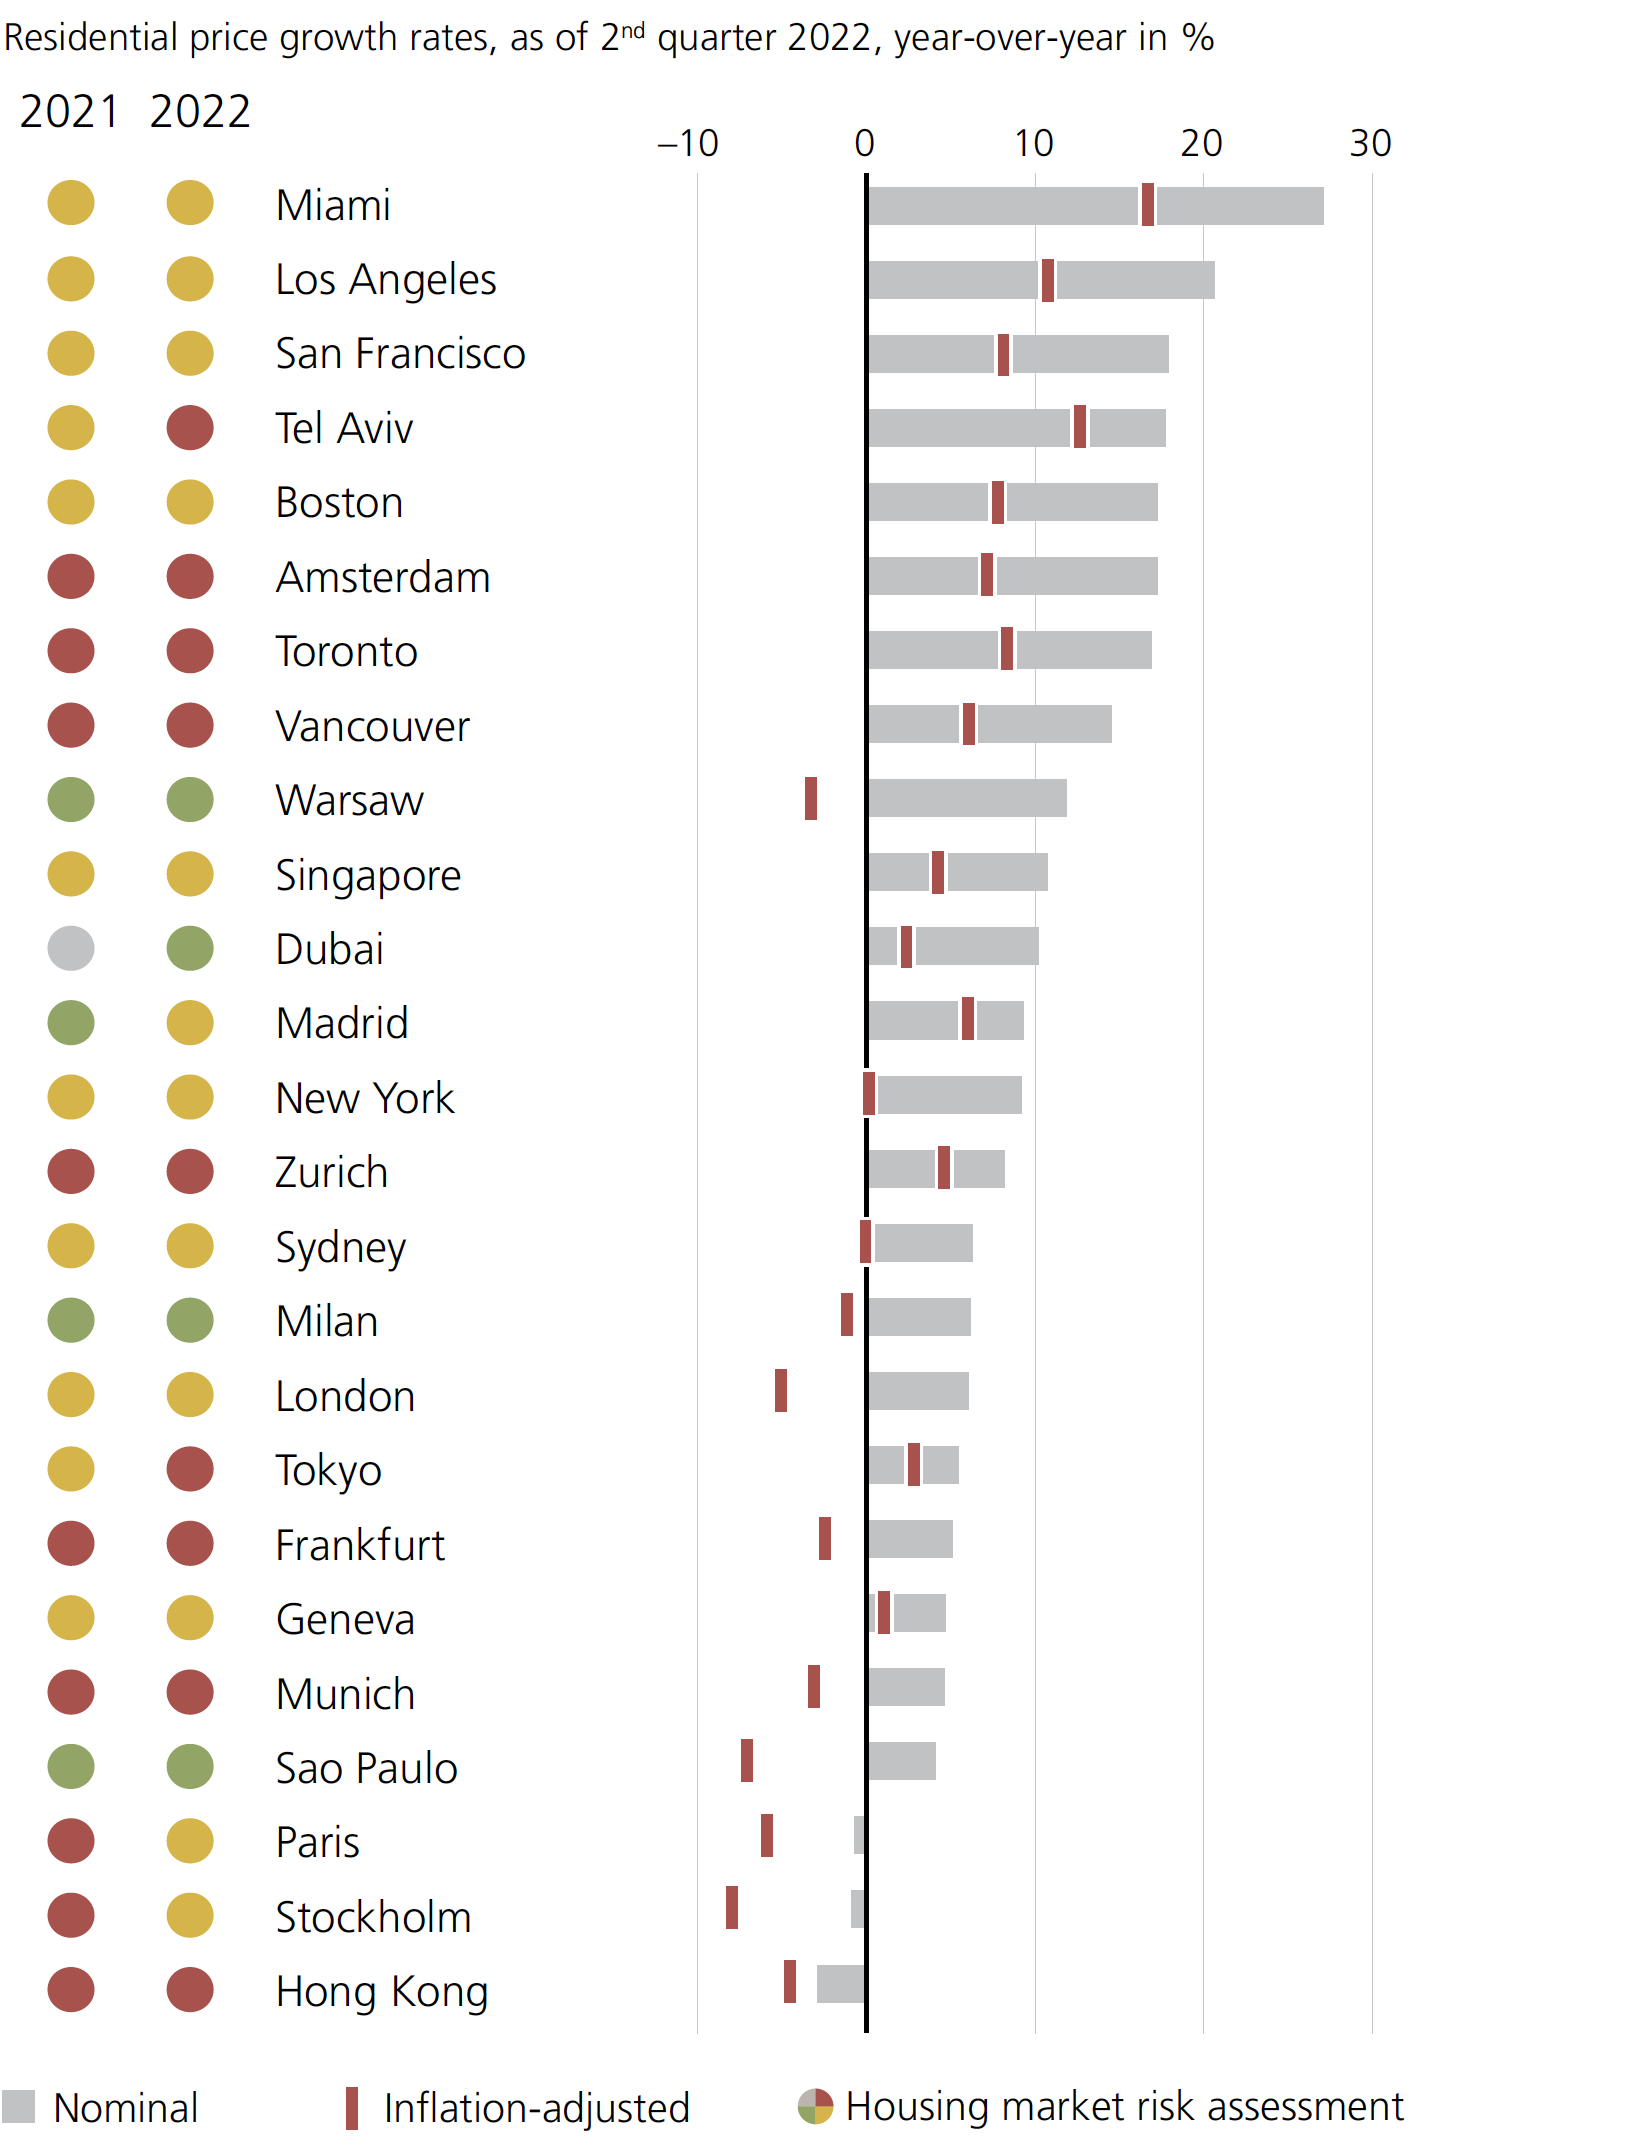
U.S. cities occupy a number of spots at the top of this chart. Miami, in particular, is seeing strong internal migration patterns, as well as renewed interest from foreign investors.
Hong Kong experienced the biggest one-year nominal drop of all the cities analyzed. The report notes that since around 2019 Hong Kong “has broadly stagnated as the lack of affordability, economic woes, and pandemic restrictions all took a major toll on demand.”
Prices can’t rise forever. According to UBS, most cities with high valuations, price corrections have already begun, or could be right around the corner.


Markets
The European Stock Market: Attractive Valuations Offer Opportunities
On average, the European stock market has valuations that are nearly 50% lower than U.S. valuations. But how can you access the market?


European Stock Market: Attractive Valuations Offer Opportunities
Europe is known for some established brands, from L’Oréal to Louis Vuitton. However, the European stock market offers additional opportunities that may be lesser known.
The above infographic, sponsored by STOXX, outlines why investors may want to consider European stocks.
Attractive Valuations
Compared to most North American and Asian markets, European stocks offer lower or comparable valuations.
| Index | Price-to-Earnings Ratio | Price-to-Book Ratio |
|---|---|---|
| EURO STOXX 50 | 14.9 | 2.2 |
| STOXX Europe 600 | 14.4 | 2 |
| U.S. | 25.9 | 4.7 |
| Canada | 16.1 | 1.8 |
| Japan | 15.4 | 1.6 |
| Asia Pacific ex. China | 17.1 | 1.8 |
Data as of February 29, 2024. See graphic for full index names. Ratios based on trailing 12 month financials. The price to earnings ratio excludes companies with negative earnings.
On average, European valuations are nearly 50% lower than U.S. valuations, potentially offering an affordable entry point for investors.
Research also shows that lower price ratios have historically led to higher long-term returns.
Market Movements Not Closely Connected
Over the last decade, the European stock market had low-to-moderate correlation with North American and Asian equities.
The below chart shows correlations from February 2014 to February 2024. A value closer to zero indicates low correlation, while a value of one would indicate that two regions are moving in perfect unison.
| EURO STOXX 50 | STOXX EUROPE 600 | U.S. | Canada | Japan | Asia Pacific ex. China |
|
|---|---|---|---|---|---|---|
| EURO STOXX 50 | 1.00 | 0.97 | 0.55 | 0.67 | 0.24 | 0.43 |
| STOXX EUROPE 600 | 1.00 | 0.56 | 0.71 | 0.28 | 0.48 | |
| U.S. | 1.00 | 0.73 | 0.12 | 0.25 | ||
| Canada | 1.00 | 0.22 | 0.40 | |||
| Japan | 1.00 | 0.88 | ||||
| Asia Pacific ex. China | 1.00 |
Data is based on daily USD returns.
European equities had relatively independent market movements from North American and Asian markets. One contributing factor could be the differing sector weights in each market. For instance, technology makes up a quarter of the U.S. market, but health care and industrials dominate the broader European market.
Ultimately, European equities can enhance portfolio diversification and have the potential to mitigate risk for investors.
Tracking the Market
For investors interested in European equities, STOXX offers a variety of flagship indices:
| Index | Description | Market Cap |
|---|---|---|
| STOXX Europe 600 | Pan-regional, broad market | €10.5T |
| STOXX Developed Europe | Pan-regional, broad-market | €9.9T |
| STOXX Europe 600 ESG-X | Pan-regional, broad market, sustainability focus | €9.7T |
| STOXX Europe 50 | Pan-regional, blue-chip | €5.1T |
| EURO STOXX 50 | Eurozone, blue-chip | €3.5T |
Data is as of February 29, 2024. Market cap is free float, which represents the shares that are readily available for public trading on stock exchanges.
The EURO STOXX 50 tracks the Eurozone’s biggest and most traded companies. It also underlies one of the world’s largest ranges of ETFs and mutual funds. As of November 2023, there were €27.3 billion in ETFs and €23.5B in mutual fund assets under management tracking the index.
“For the past 25 years, the EURO STOXX 50 has served as an accurate, reliable and tradable representation of the Eurozone equity market.”
— Axel Lomholt, General Manager at STOXX
Partnering with STOXX to Track the European Stock Market
Are you interested in European equities? STOXX can be a valuable partner:
- Comprehensive, liquid and investable ecosystem
- European heritage, global reach
- Highly sophisticated customization capabilities
- Open architecture approach to using data
- Close partnerships with clients
- Part of ISS STOXX and Deutsche Börse Group
With a full suite of indices, STOXX can help you benchmark against the European stock market.
Learn how STOXX’s European indices offer liquid and effective market access.

-

 Economy1 day ago
Economic Growth Forecasts for G7 and BRICS Countries in 2024
The IMF has released its economic growth forecasts for 2024. How do the G7 and BRICS countries compare?
-

 Markets1 week ago
U.S. Debt Interest Payments Reach $1 Trillion
U.S. debt interest payments have surged past the $1 trillion dollar mark, amid high interest rates and an ever-expanding debt burden.
-

 United States2 weeks ago
Ranked: The Largest U.S. Corporations by Number of Employees
We visualized the top U.S. companies by employees, revealing the massive scale of retailers like Walmart, Target, and Home Depot.
-

 Markets2 weeks ago
The Top 10 States by Real GDP Growth in 2023
This graphic shows the states with the highest real GDP growth rate in 2023, largely propelled by the oil and gas boom.
-

 Markets2 weeks ago
Ranked: The World’s Top Flight Routes, by Revenue
In this graphic, we show the highest earning flight routes globally as air travel continued to rebound in 2023.
-

 Markets2 weeks ago
Ranked: The Most Valuable Housing Markets in America
The U.S. residential real estate market is worth a staggering $47.5 trillion. Here are the most valuable housing markets in the country.


-

 Mining1 week ago
Gold vs. S&P 500: Which Has Grown More Over Five Years?
-
Markets2 weeks ago
Ranked: The Most Valuable Housing Markets in America
-

 Money2 weeks ago
Which States Have the Highest Minimum Wage in America?
-

 AI2 weeks ago
Ranked: Semiconductor Companies by Industry Revenue Share
-
Markets2 weeks ago
Ranked: The World’s Top Flight Routes, by Revenue
-

 Demographics2 weeks ago
Population Projections: The World’s 6 Largest Countries in 2075
-
Markets2 weeks ago
The Top 10 States by Real GDP Growth in 2023
-

 Demographics2 weeks ago
The Smallest Gender Wage Gaps in OECD Countries