Markets
Visualizing America’s Shortage of Affordable Homes
![]() See this visualization first on the Voronoi app.
See this visualization first on the Voronoi app.
Visualizing America’s Shortage of Affordable Homes
This was originally posted on our Voronoi app. Download the app for free on iOS or Android and discover incredible data-driven charts from a variety of trusted sources.
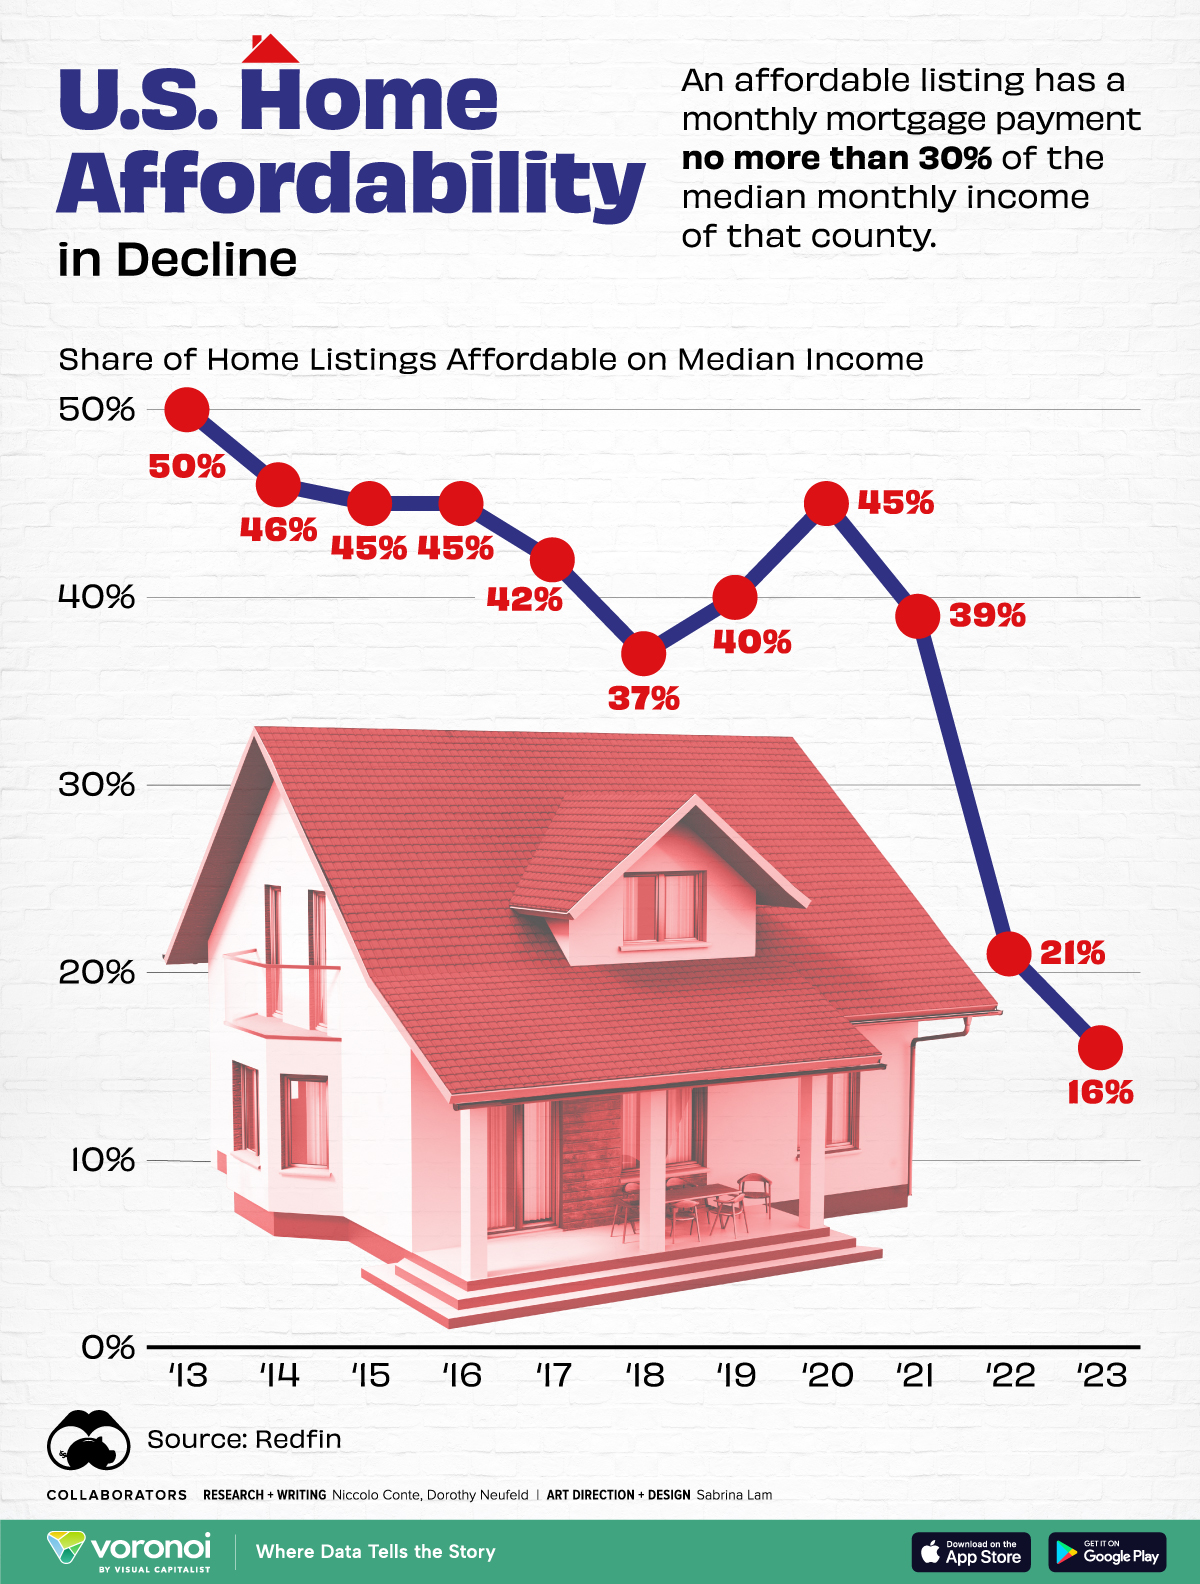
A large share of affordable homes vanished over the pandemic, leading the supply to hit its lowest level on record in 2023.
Many buyers have become priced out of the market due to soaring home prices and high interest rates. Last year alone, the number of affordable homes shrank by almost 41%, equal to over 243,000 properties.
This graphic shows the dwindling supply of affordable U.S. homes, based on data from Redfin.
The Sharp Decline in Housing Affordability
In 2023, only 16% of homes were affordable in America, falling from 21% in the year before.
An affordable listing was defined as one with a monthly mortgage payment no more than 30% of the median monthly income of that county. Below, we show the share of affordable listings in the 97 biggest U.S. metropolitan areas by population:
| Year | Share of Affordable Home Listings | U.S. Median Sale Price on New Home | Average 30-Year Fixed Mortgage Rate |
|---|---|---|---|
| 2023 | 16% | $427,400 | 6.81% |
| 2022 | 21% | $457,800 | 5.34% |
| 2021 | 39% | $397,100 | 2.96% |
| 2020 | 45% | $336,000 | 3.10% |
| 2019 | 40% | $321,500 | 3.94% |
| 2018 | 37% | $326,400 | 4.54% |
| 2017 | 42% | $323,100 | 3.99% |
| 2016 | 45% | $307,800 | 3.65% |
| 2015 | 45% | $294,200 | 3.85% |
| 2014 | 46% | $288,500 | 4.17% |
| 2013 | 50% | $268,900 | 3.98% |
As the above table shows, housing affordability has grown increasingly out of reach as mortgage rates have more than doubled in just two years.
While affordable homes made up 39% of the market in 2021, the share dropped precipitously as interest rates climbed higher. In 2023, the average annual 30-year fixed mortgage rates reached 6.81%—hitting its highest level in 20 years.
Although mortgage rates may decline over the year if the Federal Reserve cuts interest rates, it may not be enough to boost the supply of affordable housing.
That’s because rates may not fall sharply enough to undo the “golden hand-cuff” effect, where homeowners are reluctant to sell in order to hold on to their low mortgage rates. Adding to this, home construction has fallen significantly since the global financial crisis. During this time, home builders and lenders became increasingly cautious, leading home construction to drop 55% between 2006 and 2021.
What Comes Next?
The good news is that new-home construction is forecast to increase in 2024, with single-family housing starts projected to grow 4.7%.
While new home sales have historically comprised 10-12% of the single-family home market, they have recently surged to 30% due to the collapsing supply of existing homes. But even as new supply enters the market, it will likely take a number of years for housing affordability return to historical levels.
In fact, JP Morgan suggests that it could take two years if mortgage rates drop by 1 percentage point, assuming that home prices remained at all-time highs and wages continued rising at their current pace.


Markets
The Best U.S. Companies to Work for According to LinkedIn
We visualized the results of a LinkedIn study on the best U.S. companies to work for in 2024.
The Best U.S. Companies to Work for According to LinkedIn
This was originally posted on our Voronoi app. Download the app for free on iOS or Android and discover incredible data-driven charts from a variety of trusted sources.
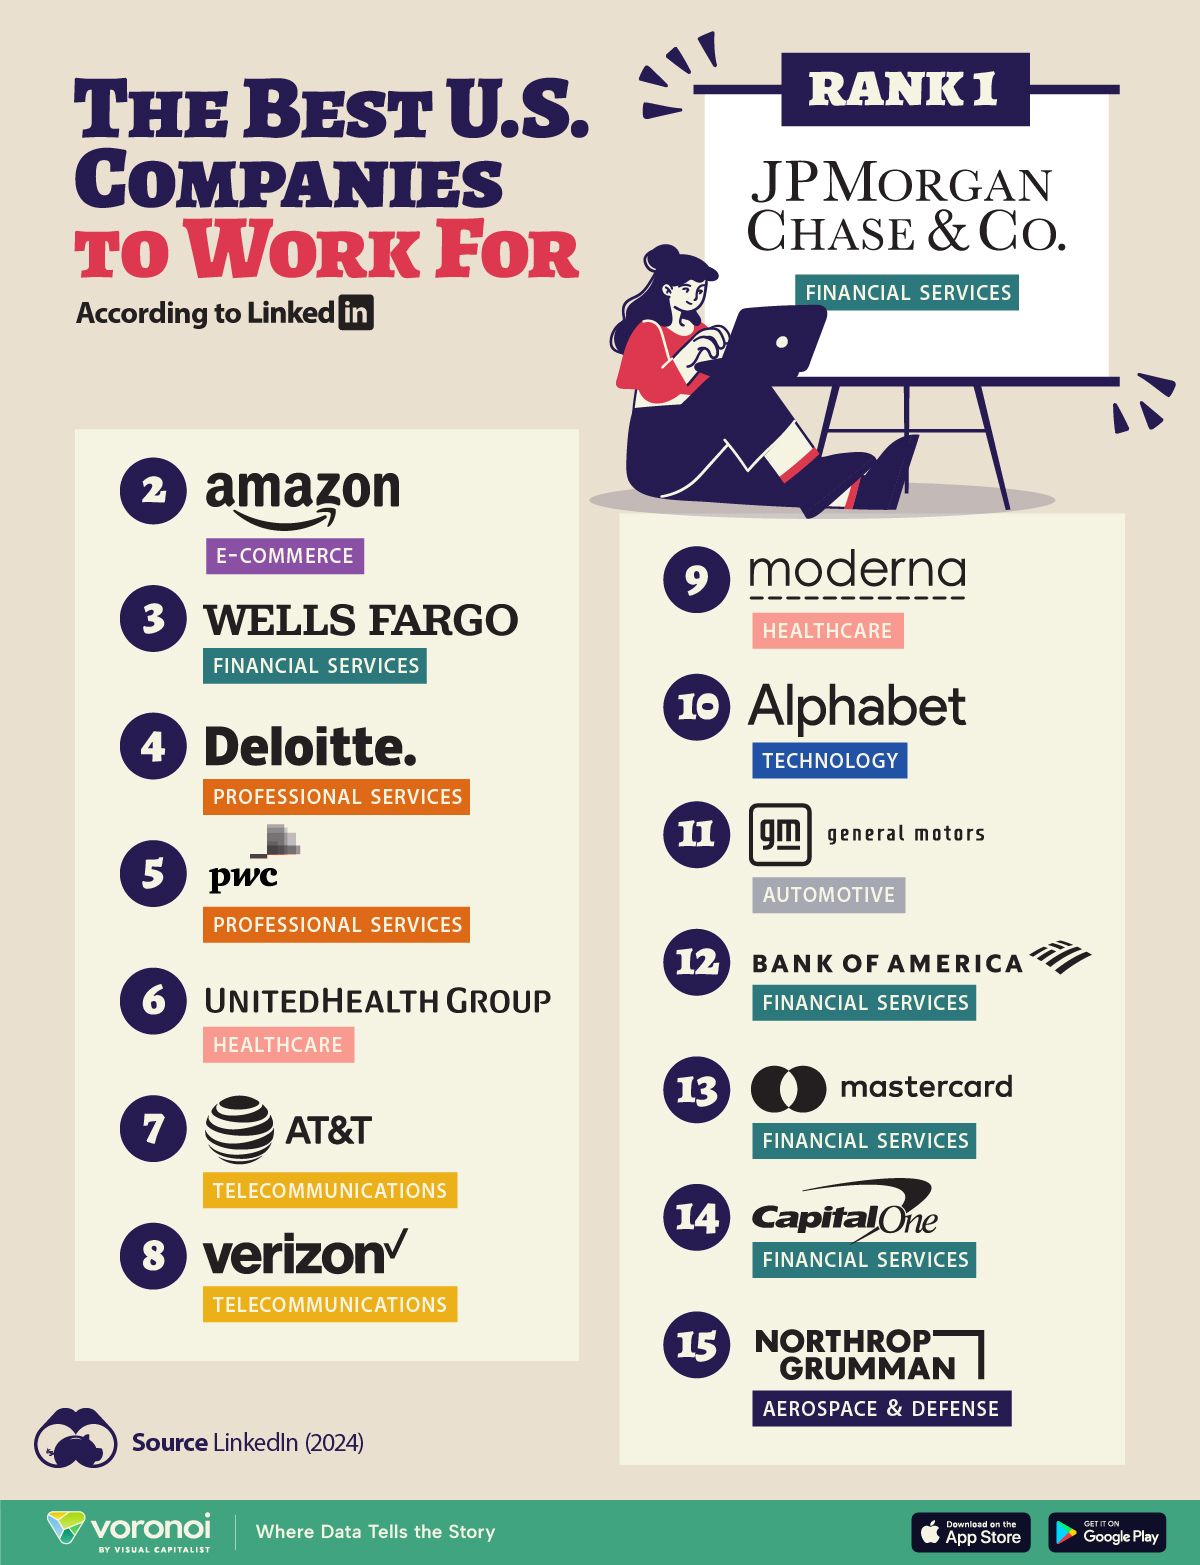
In this graphic, we list the 15 best U.S. companies to work for in 2024, according to LinkedIn data.
LinkedIn ranked companies based on eight pillars: ability to advance, skills growth, company stability, external opportunity, company affinity, gender diversity, educational background, and employee presence in the country.
To be eligible, companies must have had 5,000 or more global employees, with at least 500 in the country as of December 31, 2023.
Data and Highlights
Financial institutions dominate the ranking of the best U.S. companies to work for in 2024, with JP Morgan Chase & Co. ranking first.
| Rank | Company | Industry |
|---|---|---|
| 1 | JP Morgan Chase & Co. | Financial Services |
| 2 | Amazon | E-commerce |
| 3 | Wells Fargo | Financial Services |
| 4 | Deloitte | Professional Services |
| 5 | PwC | Professional Services |
| 6 | UnitedHealth Group | Healthcare |
| 7 | AT&T | Telecommunications |
| 8 | Verizon | Telecommunications |
| 9 | Moderna | Pharmaceuticals |
| 10 | Alphabet Inc. | Technology |
| 11 | General Motors | Automotive |
| 12 | Bank of America | Financial Services |
| 13 | Mastercard | Financial Services |
| 14 | Capital One | Financial Services |
| 15 | Northrop Grumman | Aerospace & Defense |
J.P. Morgan has a program that offers opportunities for candidates without a university degree. In fact, in 2022, 75% of job descriptions at the bank for experienced hires did not require a college degree.
Meanwhile, Deloitte and Amazon offer a variety of free training courses, including in AI.
Moderna includes in its employee package benefits to help avoid employee burnout — from subsidized commuter expenses and pop-up daycare centers, to wellness coaches.
Mastercard offers flexible work availability, with 11.5% remote and 89% hybrid options.
It’s also interesting to note that only Amazon and Alphabet made the cut from the ‘Magnificent Seven’ companies (Apple, Microsoft, Google parent Alphabet, Amazon, Nvidia, Meta Platforms, and Tesla).
See more about the best companies to work for in this infographic, which covers a separate ranking from Glassdoor.

-

 Demographics6 days ago
The Countries That Have Become Sadder Since 2010
-

 Green2 weeks ago
Ranked: The Countries With the Most Air Pollution in 2023
-

 Green2 weeks ago
Ranking the Top 15 Countries by Carbon Tax Revenue
-

 Markets2 weeks ago
U.S. Debt Interest Payments Reach $1 Trillion
-

 Mining2 weeks ago
Gold vs. S&P 500: Which Has Grown More Over Five Years?
-

 Energy2 weeks ago
The World’s Biggest Nuclear Energy Producers
-

 Misc2 weeks ago
How Hard Is It to Get Into an Ivy League School?
-

 Debt2 weeks ago
How Debt-to-GDP Ratios Have Changed Since 2000