Demographics
Ranked: Gen Z’s Favorite Brands, Compared with Older Generations


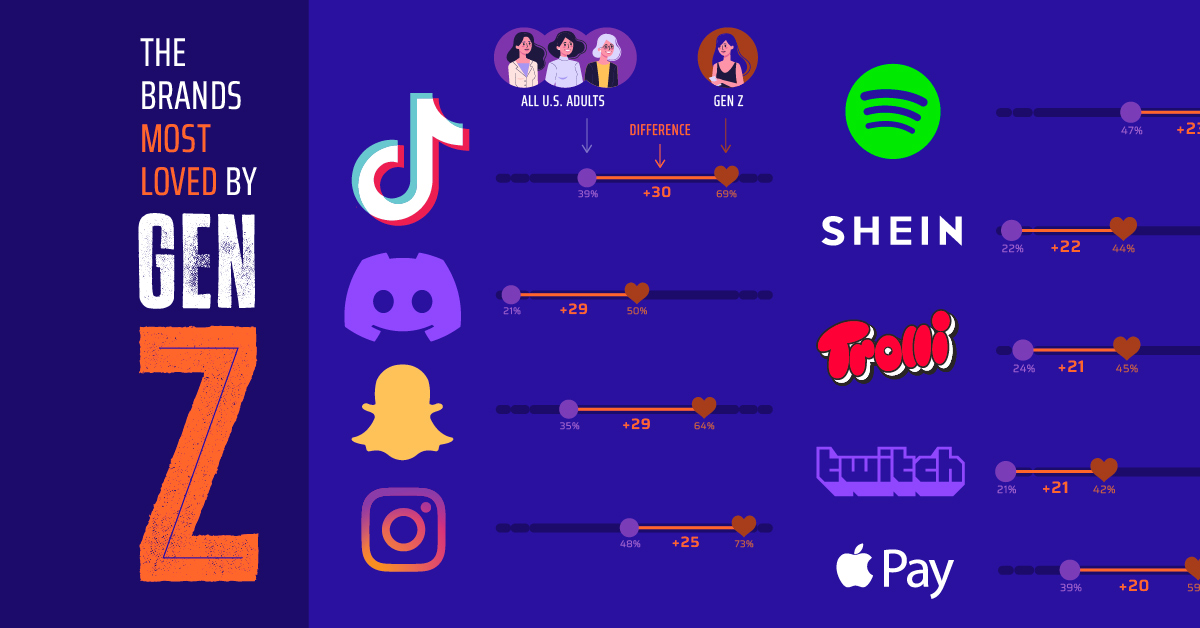
Gen Z’s Favorite Brands, Compared with Older Generations
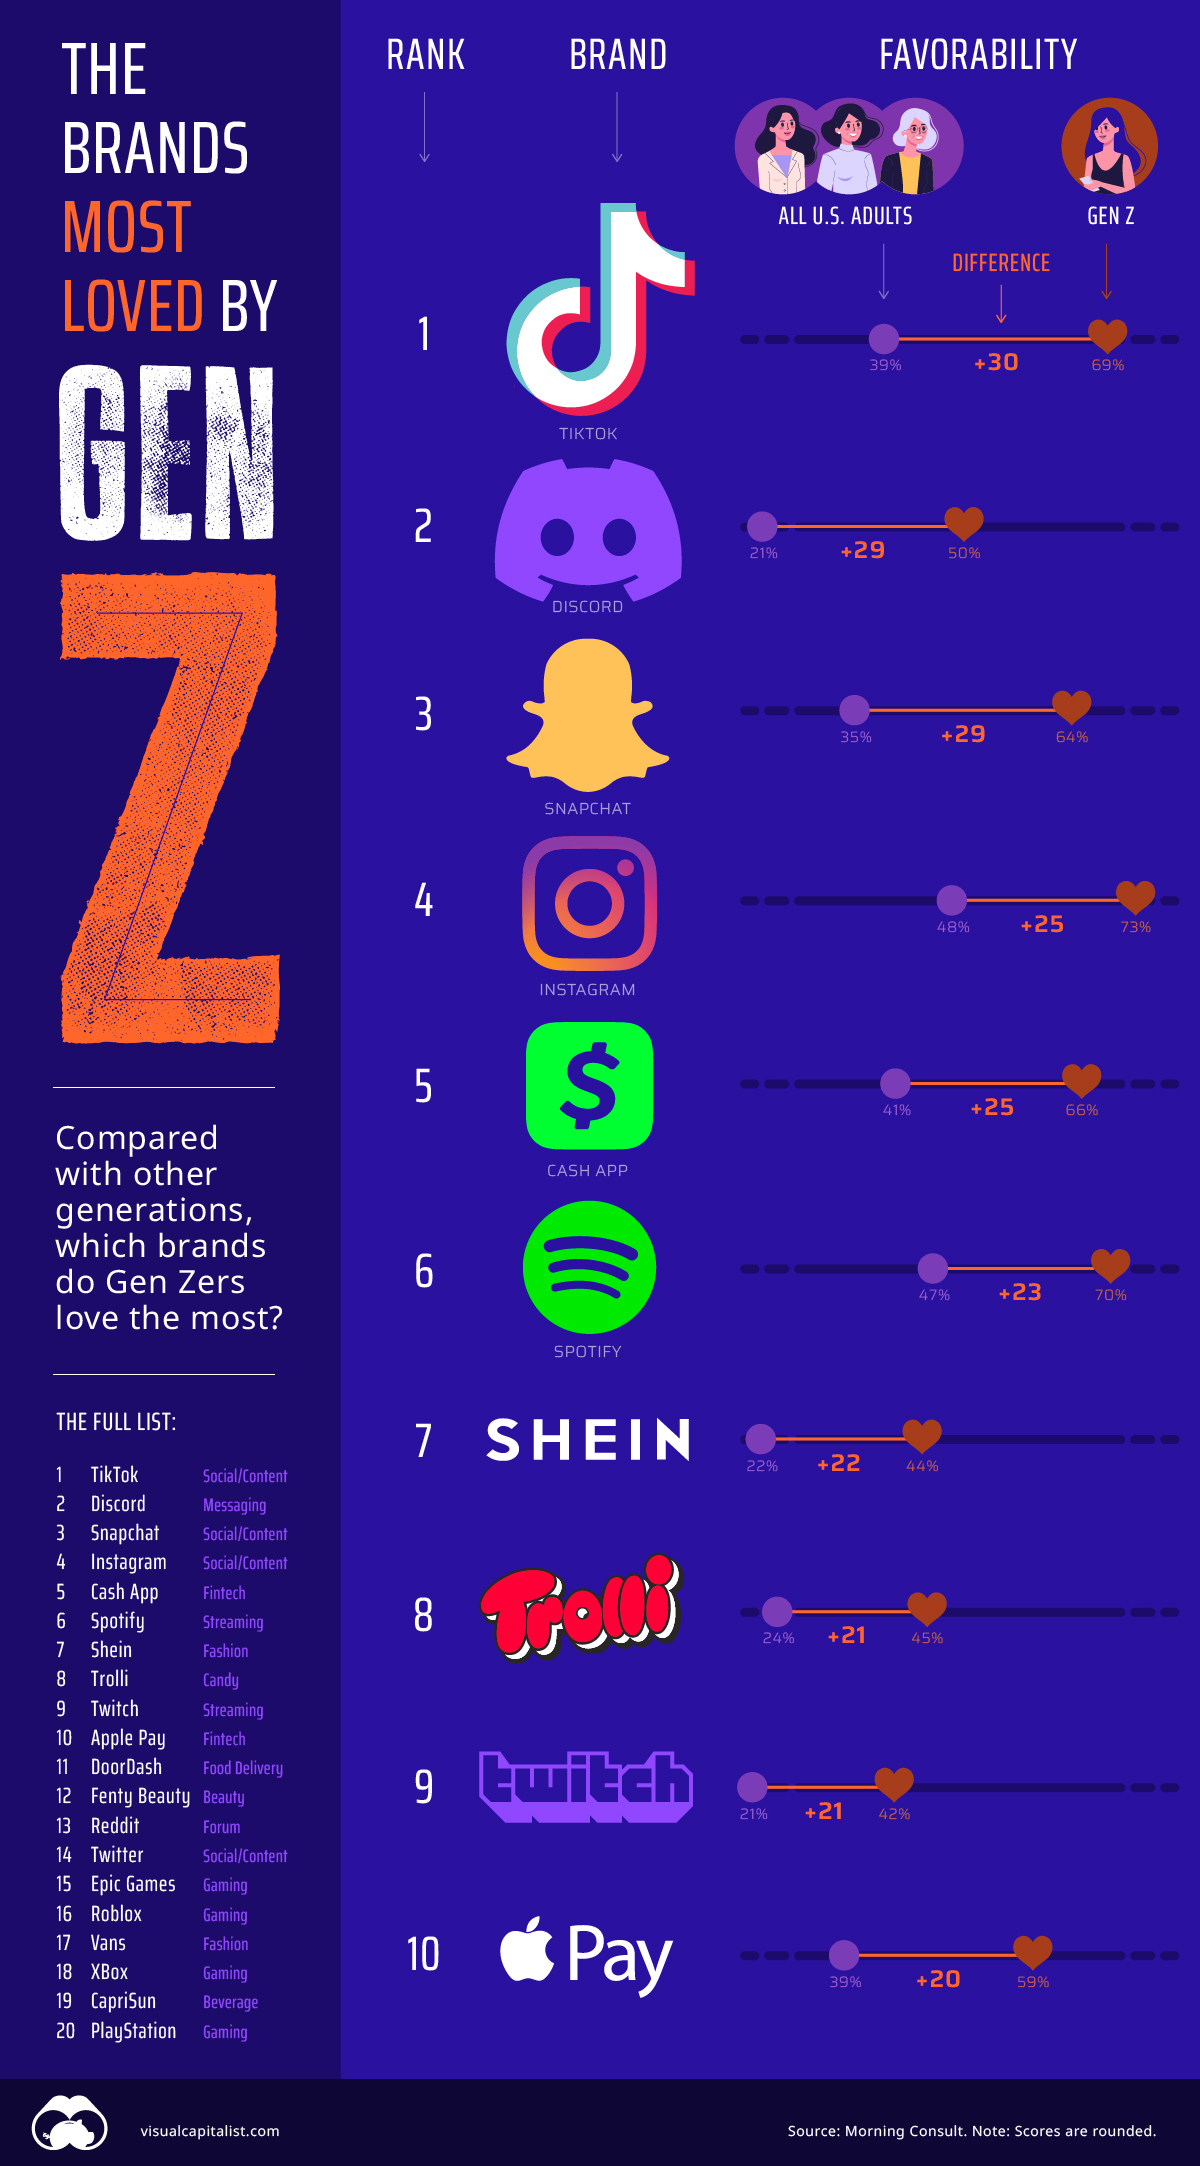
Generation Z’s favorite brands, in absolute terms, aren’t wildly different from preferences of other generations, with Walmart, Google, and Netflix ranking high. But when it comes to the brands that do the best with Gen Z compared to their elders, the list shakes up dramatically.
This ranking uses consumer preference data from Morning Consult to show which brands are favored considerably more by Gen Z when compared to the general public. A brand’s rank is determined by the difference in favorability between Gen Z’s survey responses and the average of all U.S. adult respondents.
Note: Gen Z is the generation born between 1997-2012. Favorability in this ranking is measured using the share of a generation who said they have a “very” or “somewhat” favorable opinion of said brand.
Brands Preferred by Gen Z
Compared to Millennials, Gen X, and Boomers, who may not care as much for these 20 brands, Gen Z—currently between 9-25 years old—loves them. Let’s dive in:
| Rank | Brand | Favorability Difference | U.S. Adult Favorability | Gen Z Favorability |
|---|---|---|---|---|
| #1 | TikTok | +30 | 39% | 69% |
| #2 | Discord | +29 | 21% | 50% |
| #3 | Snapchat | +29 | 35% | 64% |
| #4 | +25 | 48% | 73% | |
| #5 | Cash App | +25 | 41% | 66% |
| #6 | Spotify | +23 | 47% | 70% |
| #7 | Shein | +22 | 22% | 44% |
| #8 | Trolli | +21 | 24% | 45% |
| #9 | Twitch | +21 | 21% | 42% |
| #10 | Apple Pay | +20 | 39% | 59% |
| #11 | DoorDash | +18.7 | 46.7% | 65.5% |
| #12 | Fenty Beauty | +18.6 | 17.1% | 35.7% |
| #13 | +17.8 | 33.0% | 50.7% | |
| #14 | +17.3 | 33.7% | 50.9% | |
| #15 | Epic Games | +17.1 | 24.9% | 42.0% |
| #16 | Roblox | +16.8 | 22.0% | 38.7% |
| #17 | Vans | +16.5 | 51.7% | 68.2% |
| #18 | Xbox | +16.4 | 48.4% | 64.8% |
| #19 | Capri Sun | +16.2 | 60.4% | 76.6% |
| #20 | PlayStation | +15.9 | 56.4% | 72.2% |
Note: Differences may not add up exactly due to rounding.
Unsurprisingly, TikTok takes the top spot. The app that is frequently used to poke fun at older generations and that in many ways is a reflection of Gen Z culture, is 30 points more favorable with the young generation than others.
Members of Gen Z are the first true “digital natives”—meaning they were raised in the age of digital technology. As a result, many of their favorite brands are either some kind of social media platform and/or digital service, like Apple Pay, Snapchat, or Spotify. In fact, eight of Gen Z’s top 10 favorites on the above list are digital brands.
Another distinguishing feature of consumers in this generation is that they’re more likely to care about brand ethics and sustainable consumption than other generations.
However, one brand among their top 20 that defies that sentiment is the Chinese clothing company, Shein. This fast fashion company’s model promotes a culture of mass clothing hauls and thus, clothing waste—making it far from environmentally conscious. Shein has also come under fire recently for violating labor laws in its Chinese production facilities. And yet 44% of Gen Zs have a good impression of the brand, and it particularly does well with Gen Z women.
Interestingly, members of Gen Z in the U.S. are also the first cohort to have strong awareness of Chinese brands more generally.
Gen Z vs. Millennials
Two generations that are often lumped together, Gen Z and Millennials have some considerable differences when it comes to their favorite brands. Here’s a brief look at some of the brands that do better with Gen Z compared to Millennials specifically, using favorability difference:
- TikTok: 14.2
- Crocs: 13.4
- Pixar: 8.1
- Morphe: 6.1
Compared to their generational neighbors, one interesting standout is Crocs—the utilitarian, but highly-customizable foam clogs—which almost 60% of Gen Zs see as favorable compared to only 46% of Millennials.
Gen Z’s Favorite Brands Overall
While Gen Z differentiates itself from the older generations in many ways, a lot of the overall favorites still align with everyone else’s.
| Rank | Brand | Favorability |
|---|---|---|
| #1 | YouTube | 86.2% |
| #2 | 83.9% | |
| #3 | Netflix | 82.2% |
| #4 | Amazon | 80.3% |
| #5 | M&Ms | 79.8% |
| #6 | Walmart | 79.8% |
| #7 | Target | 79.7% |
| #8 | Doritos | 79.3% |
| #9 | Kit Kat | 79.0% |
| #10 | Oreo | 78.6% |
| #11 | Gatorade | 78.5% |
| #12 | Nike | 78.4% |
| #13 | Cheetos | 77.5% |
| #14 | Dollar Tree | 77.4% |
| #15 | Sprite | 77.4% |
| #16 | Pringles | 76.7% |
| #17 | Capri Sun | 76.6% |
| #18 | Pixar | 76.6% |
| #19 | Skittles | 76.3% |
| #20 | Apple | 75.9% |
Removing the favorability difference score reveals that many of the most popular brands overall still win out, such as Netflix, Google, and Amazon.
Gen Z Trends
Overall, the report found that it’s hard for brands to win with Gen Z. Across all brands that were scored, 33% of the general American public rated them as favorable, but for Gen Z respondents the number dropped to 27%.
In general, Gen Z tends to value conscious consumption and subsequently, brands that can meet those expectations. Digital services and products also do well with this generation that has never known a world without internet.
As more and more Gen Zers enter the labor market and grow their consumer power, they will be an important generation to watch.


Demographics
The Countries That Have Become Sadder Since 2010
Tracking Gallup survey data for more than a decade reveals some countries are witnessing big happiness declines, reflecting their shifting socio-economic conditions.


The Countries That Have Become Sadder Since 2010
This was originally posted on our Voronoi app. Download the app for free on iOS or Android and discover incredible data-driven charts from a variety of trusted sources.
Can happiness be quantified?
Some approaches that try to answer this question make a distinction between two differing components of happiness: a daily experience part, and a more general life evaluation (which includes how people think about their life as a whole).
The World Happiness Report—first launched in 2012—has been making a serious go at quantifying happiness, by examining Gallup poll data that asks respondents in nearly every country to evaluate their life on a 0–10 scale. From this they extrapolate a single “happiness score” out of 10 to compare how happy (or unhappy) countries are.
More than a decade later, the 2024 World Happiness Report continues the mission. Its latest findings also include how some countries have become sadder in the intervening years.
Which Countries Have Become Unhappier Since 2010?
Afghanistan is the unhappiest country in the world right now, and is also 60% unhappier than over a decade ago, indicating how much life has worsened since 2010.
In 2021, the Taliban officially returned to power in Afghanistan, after nearly two decades of American occupation in the country. The Islamic fundamentalist group has made life harder, especially for women, who are restricted from pursuing higher education, travel, and work.
On a broader scale, the Afghan economy has suffered post-Taliban takeover, with various consequent effects: mass unemployment, a drop in income, malnutrition, and a crumbling healthcare system.
| Rank | Country | Happiness Score Loss (2010–24) | 2024 Happiness Score (out of 10) |
|---|---|---|---|
| 1 | 🇦🇫 Afghanistan | -2.6 | 1.7 |
| 2 | 🇱🇧 Lebanon | -2.3 | 2.7 |
| 3 | 🇯🇴 Jordan | -1.5 | 4.2 |
| 4 | 🇻🇪 Venezuela | -1.3 | 5.6 |
| 5 | 🇲🇼 Malawi | -1.2 | 3.4 |
| 6 | 🇿🇲 Zambia | -1.2 | 3.5 |
| 7 | 🇧🇼 Botswana | -1.2 | 3.4 |
| 8 | 🇾🇪 Yemen | -1.0 | 3.6 |
| 9 | 🇪🇬 Egypt | -1.0 | 4.0 |
| 10 | 🇮🇳 India | -0.9 | 4.1 |
| 11 | 🇧🇩 Bangladesh | -0.9 | 3.9 |
| 12 | 🇨🇩 DRC | -0.7 | 3.3 |
| 13 | 🇹🇳 Tunisia | -0.7 | 4.4 |
| 14 | 🇨🇦 Canada | -0.6 | 6.9 |
| 15 | 🇺🇸 U.S. | -0.6 | 6.7 |
| 16 | 🇨🇴 Colombia | -0.5 | 5.7 |
| 17 | 🇵🇦 Panama | -0.5 | 6.4 |
| 18 | 🇵🇰 Pakistan | -0.5 | 4.7 |
| 19 | 🇿🇼 Zimbabwe | -0.5 | 3.3 |
| 20 | 🇮🇪 Ireland | -0.5 | 6.8 |
| N/A | 🌍 World | +0.1 | 5.5 |
Nine countries in total saw their happiness score drop by a full point or more, on the 0–10 scale.
Noticeably, many of them have seen years of social and economic upheaval. Lebanon, for example, has been grappling with decades of corruption, and a severe liquidity crisis since 2019 that has resulted in a banking system collapse, sending poverty levels skyrocketing.
In Jordan, unprecedented population growth—from refugees leaving Iraq and Syria—has aggravated unemployment rates. A somewhat abrupt change in the line of succession has also raised concerns about political stability in the country.

-

 Markets1 week ago
U.S. Debt Interest Payments Reach $1 Trillion
-

 Business2 weeks ago
Charted: Big Four Market Share by S&P 500 Audits
-

 Real Estate2 weeks ago
Ranked: The Most Valuable Housing Markets in America
-

 Money2 weeks ago
Which States Have the Highest Minimum Wage in America?
-

 AI2 weeks ago
Ranked: Semiconductor Companies by Industry Revenue Share
-

 Markets2 weeks ago
Ranked: The World’s Top Flight Routes, by Revenue
-

 Demographics2 weeks ago
Population Projections: The World’s 6 Largest Countries in 2075
-

 Markets2 weeks ago
The Top 10 States by Real GDP Growth in 2023