Globalization
Charted: India’s FDI Inflows Over the Last 20+ Years
India’s FDI Inflows Over the Last 20+ Years
In 2022, India ranked 10th in top destinations for foreign direct investment (FDI), a culmination of decades of economic and policy reforms.
We visualize how India’s FDI inflows have increased since 1999–2000, using data sourced from the Reserve Bank of India, and sourced from S&P Global. Data is current up to financial year 2022–2023, which ended March 2023.
India’s FDI Journey Between 2000 And 2023
Facing a severe balance of payments crisis in 1991, the Indian economy liberalized with a slew of economic reforms aimed at reducing import tariffs and “opening up” sectors to foreign investment.
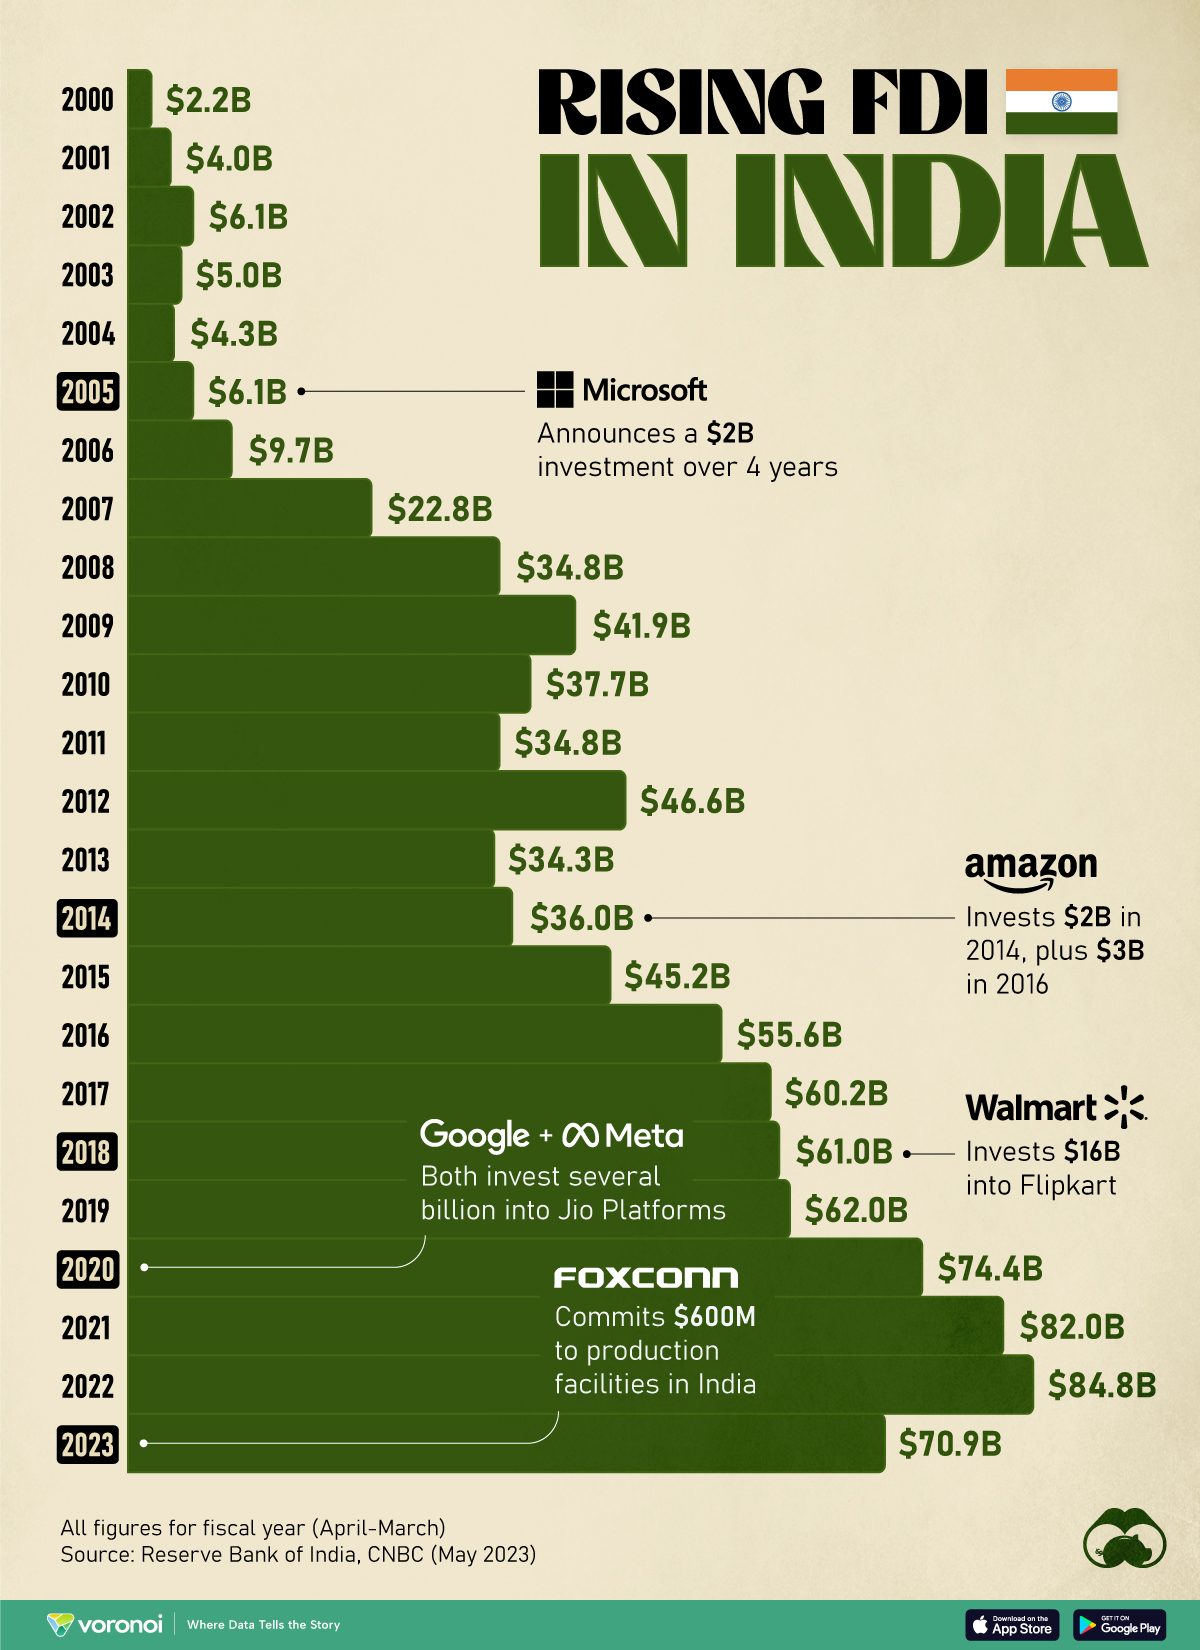
As a result, foreign direct investment to the country trended upwards, gathering steam at the start of the new century. India’s FDI inflows rocketed from $2.2 billion in 1999–2000 to more than $22 billion in 2006–2007, mirroring the country’s rapid economic growth.
In the midst of the subprime crisis and the global recession, investment to the country stayed resilient due to the country’s vast, and fairly insulated, domestic market.
Here’s a look at India’s FDI inflows over the last two decades.
| Year | India's FDI Inflows |
|---|---|
| FY 1999–00 | $2.2B |
| FY 2000–01 | $4.0B |
| FY 2001–02 | $6.1B |
| FY 2002–03 | $5.0B |
| FY 2003–04 | $4.3B |
| FY 2004–05 | $6.1B |
| FY 2005–06 | $9.7B |
| FY 2006–07 | $22.8B |
| FY 2007–08 | $34.8B |
| FY 2008–09 | $41.9B |
| FY 2009–10 | $37.7B |
| FY 2010–11 | $34.8B |
| FY 2011–12 | $46.6B |
| FY 2012–13 | $34.3B |
| FY 2013–14 | $36.0B |
| FY 2014–15 | $45.2B |
| FY 2015–16 | $55.6B |
| FY 2016–17 | $60.2B |
| FY 2017–18 | $61.0B |
| FY 2018–19 | $62.0B |
| FY 2019–20 | $74.4B |
| FY 2020–21 | $82.0B |
| FY 2021–22 | $84.8B |
| FY 2022–23 | $70.9B |
Note: India’s financial year runs from April–March.
Looking to capitalize on the country’s burgeoning demand, global brands have made increasingly large plays into the country’s economy. Some notable investments of the last decade include:
- 2014: Amazon invests $2B into country operations in 2014, plus $3B in 2016.
- 2018: Walmart invests $16B into Flipkart—an Indian e-commerce platform.
- 2020: Google & Meta invest $4.5B and $5.7B respectively into India’s largest telecom provider, Jio Platforms.
- 2023: Foxconn commits $600M to production facilities in India.
This has been boosted by the government’s continued push to liberalize it’s FDI laws. For example, in 2021, the government did away with FDI caps in the country’s telecom, oil, and defense industries.
The country’s top five sources of FDI inflows include Mauritius, Singapore, and the United States. As for China, despite being a large trading partner, the country’s investments in India have been impacted by a 2020 ruling necessitating additional screening for FDI investments from bordering countries.
Top Indian States To Receive FDI Inflows
It’s also important to note that India’s FDI flows are not distributed equally across the country.
Just three Indian states: Maharashtra, Karnataka, and Gujarat, became the destination of 70% of the $70.9 billion foreign investment between April 2022 and March 2023.
This also mirrors the inequality in what sectors the incoming FDI is chasing.
Two sectors—services (Banking, Finance, Insurance ) and tech account for one-third of all FDI inflows. Despite the government’s flagship “Make in India” campaign (2014), manufacturing (excluding automobile manufacturing) is still not a top-five sector for foreign investors.


Politics
Charted: How Much Do Countries Trust the United Nations?
Which countries trust the United Nations to do the right thing the most, and the least?
How Much Do Countries Trust the United Nations?
This was originally posted on our Voronoi app. Download the app for free on iOS or Android and discover incredible data-driven charts from a variety of trusted sources.
Do you trust the United Nations (UN) in carrying out its objectives of maintaining peace and security, protecting human rights, and upholding international law?
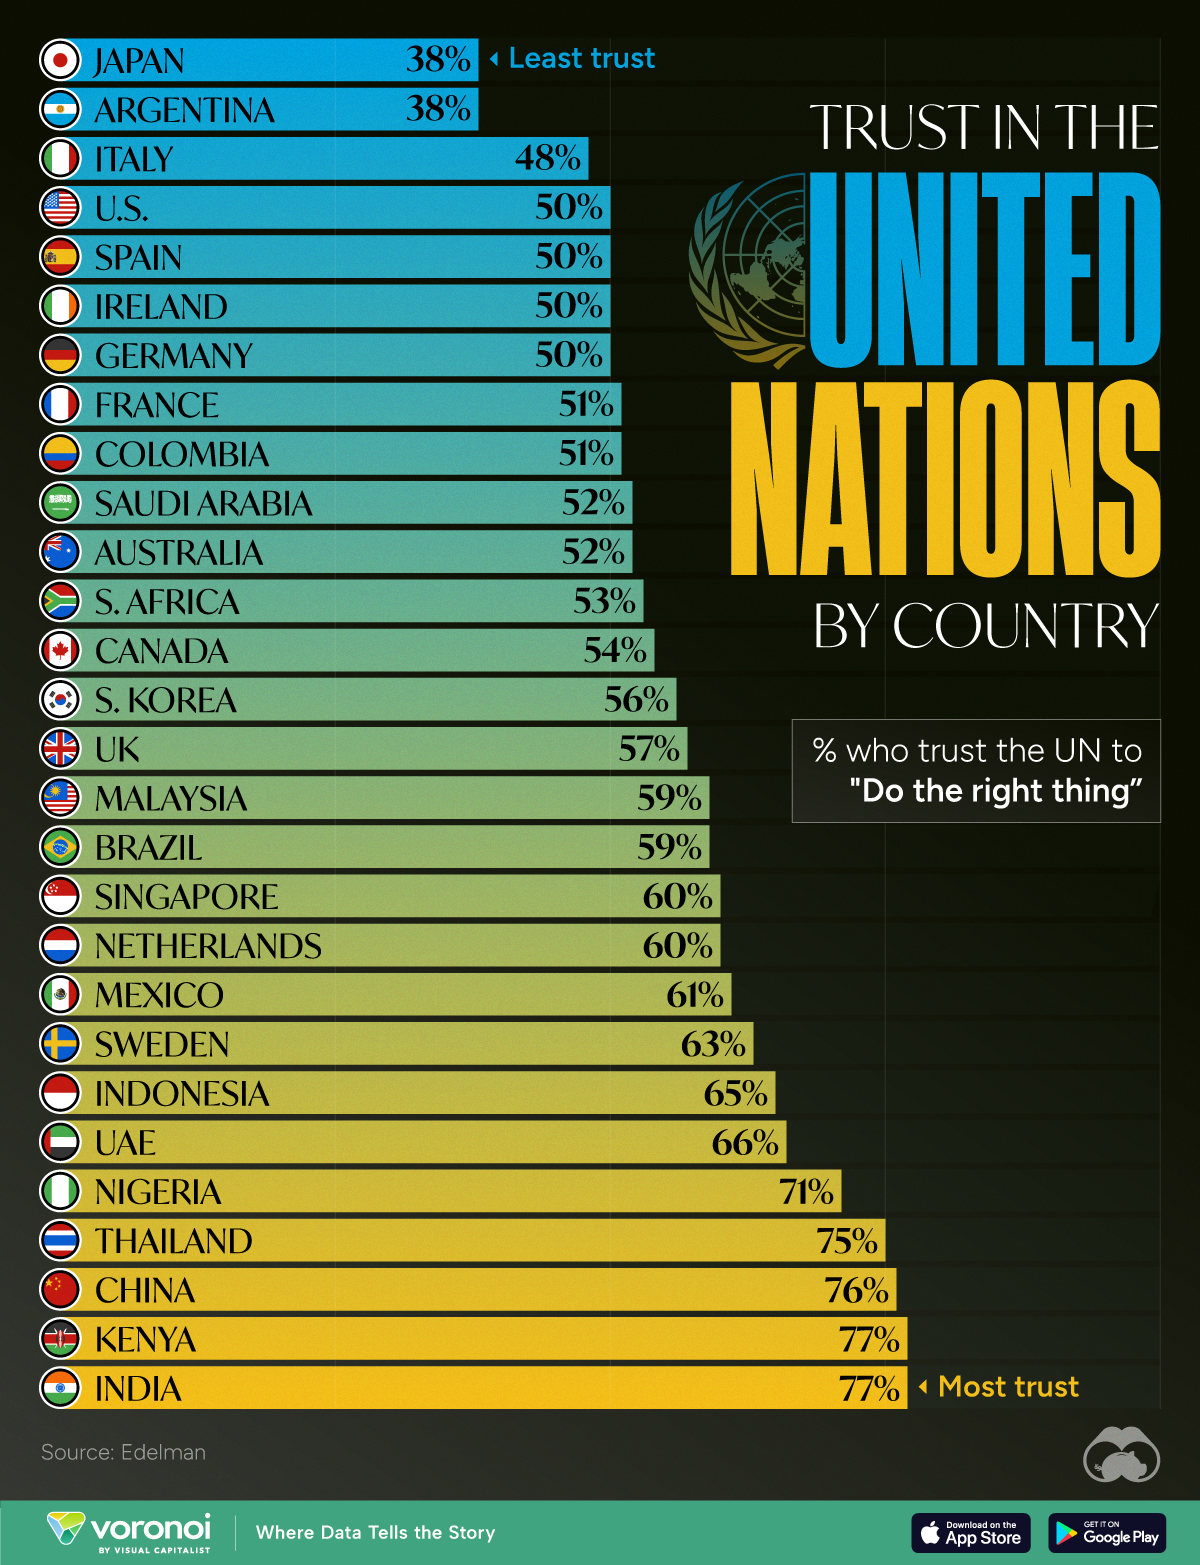
Survey results from Edelman’s 2024 Trust Barometer Global Report show that some countries’ citizens believe strongly in the UN to “do the right thing,” while others are less trusting.
Ranked: 28 Countries Trust Levels in the United Nations in 2024
To gauge trust in the United Nations, Edelman surveyed more than 32,000 respondents between 28 countries in November 2023. Each country sample of 1,150 people is statistically significant and representative.
According to the results, respondents from Japan and Argentina had the least amount of trust in the UN when it came to “doing the right thing.”
| Country | % who trust the UN to "Do the right thing" |
|---|---|
| 🇯🇵 Japan | 38% |
| 🇦🇷 Argentina | 38% |
| 🇮🇹 Italy | 48% |
| 🇺🇸 U.S. | 50% |
| 🇪🇸 Spain | 50% |
| 🇮🇪 Ireland | 50% |
| 🇩🇪 Germany | 50% |
| 🇫🇷 France | 51% |
| 🇨🇴 Colombia | 51% |
| 🇸🇦 Saudi Arabia | 52% |
| 🇦🇺 Australia | 52% |
| 🇿🇦 South Africa | 53% |
| 🇨🇦 Canada | 54% |
| 🇰🇷 South Korea | 56% |
| 🇬🇧 UK | 57% |
| 🇲🇾 Malaysia | 59% |
| 🇧🇷 Brazil | 59% |
| 🇸🇬 Singapore | 60% |
| 🇳🇱 Netherlands | 60% |
| 🇲🇽 Mexico | 61% |
| 🇸🇪 Sweden | 63% |
| 🇮🇩 Indonesia | 65% |
| 🇦🇪 UAE | 66% |
| 🇳🇬 Nigeria | 71% |
| 🇹🇭 Thailand | 75% |
| 🇨🇳 China | 76% |
| 🇰🇪 Kenya | 77% |
| 🇮🇳 India | 77% |
Just 38% of Japanese and Argentinian people had faith in the UN, by far the lowest levels of trust. Only one other country was below the 50% trust mark: Italy at 48%.
Many major economies and G7 countries had trust levels hovering between 50–60%, including the U.S. and Germany at 50% and the UK at 57%.
Meanwhile, India and Kenya had the highest levels of trust in the UN at 77%, with China right behind at 76%. In general, African and Asian nations tended to have higher levels of trust in the UN, though there were exceptions like South Africa (53%) and South Korea (56%)
It’s also worth noting that views within countries can differ significantly. Separate data on this topic from Pew Research shows that public opinion of the UN is split along ideological lines. In the U.S., there’s a 45 percentage point difference, with more conservative respondents having significantly lower trust in the UN.

-

 Science1 week ago
Visualizing the Average Lifespans of Mammals
-

 Markets2 weeks ago
The Top 10 States by Real GDP Growth in 2023
-

 Demographics2 weeks ago
The Smallest Gender Wage Gaps in OECD Countries
-

 United States2 weeks ago
Where U.S. Inflation Hit the Hardest in March 2024
-

 Green2 weeks ago
Top Countries By Forest Growth Since 2001
-

 United States2 weeks ago
Ranked: The Largest U.S. Corporations by Number of Employees
-

 Maps2 weeks ago
The Largest Earthquakes in the New York Area (1970-2024)
-

 Green2 weeks ago
Ranked: The Countries With the Most Air Pollution in 2023