Money
Ranked: Top Countries for Foreign Direct Investment Flows
Article/Editing:
One of the most significant phenomena in 21st-century globalization, driven by the ascent of multinational corporations and the removal of investing barriers, is the vast cross-border flow of foreign capital.
To analyze recent trends, Samidha Nayak utilized World Bank data spanning 2012–2022, charting the top 10 destinations for foreign direct investment (FDI) and the leading investing countries annually.
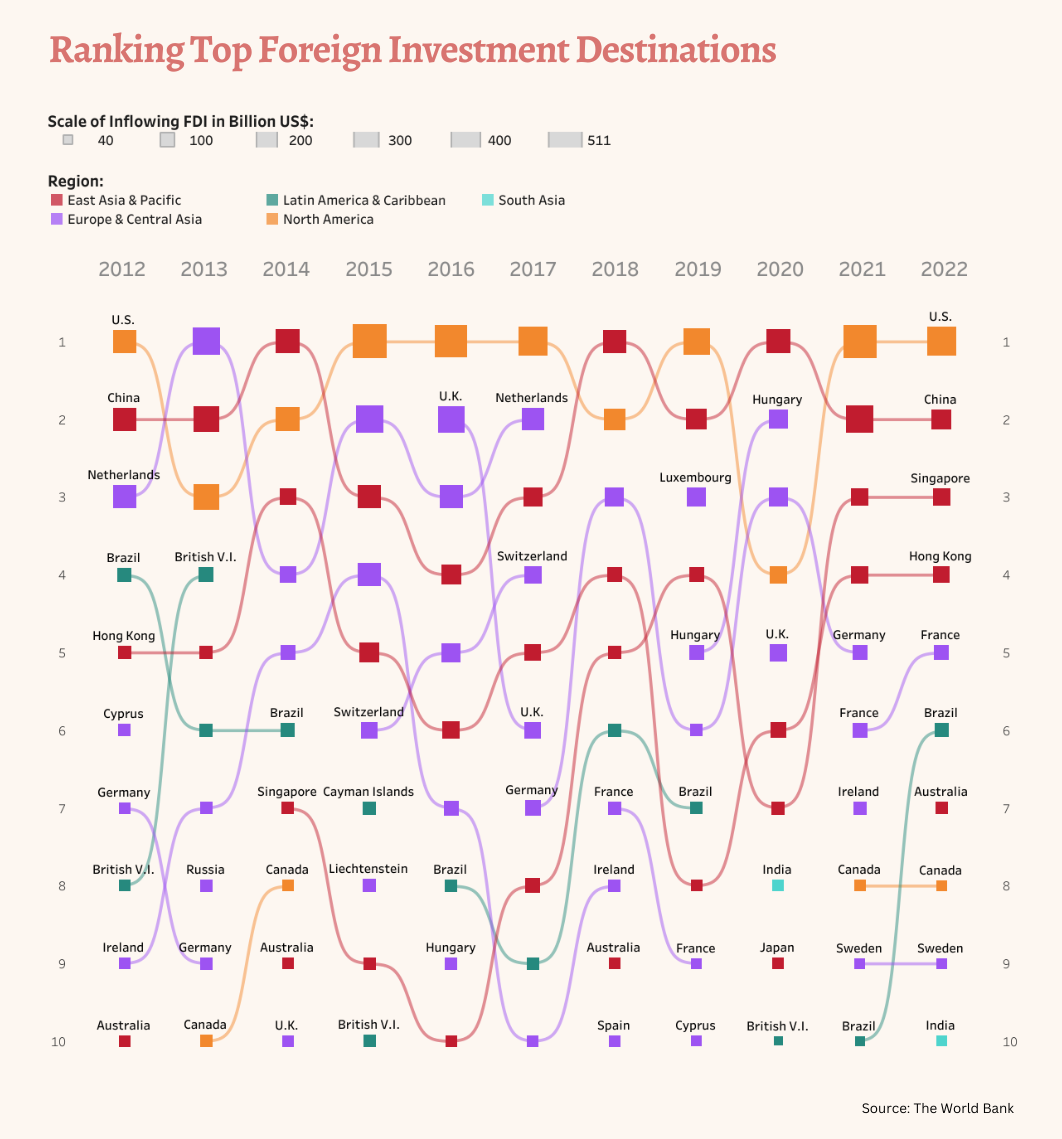
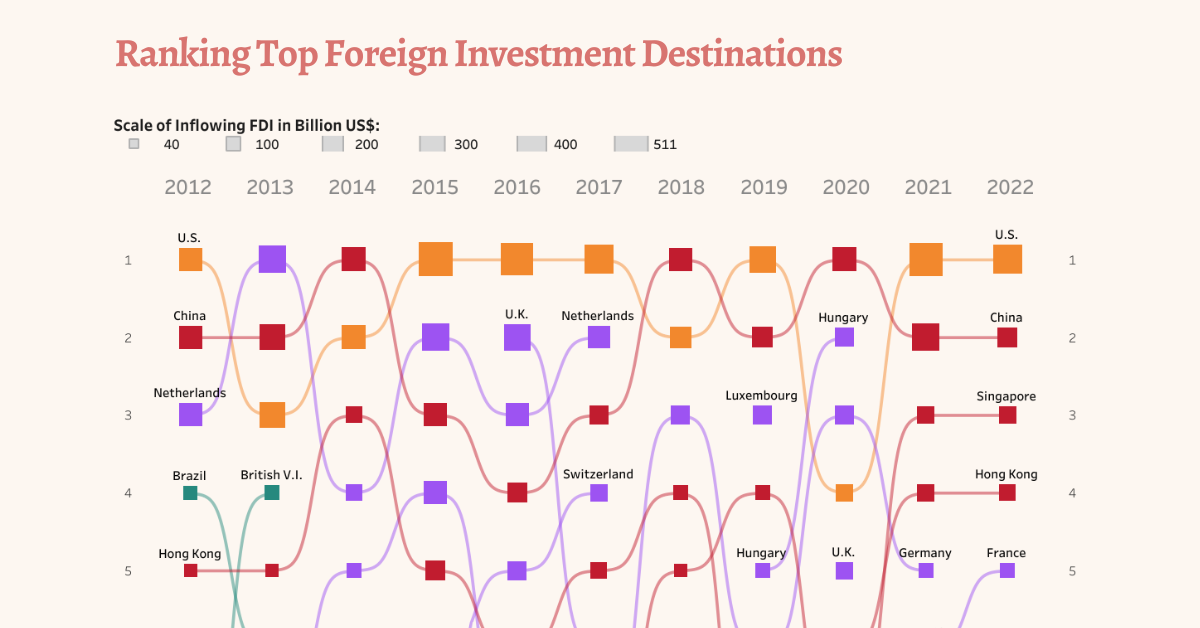
Countries With the Most FDI Inflows (2012–2022)
In 2012, the United States had the highest FDI inflow, attracting about $250 billion in investment from the rest of the world.
At second place, China’s FDI inflows stood about $9 billion lower at $241 billion.
The middle ranks have representatives from Europe (Netherlands, Cyprus), from Asia (Hong Kong) and from South America (Brazil).
Towards the bottom, three OECD countries—Germany, Ireland, and Australia—all attracted an average of $60 billion in foreign investment.
Unexpectedly, the British Virgin Islands came in 8th. Their lack of corporate tax makes it a popular place for companies to headquarter, in turn attracting FDI inflows.
| 2012 | Country | 2012 Inflows (USD Billion) | 2022 | Country | 2022 Inflows (USD Billion) |
|---|---|---|---|---|---|
| 1 | 🇺🇸 U.S. | $250.35 | 1 | 🇺🇸 U.S. | $388.08 |
| 2 | 🇨🇳 China | $241.21 | 2 | 🇨🇳 China | $180.17 |
| 3 | 🇳🇱 Netherlands | $239.67 | 3 | 🇸🇬 Singapore | $140.84 |
| 4 | 🇧🇷 Brazil | $92.57 | 4 | 🇭🇰 Hong Kong | $120.95 |
| 5 | 🇭🇰 Hong Kong | $74.89 | 5 | 🇫🇷 France | $105.42 |
| 6 | 🇨🇾 Cyprus | $69.97 | 6 | 🇧🇷 Brazil | $91.50 |
| 7 | 🇩🇪 Germany | $65.44 | 7 | 🇦🇺 Australia | $67.12 |
| 8 | 🇻🇬 British Virgin Islands | $61.12 | 8 | 🇨🇦 Canada | $53.71 |
| 9 | 🇮🇪 Ireland | $58.09 | 9 | 🇸🇪 Sweden | $50.05 |
| 10 | 🇦🇺 Australia | $57.55 | 10 | 🇮🇳 India | $49.94 |
Ten years later however, the top 10 saw a shuffle. The U.S. and China retained their top spots, but the difference grew much larger—with the U.S. attracting nearly 50% more foreign investment ($388 billion) than China ($180 billion).
Singapore, which first appeared in the rankings in 2014, took third place with $141 billion.
Meanwhile the bottom half changed almost entirely with France, Canada, Sweden, and India replacing Cyprus, Germany, the British Virgin Islands, and Ireland.
Countries With the Most FDI Outflows (2012–2022)
Unlike the ranks of net inflows, the top 10 countries with the highest FDI outflows have stayed essentially the same.
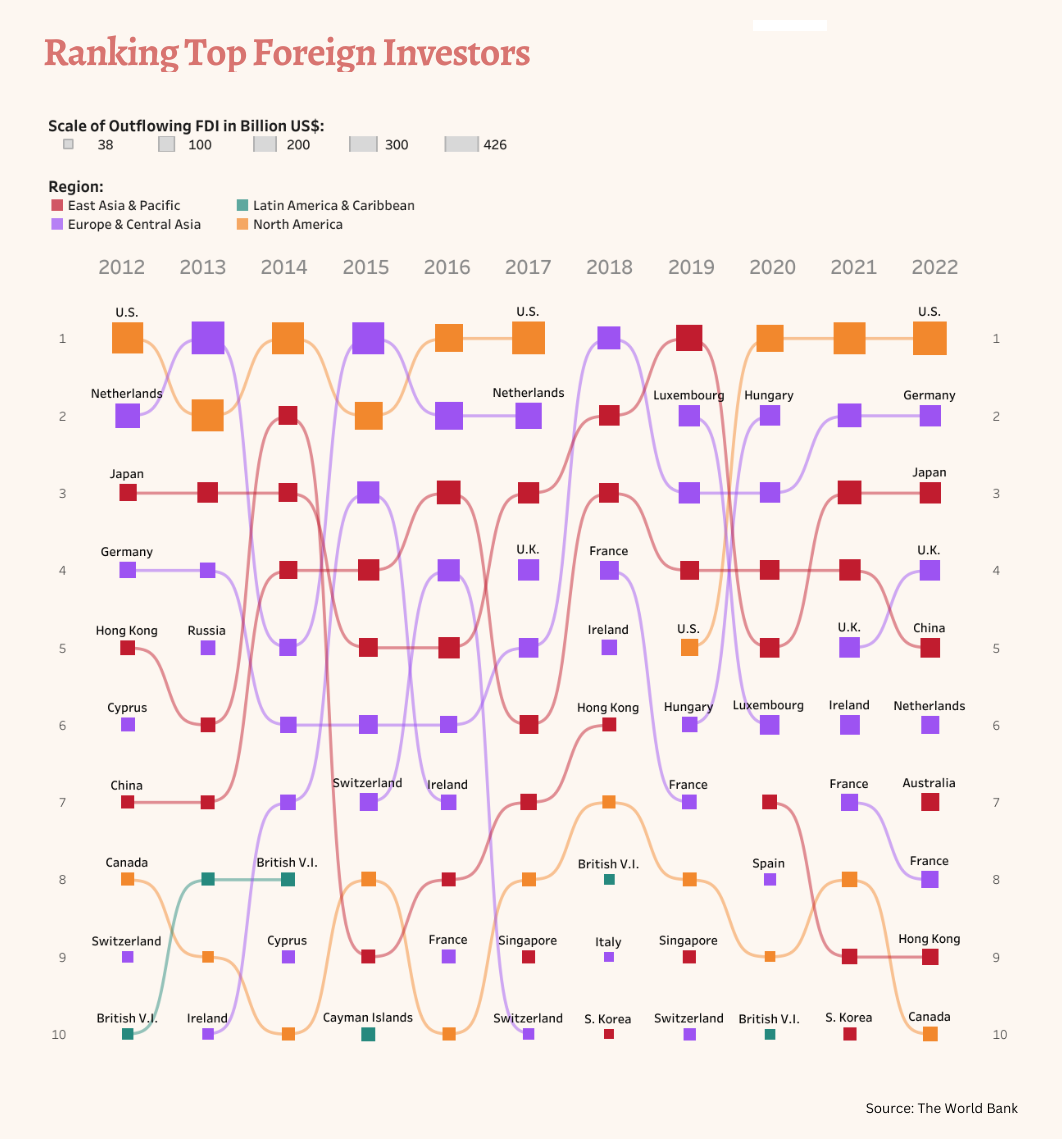
The U.S. topped the list in both ends of the decade, despite briefly falling out of the top 10 entirely in 2018. There were only three new entrants (France, Australia, and the UK) in 2022 compared to 10 years prior, with Cyprus, Switzerland, and the British Virgin Islands dropping out of top spots.
| 2012 | Country | 2012 Outflows (USD Billion) | 2022 | Country | 2022 Outflows (USD Billion) |
|---|---|---|---|---|---|
| 1 | 🇺🇸 U.S. | $377.24 | 1 | 🇺🇸 U.S. | $426.25 |
| 2 | 🇳🇱 Netherlands | $237.94 | 2 | 🇩🇪 Germany | $178.87 |
| 3 | 🇯🇵 Japan | $117.63 | 3 | 🇯🇵 Japan | $175.40 |
| 4 | 🇩🇪 Germany | $99.08 | 4 | 🇬🇧 UK | $158.93 |
| 5 | 🇭🇰 Hong Kong | $88.12 | 5 | 🇨🇳 China | $149.69 |
| 6 | 🇨🇾 Cyprus | $75.25 | 6 | 🇳🇱 Netherlands | $125.89 |
| 7 | 🇨🇳 China | $64.96 | 7 | 🇦🇺 Australia | $123.36 |
| 8 | 🇨🇦 Canada | $62.25 | 8 | 🇫🇷 France | $118.76 |
| 9 | 🇨🇭Switzerland | $54.30 | 9 | 🇭🇰 Hong Kong | $106.86 |
| 10 | 🇻🇬 British Virgin Islands | $53.94 | 10 | 🇨🇦 Canada | $83.11 |
Many of the countries who are in the top ranks for inflows (U.S., China, Canada, Australia) are also in the top ranks for outflows both in 2012 and 2022.

This article was published as a part of Visual Capitalist's Creator Program, which features data-driven visuals from some of our favorite Creators around the world.


Money
Charted: Which City Has the Most Billionaires in 2024?
Just two countries account for half of the top 20 cities with the most billionaires. And the majority of the other half are found in Asia.


Charted: Which Country Has the Most Billionaires in 2024?
This was originally posted on our Voronoi app. Download the app for free on iOS or Android and discover incredible data-driven charts from a variety of trusted sources.
Some cities seem to attract the rich. Take New York City for example, which has 340,000 high-net-worth residents with investable assets of more than $1 million.
But there’s a vast difference between being a millionaire and a billionaire. So where do the richest of them all live?
Using data from the Hurun Global Rich List 2024, we rank the top 20 cities with the highest number of billionaires in 2024.
A caveat to these rich lists: sources often vary on figures and exact rankings. For example, in last year’s reports, Forbes had New York as the city with the most billionaires, while the Hurun Global Rich List placed Beijing at the top spot.
Ranked: Top 20 Cities with the Most Billionaires in 2024
The Chinese economy’s doldrums over the course of the past year have affected its ultra-wealthy residents in key cities.
Beijing, the city with the most billionaires in 2023, has not only ceded its spot to New York, but has dropped to #4, overtaken by London and Mumbai.
| Rank | City | Billionaires | Rank Change YoY |
|---|---|---|---|
| 1 | 🇺🇸 New York | 119 | +1 |
| 2 | 🇬🇧 London | 97 | +3 |
| 3 | 🇮🇳 Mumbai | 92 | +4 |
| 4 | 🇨🇳 Beijing | 91 | -3 |
| 5 | 🇨🇳 Shanghai | 87 | -2 |
| 6 | 🇨🇳 Shenzhen | 84 | -2 |
| 7 | 🇭🇰 Hong Kong | 65 | -1 |
| 8 | 🇷🇺 Moscow | 59 | No Change |
| 9 | 🇮🇳 New Delhi | 57 | +6 |
| 10 | 🇺🇸 San Francisco | 52 | No Change |
| 11 | 🇹🇭 Bangkok | 49 | +2 |
| 12 | 🇹🇼 Taipei | 45 | +2 |
| 13 | 🇫🇷 Paris | 44 | -2 |
| 14 | 🇨🇳 Hangzhou | 43 | -5 |
| 15 | 🇸🇬 Singapore | 42 | New to Top 20 |
| 16 | 🇨🇳 Guangzhou | 39 | -4 |
| 17T | 🇮🇩 Jakarta | 37 | +1 |
| 17T | 🇧🇷 Sao Paulo | 37 | No Change |
| 19T | 🇺🇸 Los Angeles | 31 | No Change |
| 19T | 🇰🇷 Seoul | 31 | -3 |
In fact all Chinese cities on the top 20 list have lost billionaires between 2023–24. Consequently, they’ve all lost ranking spots as well, with Hangzhou seeing the biggest slide (-5) in the top 20.
Where China lost, all other Asian cities—except Seoul—in the top 20 have gained ranks. Indian cities lead the way, with New Delhi (+6) and Mumbai (+3) having climbed the most.
At a country level, China and the U.S combine to make up half of the cities in the top 20. They are also home to about half of the world’s 3,200 billionaire population.
In other news of note: Hurun officially counts Taylor Swift as a billionaire, estimating her net worth at $1.2 billion.

-

 Education1 week ago
How Hard Is It to Get Into an Ivy League School?
-

 Technology2 weeks ago
Ranked: Semiconductor Companies by Industry Revenue Share
-

 Markets2 weeks ago
Ranked: The World’s Top Flight Routes, by Revenue
-

 Demographics2 weeks ago
Population Projections: The World’s 6 Largest Countries in 2075
-

 Markets2 weeks ago
The Top 10 States by Real GDP Growth in 2023
-

 Demographics2 weeks ago
The Smallest Gender Wage Gaps in OECD Countries
-

 Economy2 weeks ago
Where U.S. Inflation Hit the Hardest in March 2024
-

 Green2 weeks ago
Top Countries By Forest Growth Since 2001