

In this map, we visualize average hourly wages across a variety of European countries, based on data from Eurostat.


Of the 44 nations analyzed for retirement welfare, these 25 score well on health, financial, and social support for their aging populations.

Known for their size, labyrinth-like layouts, food, and of course, functional furniture, IKEA stores have become a whole shopping experience. But which country has the most...

Mirroring the country's rapid economic growth, India's FDI (foreign direct investment) inflows have skyrocketed over the last twenty years.

This animation compares countries' share of the global stock market and GDP over 122 years from 1900 to 2022.

Take a look at changes in foreign direct investment flows over a decade, analyzing the top destinations and biggest investors.
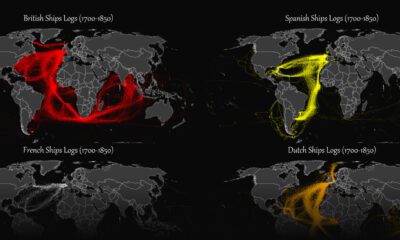

This map plots the colonial shipping lanes used by the British, the French, the Spanish, and the Dutch in the 18th and 19th centuries.
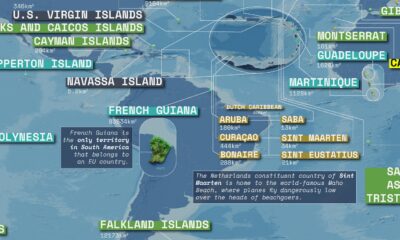

This massive map highlights overseas territories and dependencies around the world and their sovereign states.
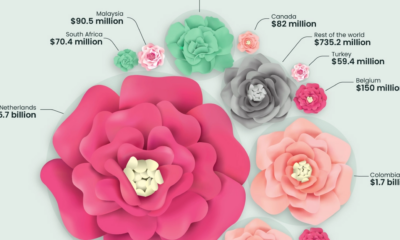

This graphic highlights global flower bouquet sales in 2021 and how a few countries dominate the entire flower export market.
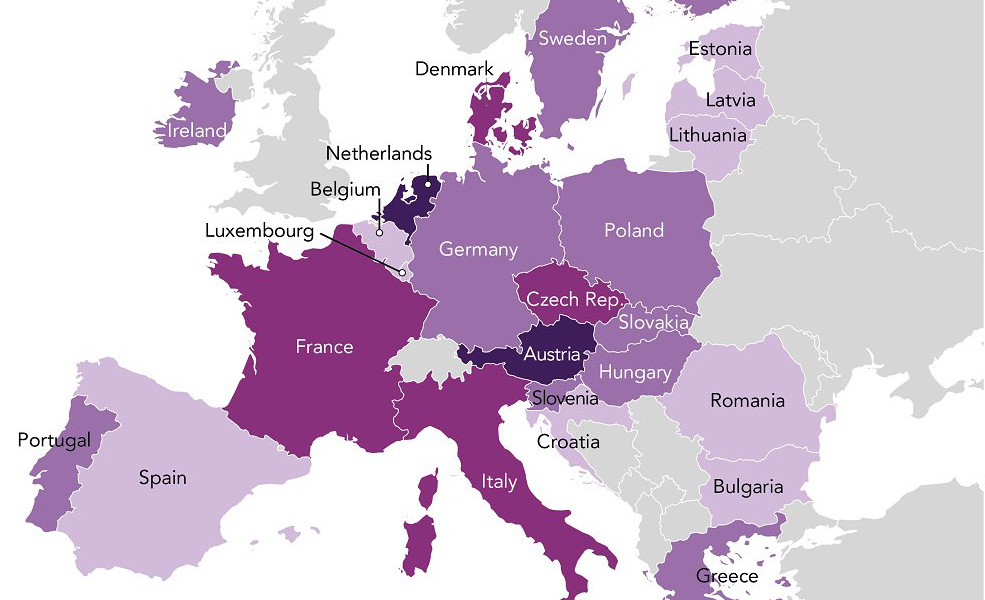
Europe's got a fever, and the only prescription is...more referendums. Austria and Holland have been identified by Eurasia Group as the likely sources.