Venture Capital
Ranked: Who Made the Most U.S. Unicorn Acquisitions Since 1997?
Article/Editing:
Who Made the Most U.S. Unicorn Acquisitions Since 1997?
The elusive unicorn is no longer a myth in the U.S. startup world, with over a thousand private startups reaching a $1 billion valuation in the last 25 years.
While some of these startups eventually go public and go on to become household names, it’s also common for founders to exit through mergers and acquisitions (M&A), by selling their startup to another organization. In fact, over half of the 1,110 unicorns in the U.S. have made some sort of an exit—either through an IPO, a direct listing, a SPAC or an acquisition—since 1997.
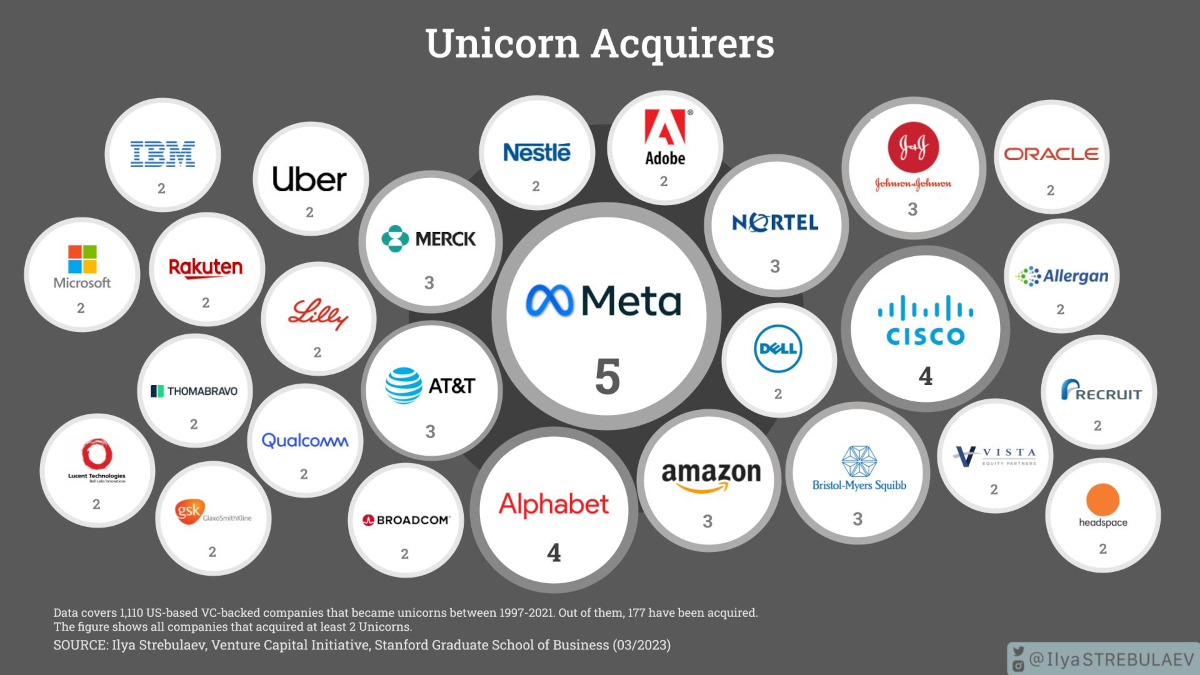
Ilya Strebulaev, professor of finance and private equity at the Stanford Graduate School of Business, brings us this visualization featuring the companies that acquired the most unicorns over the last 25 years.
Strebulaev’s database lists 137 private and public companies along with PE firms who’ve acquired at least one unicorn since 1997, totaling 177 acquisitions.
The Biggest U.S. Unicorn Acquirers
In total, 27 companies have acquired two or more unicorns, accounting for nearly 38% of all acquisitions. 110 companies have acquired just one unicorn.
| Company/ PE Group | Acquired |
|---|---|
| Meta | 5 |
| Cisco | 4 |
| Alphabet | 4 |
| Amazon | 3 |
| Nortel Networks | 3 |
| Bristol-Myers Squibb | 3 |
| Johnson & Johnson | 3 |
| Merck & Co. | 3 |
| AT&T | 3 |
| Recruit Holdings | 2 |
| IBM | 2 |
| Microsoft | 2 |
| Thoma Bravo | 2 |
| Headspace Health | 2 |
| Allergan | 2 |
| Qualcomm | 2 |
| Rakuten | 2 |
| Adobe Systems | 2 |
| Eli Lilly | 2 |
| Vista Equity | 2 |
| Dell | 2 |
| Uber | 2 |
| Oracle | 2 |
| Nestle | 2 |
| Lucent Technologies | 2 |
| Broadcom Corporation | 2 |
| GlaxoSmithKline | 2 |
| BlackBerry | 2 |
| Searchlight Capital Partners | 1 |
| Singtel | 1 |
| Vmware | 1 |
| Internet Capital Group | 1 |
| Hellman & Friedman | 1 |
| AppLovin | 1 |
| Ciena Corporation | 1 |
| Redback Networks | 1 |
| Aether Systems | 1 |
| Fresenius Medical Care | 1 |
| Electronic Arts | 1 |
| Genentech | 1 |
| Inktomi | 1 |
| VistaJet | 1 |
| Ariba | 1 |
| Keurig Dr Pepper | 1 |
| Fullscreen | 1 |
| Sycamore Networks | 1 |
| Novartis | 1 |
| TP ICAP | 1 |
| eBay | 1 |
| DoveBid | 1 |
| McKesson | 1 |
| IG Group | 1 |
| Empower Retirement | 1 |
| Dentsply Sirona | 1 |
| Novo Nordisk | 1 |
| Centocor | 1 |
| Bausch Health | 1 |
| Dainippon Sumitomo Pharma | 1 |
| Medtronic | 1 |
| Mubadala Investment Company | 1 |
| Cint Group | 1 |
| Qualtrics | 1 |
| Rocket Companies | 1 |
| Saudi Arabia's PIF | 1 |
| Prosus | 1 |
| Cigna | 1 |
| One Medical | 1 |
| Exact Sciences | 1 |
| Teladoc Health | 1 |
| Ericsson | 1 |
| SoFi | 1 |
| PayPal Holdings | 1 |
| Bayer | 1 |
| Monsanto | 1 |
| AMD | 1 |
| Aurora | 1 |
| Marvell International | 1 |
| Bill.com | 1 |
| ADC | 1 |
| Dealertrack | 1 |
| Cox Enterprises | 1 |
| L'Oreal | 1 |
| AstraZeneca | 1 |
| Workday | 1 |
| Iron Mountain | 1 |
| Splunk | 1 |
| Stonepeak | 1 |
| American Express | 1 |
| OfferUp | 1 |
| VMware | 1 |
| Ontario Teachers' Pension Plan | 1 |
| Groupon | 1 |
| Allstate Corporation | 1 |
| 1 | |
| SAP | 1 |
| Mindbody | 1 |
| Mallinckrodt | 1 |
| Walmart | 1 |
| GMT Communications | 1 |
| Brightstar Capital | 1 |
| Enterprise Holdings | 1 |
| Healtheon Corporation | 1 |
| Apple | 1 |
| PetSmart | 1 |
| Epiphany | 1 |
| Rice Energy | 1 |
| Unilever | 1 |
| SBA Communications | 1 |
| Bridgepoint Advisers | 1 |
| Aurea | 1 |
| Vector Capital | 1 |
| FireEye | 1 |
| Littlejohn & Co | 1 |
| Alexion | 1 |
| SoftBank Investment Advisers | 1 |
| Francisco Partners | 1 |
| Betfair Group | 1 |
| Shift Technologies | 1 |
| Hudson's Bay | 1 |
| Illumina | 1 |
| Hewlett Packard Enterprise | 1 |
| AbbVie | 1 |
| Salesforce | 1 |
| Hanergy | 1 |
| Teleflex | 1 |
| Twilio | 1 |
| Okta | 1 |
| Celgene | 1 |
| NantCell | 1 |
| VMware & EMC Corp | 1 |
| Intuit | 1 |
| Yahoo! | 1 |
| Netmarble Games | 1 |
| F5 Networks | 1 |
| Roche | 1 |
| Centerbridge Partners | 1 |
| Total | 177 |
Meta, the parent company of Facebook, leads the pack with the most unicorn acquisitions in the U.S., purchasing five unicorns since its founding in 2008, including: Kustomer, WhatsApp, Instagram, CTRL-Labs, and Oculus VR.
Notably, WhatsApp—which closed at a purchase price of $19 billion—was Meta’s most expensive acquisition yet, over nine times their next most expensive purchase, Oculus VR.
Meanwhile, Alphabet (now the parent company of Google) and Cisco are tied in second place with four U.S. unicorn acquisitions each.
- Alphabet: YouTube, Actifio, Nest Labs, Looker Data Sciences
- Cisco: Cerent, Duo Security, AppDynamics, Jasper
Unlike its Big Tech peers, Apple has only made the one U.S. unicorn acquisition: navigation company HopStop that helped bring public transit features to Apple Maps.
Meanwhile, 56% of acquirers received venture capital funding of their own when they were private companies. This includes pack leaders like Meta, Cisco, Alphabet, and Amazon.
Are Unicorn Acquisitions Slowing Down?
Unicorn acquisitions are driven by two factors: the rate at which new unicorns are minted, and the climate for M&A transactions more broadly.
To begin with, the minting of new unicorns is largely influenced by the venture funding environment. Funding opportunities increase when interest rates go down, which makes riskier, venture-scale ideas more enticing. During the last decade of persistently low interest rates up until 2022, unicorns flourished more than ever.
Meanwhile, as tech companies like Apple, Microsoft, Alphabet, and Meta began seeing outsized profits in the 2010s, venture investors and their LPs looked to get in on the ground floor of tech startups that could emulate their success, often paying premium valuations for the chance. Simultaneously, big tech looked to acquire unicorns themselves, both to augment their business lines and to squash potential competitors.
However, the era of “easy money” may have come to an end, and privately-held startups have seen valuations drop in recent years. This means that for the next little while—at least until monetary policy stops tightening—unicorns could become a rarer sight.
Unicorn acquisitions may also see a similar fate. Persistent inflation and the government anti-trust push are just some of the other factors that have led to VC-backed startup acquisitions falling to their lowest quarterly levels in a decade. The more expensive the valuation, the harder to find a buyer, which means that some unicorns may even lose their $1 billion tag even when they do get acquired.

This article was published as a part of Visual Capitalist's Creator Program, which features data-driven visuals from some of our favorite Creators around the world.


Finance
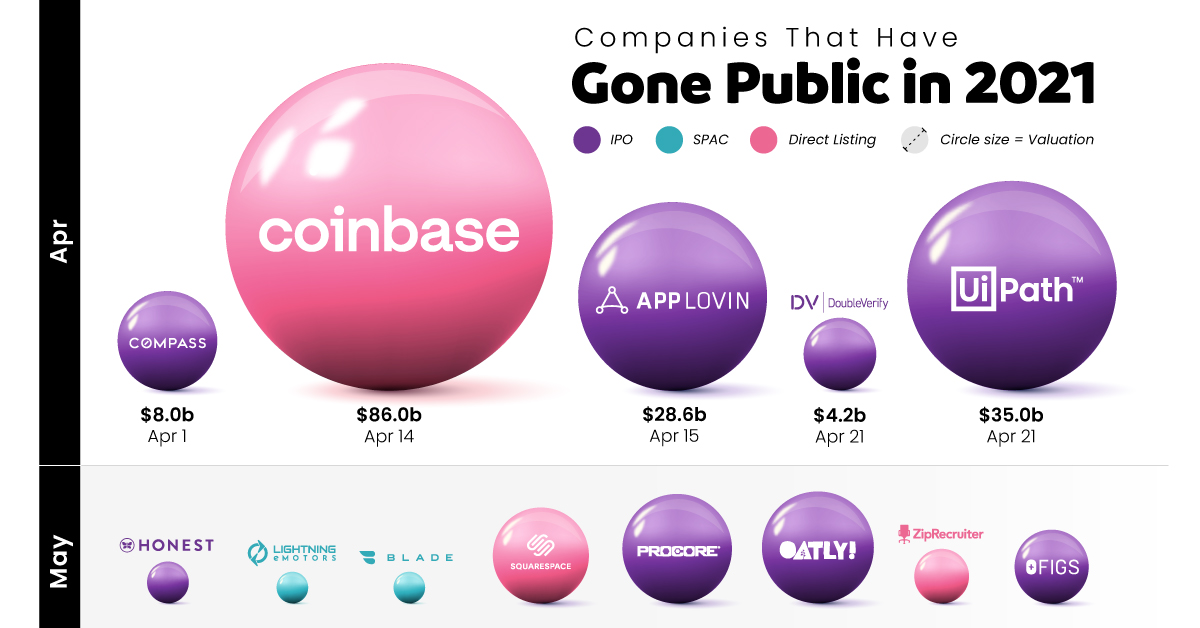
Companies Gone Public in 2021: Visualizing IPO Valuations
Tracking the companies that have gone public in 2021, their valuation, and how they did it.
Companies Gone Public in 2021: Visualizing Valuations
Despite its many tumultuous turns, last year was a productive year for global markets, and companies going public in 2021 benefited.
From much-hyped tech initial public offerings (IPOs) to food and healthcare services, many companies with already large followings have gone public this year. Some were supposed to go public in 2020 but got delayed due to the pandemic, and others saw the opportunity to take advantage of a strong current market.
This graphic measures 68 companies that have gone public in 2021 — including IPOs, SPACs, and Direct Listings—as well as their subsequent valuations after listing.
Who’s Gone Public in 2021?
Historically, companies that wanted to go public employed one main method above others: the initial public offering (IPO).
But companies going public today readily choose from one of three different options, depending on market situations, associated costs, and shareholder preference:
- Initial Public Offering (IPO): A private company creates new shares which are underwritten by a financial organization and sold to the public.
- Special Purpose Acquisition Company (SPAC): A separate company with no operations is created strictly to raise capital to acquire the company going public. SPACs are the fastest method of going public, and have become popular in recent years.
- Direct Listing: A private company enters a market with only existing, outstanding shares being traded and no new shares created. The cost is lower than that of an IPO, since no fees need to be paid for underwriting.
The majority of companies going public in 2021 chose the IPO route, but some of the biggest valuations resulted from direct listings.
| Listing Date | Company | Valuation ($B) | Listing Type |
|---|---|---|---|
| 08-Jan-21 | Clover Health | $7.0 | SPAC |
| 13-Jan-21 | Affirm | $11.9 | IPO |
| 13-Jan-21 | Billtrust | $1.3 | SPAC |
| 14-Jan-21 | Poshmark | $3.0 | IPO |
| 15-Jan-21 | Playtika | $11.0 | IPO |
| 21-Jan-21 | Hims and Hers Health | $1.6 | SPAC |
| 28-Jan-21 | Qualtrics | $15.0 | IPO |
| 09-Feb-21 | Metromile | - | SPAC |
| 11-Feb-21 | Bumble | $8.2 | IPO |
| 26-Feb-21 | ChargePoint Holdings | - | SPAC |
| 03-Mar-21 | Oscar Health | $7.9 | IPO |
| 10-Mar-21 | Roblox | $30.0 | Direct Listing |
| 11-Mar-21 | Coupang | $60.0 | IPO |
| 23-Mar-21 | DigitalOcean | $5.0 | IPO |
| 25-Mar-21 | VIZIO | $3.9 | IPO |
| 26-Mar-21 | ThredUp | $1.3 | IPO |
| 31-Mar-21 | Coursera | $4.3 | IPO |
| 01-Apr-21 | Compass | $8.0 | IPO |
| 14-Apr-21 | Coinbase | $86.0 | Direct Listing |
| 15-Apr-21 | AppLovin | $28.6 | IPO |
| 21-Apr-21 | UiPath | $35.0 | IPO |
| 21-Apr-21 | DoubleVerify | $4.2 | IPO |
| 05-May-21 | The Honest Company | $1.4 | IPO |
| 07-May-21 | Lightning eMotors | $0.82 | SPAC |
| 07-May-21 | Blade Air Mobility | $0.83 | SPAC |
| 19-May-21 | Squarespace | $7.4 | Direct Listing |
| 19-May-21 | Procore | $9.6 | IPO |
| 19-May-21 | Oatly | $10.0 | IPO |
| 26-May-21 | ZipRecruiter | $2.4 | Direct Listing |
| 26-May-21 | FIGS | $4.4 | IPO |
| 01-Jun-21 | SoFi | $8.7 | SPAC |
| 02-Jun-21 | BarkBox | $1.6 | SPAC |
| 08-Jun-21 | Marqueta | $15.0 | IPO |
| 10-Jun-21 | Monday.com | $7.5 | IPO |
| 16-Jun-21 | WalkMe | $2.5 | IPO |
| 22-Jun-21 | Sprinklr | $3.7 | IPO |
| 24-Jun-21 | Confluent | $9.1 | IPO |
| 29-Jun-21 | Clear | $4.5 | IPO |
| 30-Jun-21 | SentinelOne | $10.0 | IPO |
| 30-Jun-21 | LegalZoom | $7.0 | IPO |
| 30-Jun-21 | Didi Chuxing | $73.0 | IPO |
| 16-Jul-21 | Blend | $4 | IPO |
| 21-Jul-21 | Kaltura | $1.24 | IPO |
| 21-Jul-21 | DISCO | $2.5 | IPO |
| 21-Jul-21 | Couchbase | $1.4 | IPO |
| 23-Jul-21 | Vtex | $3.5 | IPO |
| 23-Jul-21 | Outbrain | $1.1 | IPO |
| 28-Jul-21 | Duolingo | $3.7 | IPO |
| 28-Jul-21 | Riskified | $3.3 | IPO |
| 29-Jul-21 | Robinhood | $32.0 | IPO |
| 22-Sep-21 | Toast | $22.0 | IPO |
| 22-Sep-21 | Freshworks | $10.1 | IPO |
| 23-Sep-21 | Remitly | $6.9 | IPO |
| 28-Sep-21 | Amplitude | $6.4 | Direct Listing |
| 29-Sep-21 | Warby Parker | $6.0 | Direct Listing |
| 14-Oct-21 | GitLab | $11.0 | IPO |
| 27-Oct-21 | Rent the Runway | $1.7 | IPO |
| 29-Oct-21 | Udemy | $4.0 | IPO |
| 03-Nov-21 | Allbirds | $2.2 | IPO |
| 04-Nov-21 | NerdWallet | $1.2 | IPO |
| 10-Nov-21 | Rivian | $66.5 | IPO |
| 10-Nov-21 | Expensify | $2.2 | IPO |
| 11-Nov-21 | Winc | - | IPO |
| 11-Nov-21 | Weave | - | IPO |
| 17-Nov-21 | UserTesting | - | IPO |
| 17-Nov-21 | Braze | $6.0 | IPO |
| 18-Nov-21 | Sweetgreen | $3.0 | IPO |
| 09-Dec-21 | Nubank | $41.0 | IPO |
Though there are many well-known names in the list, one of the biggest through lines continues to be the importance of tech.
A majority of 2021’s newly public companies have been in tech, including multiple mobile apps, websites, and online services. The two biggest IPOs so far were South Korea’s Coupang, an online marketplace valued at $60 billion after going public, and China’s ride-hailing app Didi Chuxing, the year’s largest post-IPO valuation at $73 billion.
And there were many apps and services going public through other means as well. Gaming company Roblox went public through a direct listing, earning a valuation of $30 billion, and cryptocurrency platform Coinbase has earned the year’s largest valuation so far, with an $86 billion valuation following its direct listing.
Big Companies Going Public in 2022
As with every year, some of the biggest companies going public were lined up for the later half.
Tech will continue to be the talk of the markets. Payment processing firm Stripe was setting up to be the year’s biggest IPO with an estimated valuation of $95 billion, but got delayed. Likewise, online grocery delivery platform InstaCart, which saw a big upswing in traction due to the pandemic, has been looking to go public at a valuation of at least $39 billion.
Of course, it’s common that potential public listings and offerings fall through. Whether they get delayed due to weak market conditions or cancelled at the last minute, anything can happen when it comes to public markets.
This post has been updated as of January 1, 2022.

-

 Misc2 weeks ago
Tesla Is Once Again the World’s Best-Selling EV Company
-

 AI1 week ago
The Stock Performance of U.S. Chipmakers So Far in 2024
-

 Misc1 week ago
Almost Every EV Stock is Down After Q1 2024
-

 Money1 week ago
Where Does One U.S. Tax Dollar Go?
-

 Green2 weeks ago
Ranked: Top Countries by Total Forest Loss Since 2001
-

 Real Estate2 weeks ago
Visualizing America’s Shortage of Affordable Homes
-

 Maps2 weeks ago
Mapped: Average Wages Across Europe
-

 Mining2 weeks ago
Charted: The Value Gap Between the Gold Price and Gold Miners