Energy
The New Energy Era: The Impact of Critical Minerals on National Security
In 1954, the United States was only fully reliant on foreign sources for eight mineral commodities.
Fast forward 60+ years, and the country now depends on foreign sources for 20 such materials, including ones essential for military and battery technologies.
This puts the U.S. in a precarious position, depending largely on China and other foreign nations for the crucial materials such as lithium, cobalt, and rare earth metals that can help build and secure a more sustainable future.
America’s Energy Dependence
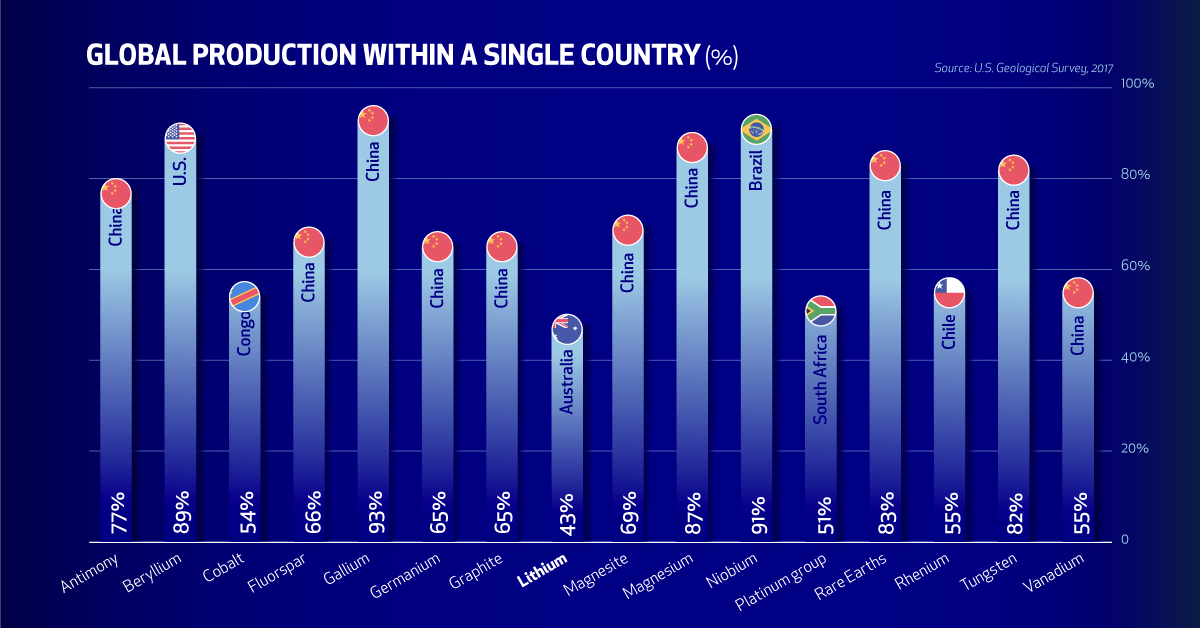
Today’s visualization comes from Standard Lithium, and it outlines China’s dominance of the critical minerals needed for the new energy era.
Which imported minerals create the most risk for U.S. supply chains and national security?

Natural Resources and Development
Gaining access to natural resources can influence a nation’s ability to grow and defend itself. China’s growth strategy took this into account, and the country sourced massive amounts of raw materials to position the country as the number one producer and consumer of commodities.
By the end of the second Sino-Japanese War in 1945, China’s mining industry was largely in ruins. After the war, vast amounts of raw materials were required to rebuild the country.
In the late 1970s, the industry was boosted by China’s “reform and opening” policies, and since then, China’s mining outputs have increased enormously. China’s mining and material industries fueled the rapid growth of China from the 1980s onwards.
Supply Chain Dominance
A large number of Chinese mining companies also invest in overseas mining projects. China’s “going out” strategy encourages companies to move into overseas markets.
They have several reasons to mine beyond its shores: to secure mineral resources that are scarce in China, to gain access to global markets and mineral supply chains, and to minimize domestic overproduction of some mineral commodities.
This has led to China to become the leading producer of many of the world’s most important metals while also securing a commanding position in key supply chains.
As an example of this, China is the world’s largest producer and consumer of rare earth materials. The country produces approximately 94% of the rare earth oxides and around 100% of the rare earth metals consumed globally, with 50% going to domestic consumption.
U.S.-China Trade Tensions
The U.S. drafted a list of 35 critical minerals in 2018 that are vital to national security, and according to the USGS, the country sources at least 31 of the materials chiefly through imports.
China is the third largest supplier of natural resources to the U.S. behind Canada and Mexico.
| Rank | Country | U.S. Minerals Imports By Country ($US, 2018) |
|---|---|---|
| #1 | Canada | $1,814,404,440 |
| #2 | Mexico | $724,542,960 |
| #3 | China | $678,217,450 |
| #4 | Brazil | $619,890,570 |
| #5 | South Africa | $568,183,800 |
This dependence on China poses a risk. In 2010, a territorial dispute between China and Japan threatened to disrupt the supply of the rare earth elements. Today, a similar threat still looms over trade tensions between the U.S. and China.
China’s scale of influence over critical minerals means that it could artificially limit supply and move prices in the global clean energy trade, in the same way that OPEC does with oil. This would leave nations that import their mineral needs in an expensive and potentially limiting spot.
Moon Shot: Building Domestic Supply and Production
Every supply chain starts with raw materials. The U.S. had the world’s largest lithium industry until the 1990s—but this is no longer the case, even though the resources are still there.
The U.S. holds 12% of the world’s identified lithium resources, but only produces 2% of global production from a single mine in Nevada.
There are a handful of companies looking to develop the U.S. lithium reserves, but there is potential for so much more. Less than 18% of the U.S. land mass is geologically mapped at a scale suited to identifying new mineral deposits.
The United States has the resources, it is just a question of motivation. Developing domestic resources can reduce its foreign dependence, and enable it to secure the new energy era.
In the clean energy economy of the future, critical minerals will be just as essential—and geopolitical—as oil is today.
—Scientific American


Energy
Charted: 4 Reasons Why Lithium Could Be the Next Gold Rush
Visual Capitalist has partnered with EnergyX to show why drops in prices and growing demand may make now the right time to invest in lithium.


4 Reasons Why You Should Invest in Lithium
Lithium’s importance in powering EVs makes it a linchpin of the clean energy transition and one of the world’s most precious minerals.
In this graphic, Visual Capitalist partnered with EnergyX to explore why now may be the time to invest in lithium.
1. Lithium Prices Have Dropped
One of the most critical aspects of evaluating an investment is ensuring that the asset’s value is higher than its price would indicate. Lithium is integral to powering EVs, and, prices have fallen fast over the last year:
| Date | LiOH·H₂O* | Li₂CO₃** |
|---|---|---|
| Feb 2023 | $76 | $71 |
| March 2023 | $71 | $61 |
| Apr 2023 | $43 | $33 |
| May 2023 | $43 | $33 |
| June 2023 | $47 | $45 |
| July 2023 | $44 | $40 |
| Aug 2023 | $35 | $35 |
| Sept 2023 | $28 | $27 |
| Oct 2023 | $24 | $23 |
| Nov 2023 | $21 | $21 |
| Dec 2023 | $17 | $16 |
| Jan 2024 | $14 | $15 |
| Feb 2024 | $13 | $14 |
Note: Monthly spot prices were taken as close to the 14th of each month as possible.
*Lithium hydroxide monohydrate MB-LI-0033
**Lithium carbonate MB-LI-0029
2. Lithium-Ion Battery Prices Are Also Falling
The drop in lithium prices is just one reason to invest in the metal. Increasing economies of scale, coupled with low commodity prices, have caused the cost of lithium-ion batteries to drop significantly as well.
In fact, BNEF reports that between 2013 and 2023, the price of a Li-ion battery dropped by 82%.
| Year | Price per KWh |
|---|---|
| 2023 | $139 |
| 2022 | $161 |
| 2021 | $150 |
| 2020 | $160 |
| 2019 | $183 |
| 2018 | $211 |
| 2017 | $258 |
| 2016 | $345 |
| 2015 | $448 |
| 2014 | $692 |
| 2013 | $780 |

3. EV Adoption is Sustainable
One of the best reasons to invest in lithium is that EVs, one of the main drivers behind the demand for lithium, have reached a price point similar to that of traditional vehicle.
According to the Kelly Blue Book, Tesla’s average transaction price dropped by 25% between 2022 and 2023, bringing it in line with many other major manufacturers and showing that EVs are a realistic transport option from a consumer price perspective.
| Manufacturer | September 2022 | September 2023 |
|---|---|---|
| BMW | $69,000 | $72,000 |
| Ford | $54,000 | $56,000 |
| Volkswagon | $54,000 | $56,000 |
| General Motors | $52,000 | $53,000 |
| Tesla | $68,000 | $51,000 |
4. Electricity Demand in Transport is Growing
As EVs become an accessible transport option, there’s an investment opportunity in lithium. But possibly the best reason to invest in lithium is that the IEA reports global demand for the electricity in transport could grow dramatically by 2030:
| Transport Type | 2022 | 2025 | 2030 |
|---|---|---|---|
| Buses 🚌 | 23,000 GWh | 50,000 GWh | 130,000 GWh |
| Cars 🚙 | 65,000 GWh | 200,000 GWh | 570,000 GWh |
| Trucks 🛻 | 4,000 GWh | 15,000 GWh | 94,000 GWh |
| Vans 🚐 | 6,000 GWh | 16,000 GWh | 72,000 GWh |
The Lithium Investment Opportunity
Lithium presents a potentially classic investment opportunity. Lithium and battery prices have dropped significantly, and recently, EVs have reached a price point similar to other vehicles. By 2030, the demand for clean energy, especially in transport, will grow dramatically.
With prices dropping and demand skyrocketing, now is the time to invest in lithium.
EnergyX is poised to exploit lithium demand with cutting-edge lithium extraction technology capable of extracting 300% more lithium than current processes.

-

 Lithium4 days ago
Ranked: The Top 10 EV Battery Manufacturers in 2023
Asia dominates this ranking of the world’s largest EV battery manufacturers in 2023.
-

 Energy1 week ago
The World’s Biggest Nuclear Energy Producers
China has grown its nuclear capacity over the last decade, now ranking second on the list of top nuclear energy producers.
-

 Energy1 month ago
The World’s Biggest Oil Producers in 2023
Just three countries accounted for 40% of global oil production last year.
-

 Energy1 month ago
How Much Does the U.S. Depend on Russian Uranium?
Currently, Russia is the largest foreign supplier of nuclear power fuel to the U.S.
-

 Uranium2 months ago
Charted: Global Uranium Reserves, by Country
We visualize the distribution of the world’s uranium reserves by country, with 3 countries accounting for more than half of total reserves.
-

 Energy3 months ago
Visualizing the Rise of the U.S. as Top Crude Oil Producer
Over the last decade, the United States has established itself as the world’s top producer of crude oil, surpassing Saudi Arabia and Russia.


-

 Debt1 week ago
How Debt-to-GDP Ratios Have Changed Since 2000
-

 Markets2 weeks ago
Ranked: The World’s Top Flight Routes, by Revenue
-

 Countries2 weeks ago
Population Projections: The World’s 6 Largest Countries in 2075
-

 Markets2 weeks ago
The Top 10 States by Real GDP Growth in 2023
-

 Demographics2 weeks ago
The Smallest Gender Wage Gaps in OECD Countries
-

 United States2 weeks ago
Where U.S. Inflation Hit the Hardest in March 2024
-

 Green2 weeks ago
Top Countries By Forest Growth Since 2001
-

 United States2 weeks ago
Ranked: The Largest U.S. Corporations by Number of Employees