Mining
35 Minerals Absolutely Critical to U.S. Security
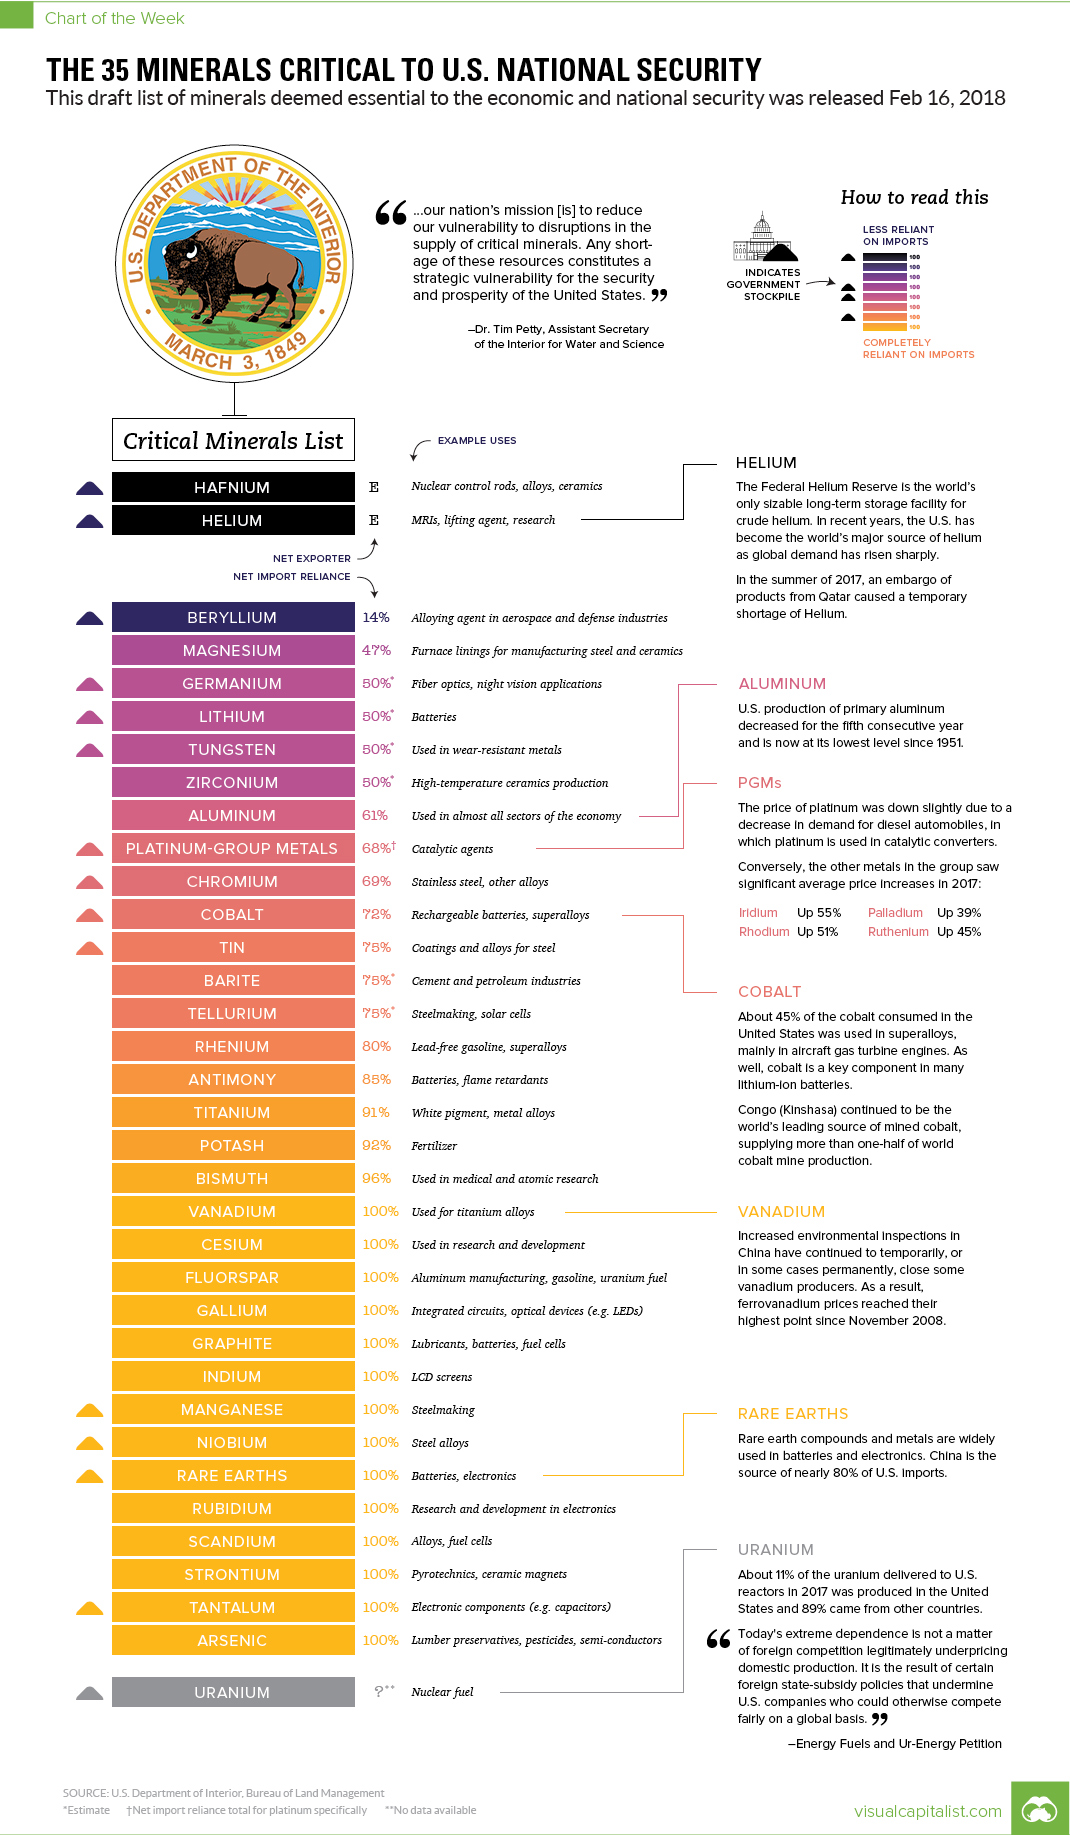
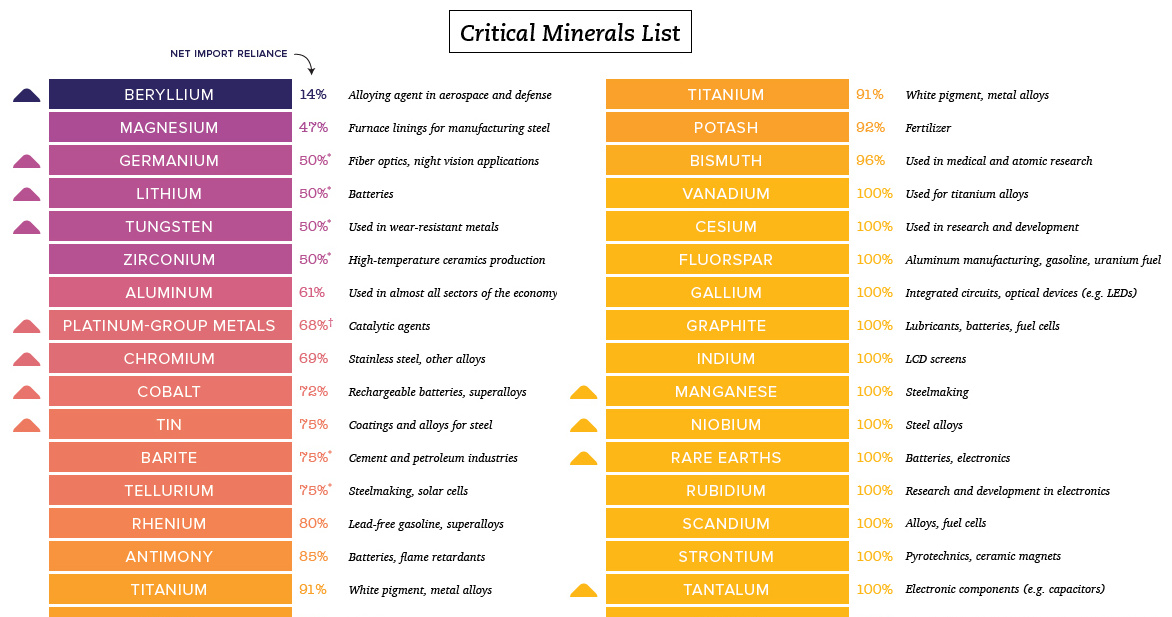
35 Minerals Absolutely Critical to U.S. National Security
Draft list released by feds on Feb 16th, 2018
The Chart of the Week is a weekly Visual Capitalist feature on Fridays.
What do cobalt, uranium, helium, titanium, and fluorspar have in common?
According to the U.S. government, these are all minerals that are deemed critical to both the economic and national security of the country.
The draft list of 35 critical minerals was released on February 16, 2018 as the result of President Trump’s Executive Order 13817, which asked the U.S. Department of the Interior and the Secretary of Defense to publish a list of mineral commodities that are vital to U.S. interests.
Under the Executive Order, a critical mineral is defined as:
A non-fuel mineral or mineral material essential to the economic and national security of the United States, the supply chain of which is vulnerable to disruption…
The list includes minerals that are important for defense, economic, and industrial purposes – and it keys in especially on minerals that are not produced in substantial quantities domestically.
Why These Critical Minerals?
We sorted the list based on some of the key uses of these minerals.
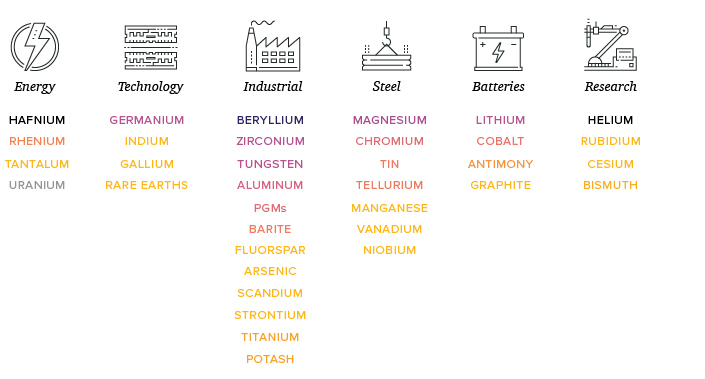
Of course, some of these minerals could belong in multiple categories: for example, vanadium is used as a steel and titanium alloy strengthener, but also in rechargeable vanadium flow batteries.
That said, the important commonality to note for all of these minerals is their crucial link to the U.S. economy and national security.
Preparing for the Worst-Case Scenario
Imagine the hypothetical impact of a lack of uranium for nuclear plants, a hampered ability to create high-strength steel and superalloys for the U.S. military, or if U.S. auto manufacturers had limited access to aluminum, steel, PGMs, and battery metals.
The challenge, as U.S. federal authorities realize, is that many of these raw materials are produced in limited amounts domestically. In fact, according to the USGS, the country sources at least 31 of the aforementioned materials chiefly through imports.
While it is unlikely that these supply chains would ever be disrupted, it’s never a bad idea to prepare for the worst-case scenario.


Lithium
Ranked: The Top 10 EV Battery Manufacturers in 2023
Asia dominates this ranking of the world’s largest EV battery manufacturers in 2023.


The Top 10 EV Battery Manufacturers in 2023
This was originally posted on our Voronoi app. Download the app for free on iOS or Android and discover incredible data-driven charts from a variety of trusted sources.
Despite efforts from the U.S. and EU to secure local domestic supply, all major EV battery manufacturers remain based in Asia.
In this graphic we rank the top 10 EV battery manufacturers by total battery deployment (measured in megawatt-hours) in 2023. The data is from EV Volumes.
Chinese Dominance
Contemporary Amperex Technology Co. Limited (CATL) has swiftly risen in less than a decade to claim the title of the largest global battery group.
The Chinese company now has a 34% share of the market and supplies batteries to a range of made-in-China vehicles, including the Tesla Model Y, SAIC’s MG4/Mulan, and various Li Auto models.
| Company | Country | 2023 Production (megawatt-hour) | Share of Total Production |
|---|---|---|---|
| CATL | 🇨🇳 China | 242,700 | 34% |
| BYD | 🇨🇳 China | 115,917 | 16% |
| LG Energy Solution | 🇰🇷 Korea | 108,487 | 15% |
| Panasonic | 🇯🇵 Japan | 56,560 | 8% |
| SK On | 🇰🇷 Korea | 40,711 | 6% |
| Samsung SDI | 🇰🇷 Korea | 35,703 | 5% |
| CALB | 🇨🇳 China | 23,493 | 3% |
| Farasis Energy | 🇨🇳 China | 16,527 | 2% |
| Envision AESC | 🇨🇳 China | 8,342 | 1% |
| Sunwoda | 🇨🇳 China | 6,979 | 1% |
| Other | - | 56,040 | 8% |
In 2023, BYD surpassed LG Energy Solution to claim second place. This was driven by demand from its own models and growth in third-party deals, including providing batteries for the made-in-Germany Tesla Model Y, Toyota bZ3, Changan UNI-V, Venucia V-Online, as well as several Haval and FAW models.
The top three battery makers (CATL, BYD, LG) collectively account for two-thirds (66%) of total battery deployment.
Once a leader in the EV battery business, Panasonic now holds the fourth position with an 8% market share, down from 9% last year. With its main client, Tesla, now sourcing batteries from multiple suppliers, the Japanese battery maker seems to be losing its competitive edge in the industry.
Overall, the global EV battery market size is projected to grow from $49 billion in 2022 to $98 billion by 2029, according to Fortune Business Insights.

-

 Debt1 week ago
How Debt-to-GDP Ratios Have Changed Since 2000
-

 Markets2 weeks ago
Ranked: The World’s Top Flight Routes, by Revenue
-

 Demographics2 weeks ago
Population Projections: The World’s 6 Largest Countries in 2075
-

 Markets2 weeks ago
The Top 10 States by Real GDP Growth in 2023
-

 Demographics2 weeks ago
The Smallest Gender Wage Gaps in OECD Countries
-

 Economy2 weeks ago
Where U.S. Inflation Hit the Hardest in March 2024
-

 Green2 weeks ago
Top Countries By Forest Growth Since 2001
-

 United States2 weeks ago
Ranked: The Largest U.S. Corporations by Number of Employees