Space
Map of Mars: The Geology of the Red Planet
View the full-size version of this infographic
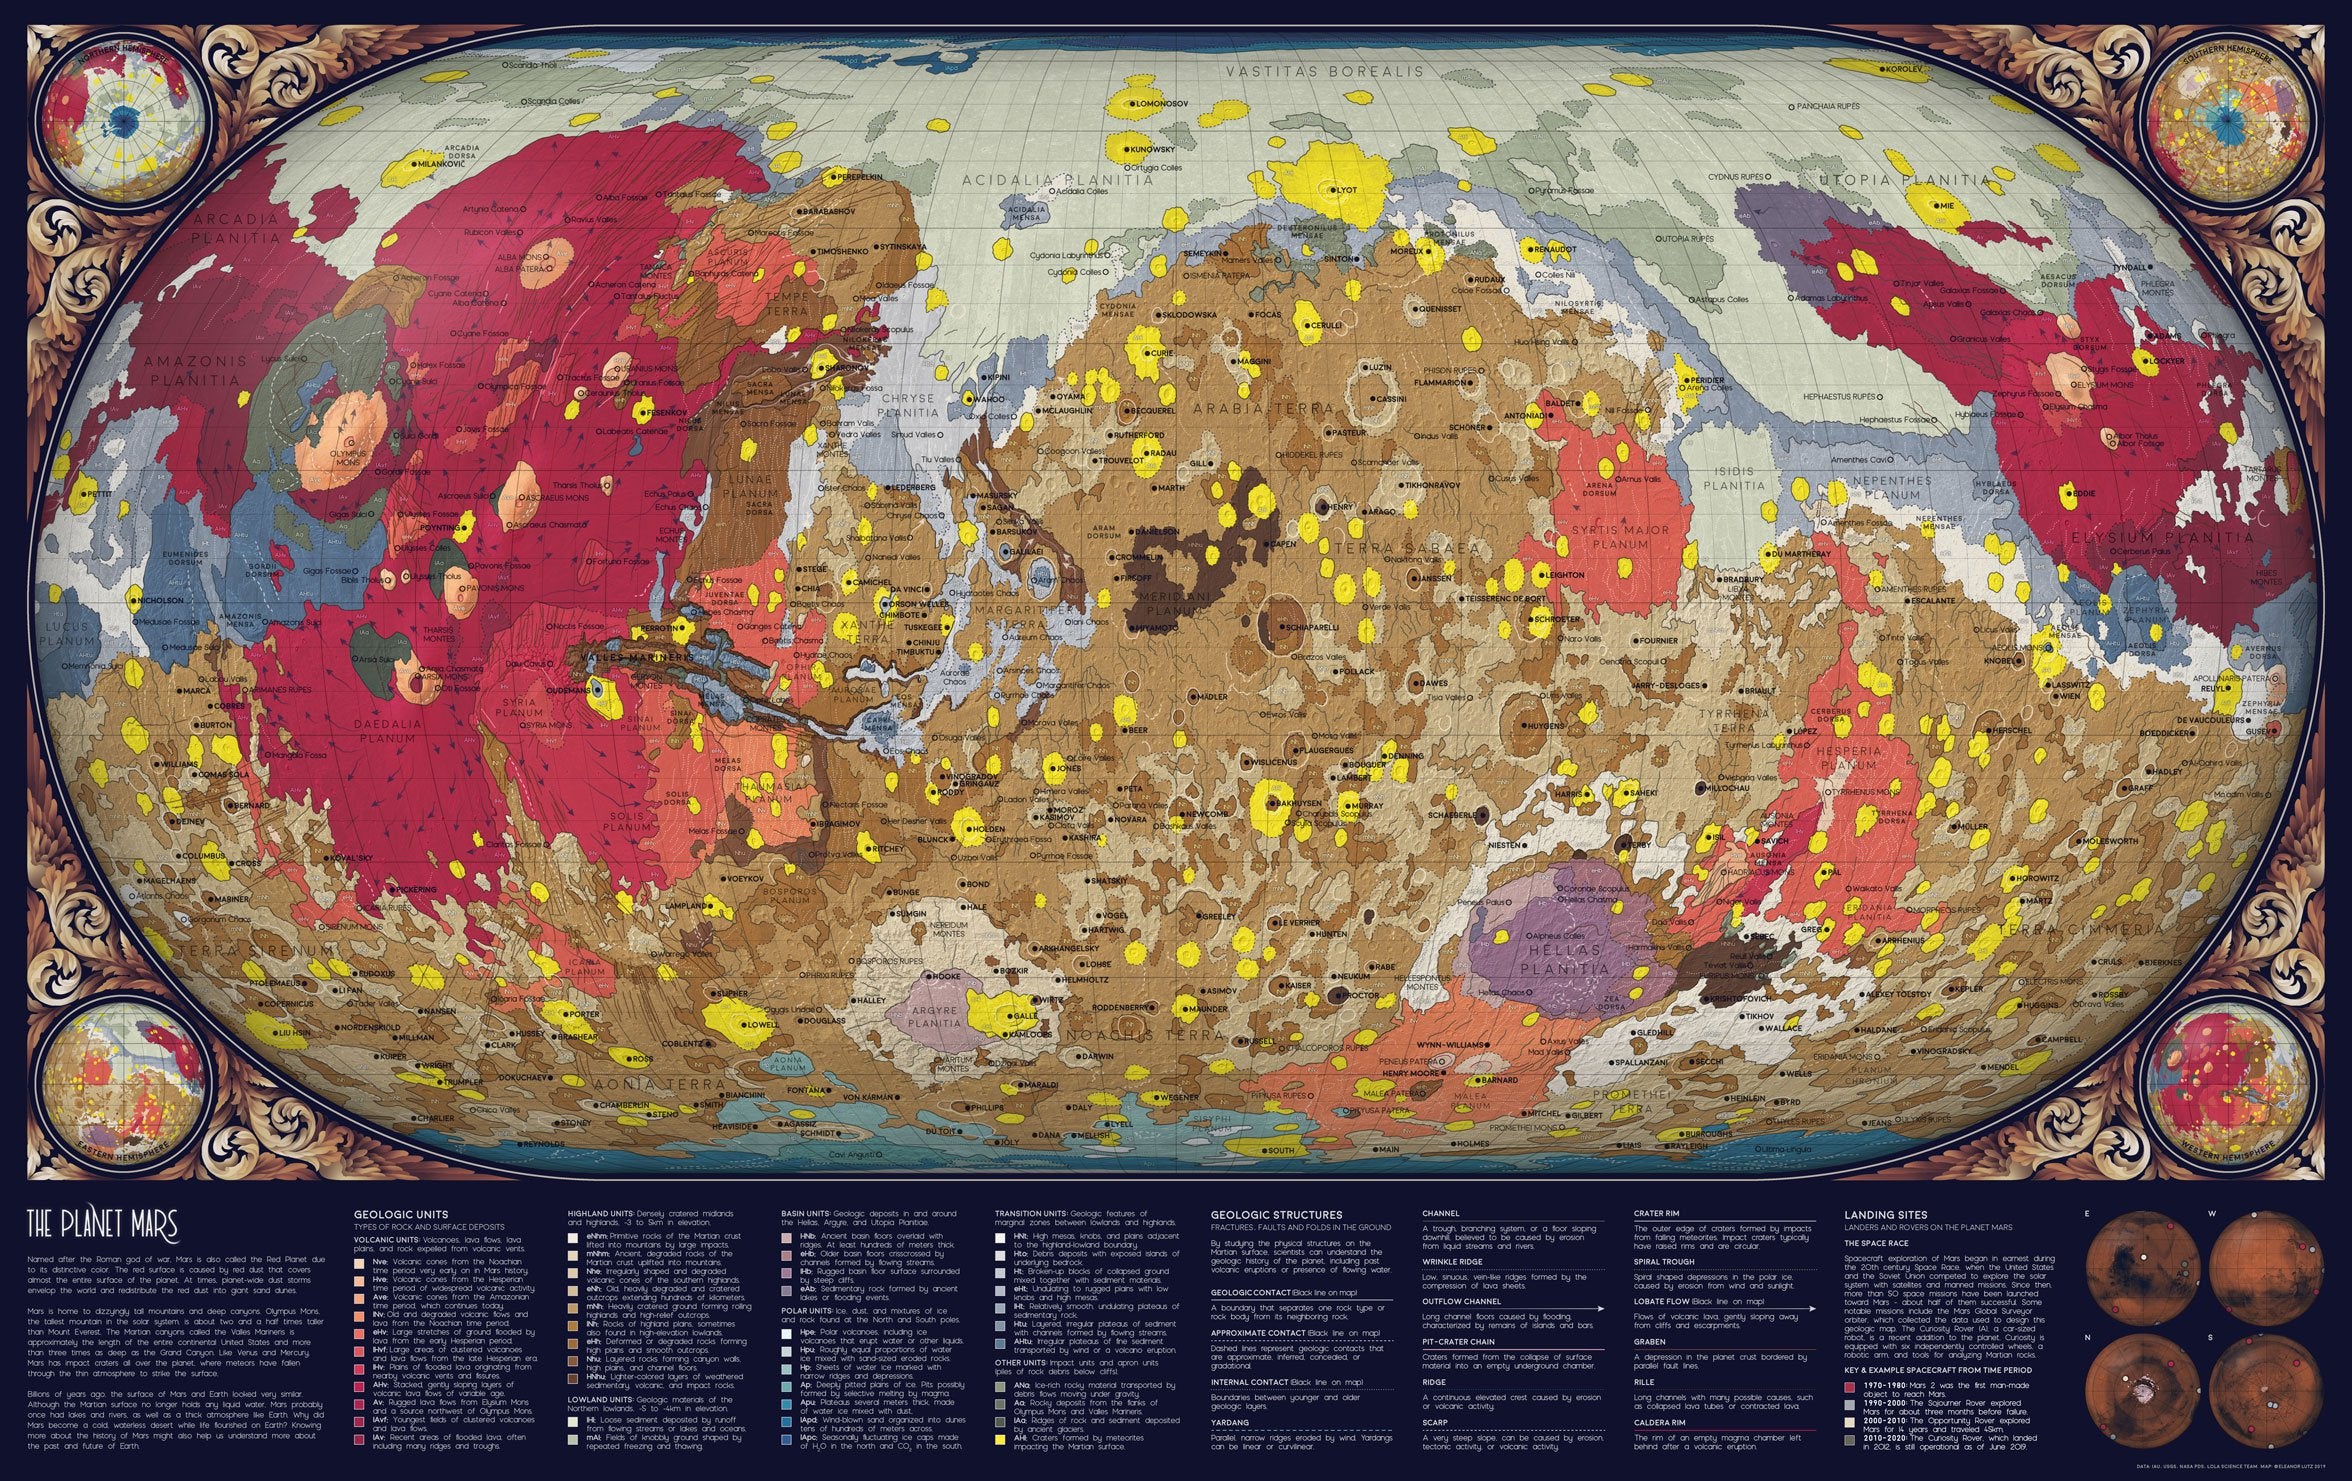
Mapping Mars: The Geology of the Red Planet
View the high resolution version of this incredible map by clicking here
For centuries, Mars has been mythically defined by its characteristic red appearance.
In Babylonian astronomy, Mars was named after Nergal, the deity of fire, war, and destruction. In Chinese and Japanese texts, the planet was known as 火星, the fire star.
Although this unique reddish hue has been a key defining characteristic of Mars in culture for centuries, today we now know that it’s the iron oxide soil of the Martian landscape that makes it the “Red Planet” – and that there is much more to Mars than its color upon closer observation.
Above, today’s map, posted and created by Reddit user /hellofromthemoon, brings together the data from centuries of observation and the numerous missions to the Red Planet to map out its geology on a grand scale.
A Red Dot in the Sky
Egyptian astronomers first observed the planet Mars four thousand years ago and named it “Horus-the-red.” Babylonian astronomers marked its course through the night sky to track the passage of time. But it was not until 1610, when Galileo Galilei witnessed Mars with his own eyes through a telescope, that Mars was revealed as a whole other world.
Over the centuries with improving technology, a succession of astronomers observed and crudely mapped out everything from polar ice caps to yellow clouds, and white and dark spots denoting varying elevations across the Martian surface. Some of the earliest maps of Mars date to 1831. But there is only so much you can accurately observe from the surface of the Earth.
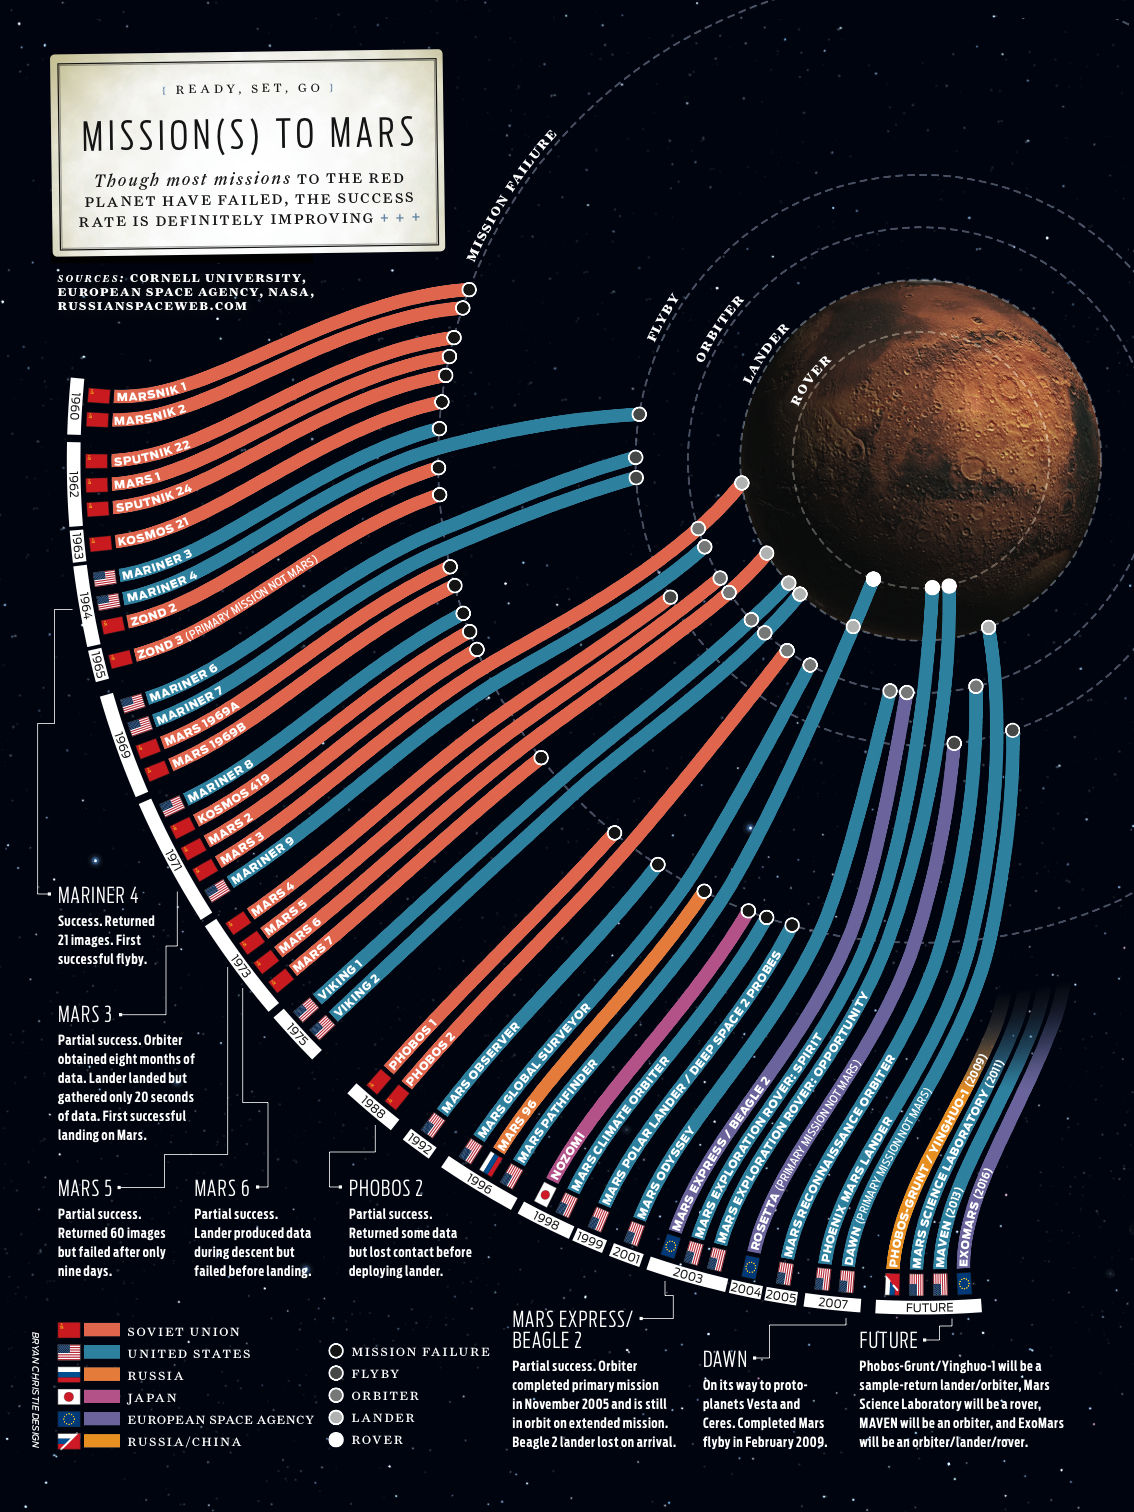
On July 14, 1965, NASA successfully received the first up-close images of Mars from the Mariner 4 spacecraft, passing within 9,844 kilometers (6,117 miles) of Mars’ surface. Mariner 4 captured the image of a large ancient crater and confirmed the existence of a thin atmosphere composed largely of carbon dioxide.
Since then, four space agencies have successfully made it to Mars: NASA, the former Soviet Union space program, the European Space Agency and the Indian Space Research Organization. From orbital satellites to surface exploration with robots, each successful mission has brought back important data to develop an evolving picture of the planet.
Here is a complete list of both the successful and failed missions to Mars.
Martian Geology
On Mars, we see volcanoes, canyons, and impact basins much like the ones on Earth. The yellows scattered across the map indicate meteor impacts of varying size while the swaths of red indicate volcanoes and their associated lava flows. The varying colors of brown indicate the cratered highlands and midlands that make up most of the southern hemisphere.
The planet appears asymmetric. Most of the southern hemisphere is heavily cratered and resembles the moon’s highlands. In contrast, the northern hemisphere is sparsely cratered and has many large volcanoes.
Mars is approximately one-half the diameter of the Earth, but both planets have the same amount of dry land. This is because the current surface of Mars has no liquid water.
Mars and Earth are very different planets when it comes to temperature, size, and atmosphere, but geologic processes on the two planets are eerily similar. The sheer size of some landforms on Mars would shadow over similar features on Earth because of the lack of water erosion. This lack of erosion has preserved billion year-old geologic features.
The tallest mountain on Mars and in the solar system is Olympus Mons, and it is two and a half times taller than Mt. Everest. A Martian canyon system, called Valles Marineris, is the length of the entire continental United States and three times deeper than the Grand Canyon.
Mars Colony: Location, Location, Location
The first step to building a colony is to figure out where the best chance of survival is. For Mars, some researchers have identified the planet’s poles, which contain millennia-old ice deposits. These are thought to contain large amounts of ice, which mars settlers could extract and turn into liquid water.
The poles also host other natural resources, such as carbon dioxide, iron, aluminum, silicon and sulfur, which could be used to make glass, brick and plastic. Furthermore, the planet’s atmosphere contains enough hydrogen and methanol for fuel.
Closing the Distance
The map above represents the culmination of centuries of work which we are lucky enough to view here on a computer, conveniently online for us to appreciate and wonder what life’s like on the surface of Mars.
Who knows what more exploration will reveal.


Space
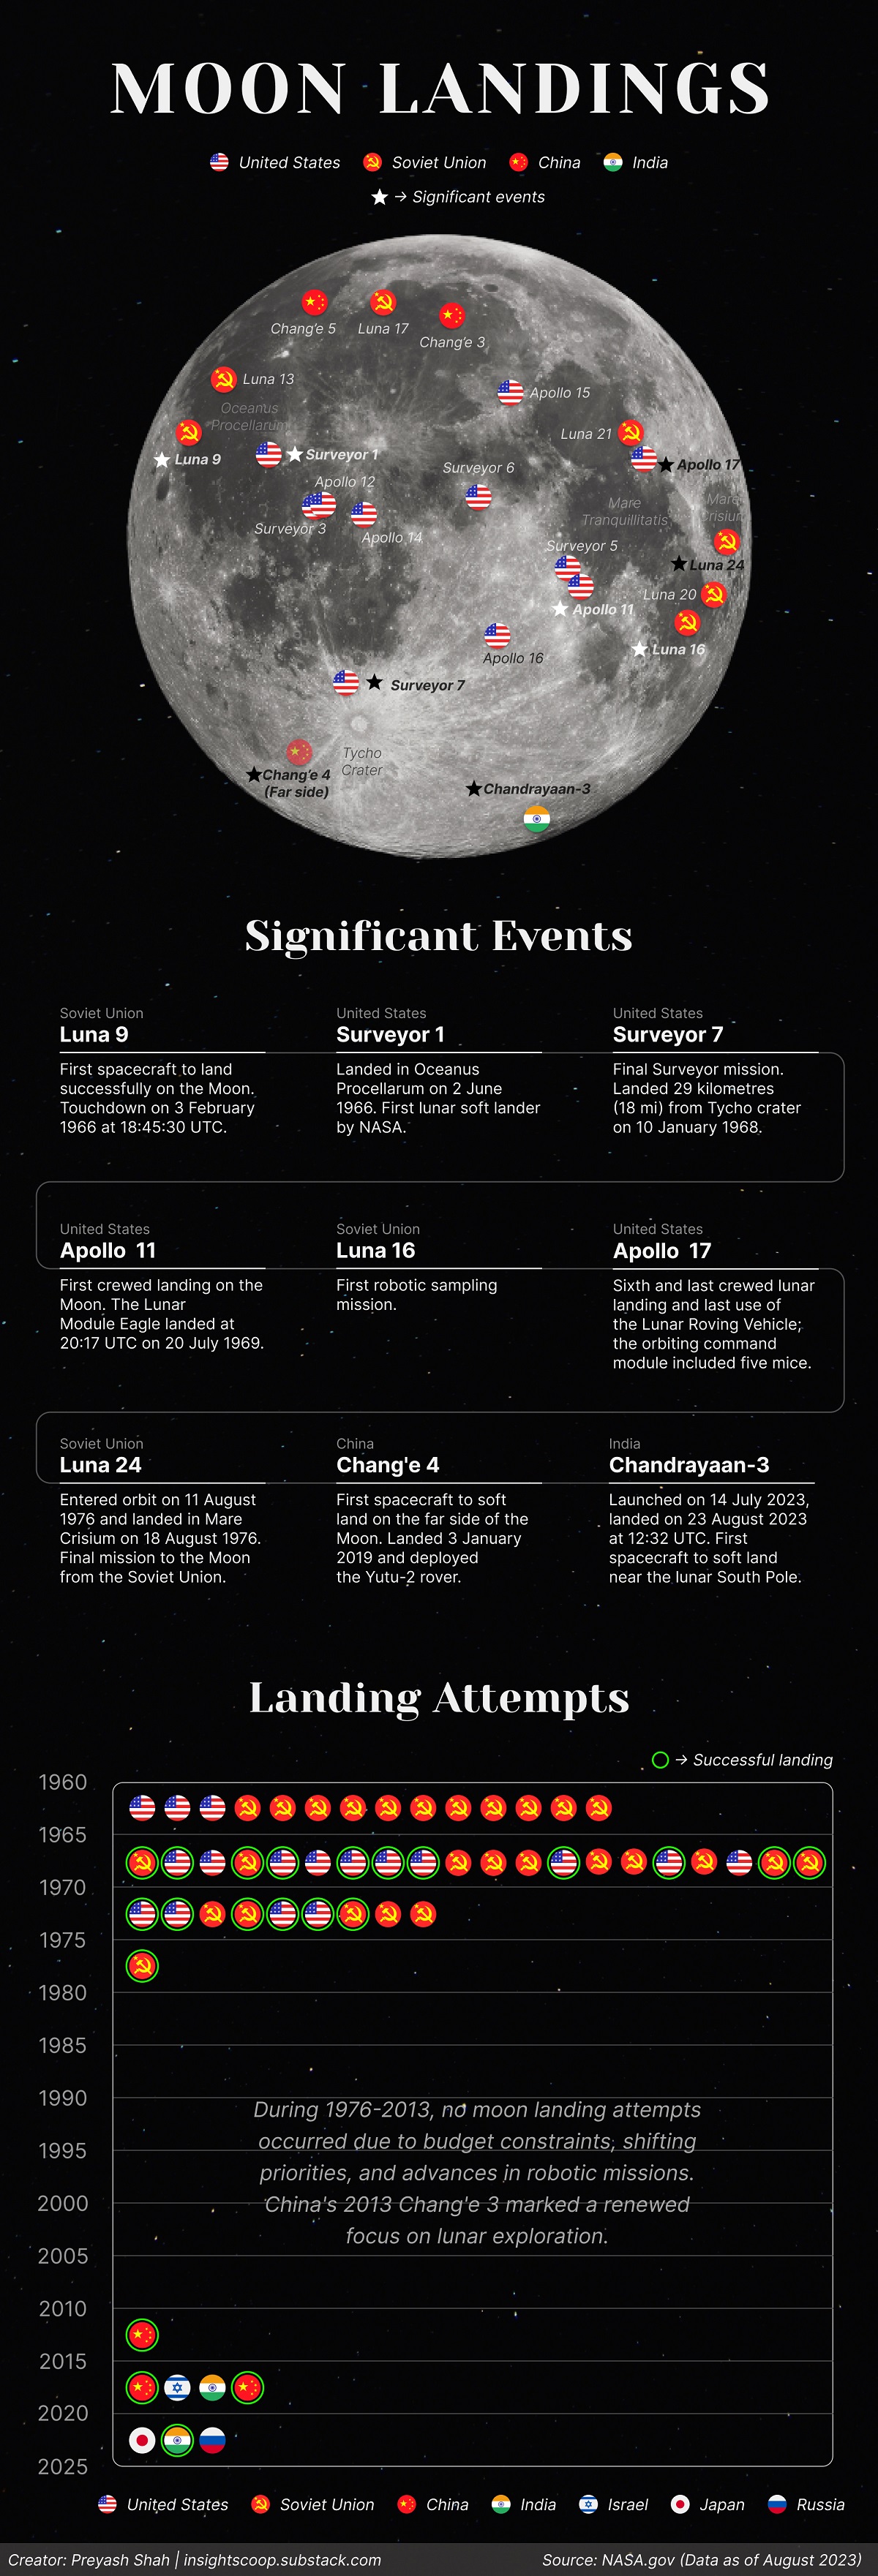
Visualizing All Attempted and Successful Moon Landings
Since the beginning of the space race, only four countries have successfully accomplished missions to the moon.
 Creator Program
Visualizing All Attempted and Successful Moon Landings
Since before Ancient Greece and the first Chinese Dynasties, people have sought to understand and learn more about the moon.
Curiosity and centuries of study culminated in the first moon landing in the 1960s. But there have been many other attempted moon landings, both before and after.
This chart by Preyash Shah illustrates all the moon landings using NASA data since 1966 when Soviet lander Luna 9 touched down.
Race to the Moon
The 1960s and 1970s marked an era of intense competition between the U.S. and the Soviet Union as they raced to conquer the moon.
During the Cold War, space became a priority as each side sought to prove the superiority of its technology, its military firepower, and its political-economic system.
In 1961, President John F. Kennedy set a national goal to have a crewed lunar landing and return to Earth.
After several failed attempts from both sides, on July 20, 1969, the Apollo 11 mission was successful and astronauts Neil Armstrong and Buzz Aldrin became the first humans to set foot on the moon.
| Mission | Launch Date | Operator | Country | Mission Type | Outcome |
|---|---|---|---|---|---|
| Ranger 3 | 26-Jan-62 | NASA | 🇺🇸 U.S. | Lander | Spacecraft failure |
| Ranger 4 | 23-Apr-62 | NASA | 🇺🇸 U.S. | Lander | Spacecraft failure |
| Ranger 5 | 18-Oct-62 | NASA | 🇺🇸 U.S. | Lander | Spacecraft failure |
| Luna E-6 No.2 | 4-Jan-63 | OKB-1 | ☭ USSR | Lander | Launch failure |
| Luna E-6 No.3 | 3-Feb-63 | OKB-1 | ☭ USSR | Lander | Launch failure |
| Luna 4 | 2-Apr-63 | OKB-1 | ☭ USSR | Lander | Spacecraft failure |
| Luna E-6 No.6 | 21-Mar-64 | OKB-1 | ☭ USSR | Lander | Launch failure |
| Luna E-6 No.5 | 20-Apr-64 | OKB-1 | ☭ USSR | Lander | Launch failure |
| Kosmos 60 | 12-Mar-65 | Lavochkin | ☭ USSR | Lander | Launch failure |
| Luna E-6 No.8 | 10-Apr-65 | Lavochkin | ☭ USSR | Lander | Spacecraft failure |
| Luna 5 | 9-May-65 | Lavochkin | ☭ USSR | Lander | Spacecraft failure |
| Luna 6 | 8-Jun-65 | Lavochkin | ☭ USSR | Lander | Spacecraft failure |
| Luna 7 | 4-Oct-65 | Lavochkin | ☭ USSR | Lander | Spacecraft failure |
| Luna 8 | 3-Dec-65 | Lavochkin | ☭ USSR | Lander | Spacecraft failure |
| Luna 9 | 31-Jan-66 | Lavochkin | ☭ USSR | Lander | Successful |
| Surveyor 1 | 30-May-66 | NASA | 🇺🇸 U.S. | Lander | Successful |
| Surveyor 2 | 20-Sep-66 | NASA | 🇺🇸 U.S. | Lander | Spacecraft failure |
| Luna 13 | 21-Dec-66 | Lavochkin | ☭ USSR | Lander | Successful |
| Surveyor 3 | 17-Apr-67 | NASA | 🇺🇸 U.S. | Lander | Successful |
| Surveyor 4 | 14-Jul-67 | NASA | 🇺🇸 U.S. | Lander | Spacecraft failure |
| Surveyor 5 | 8-Sep-67 | NASA | 🇺🇸 U.S. | Lander | Successful |
| Surveyor 6 | 7-Nov-67 | NASA | 🇺🇸 U.S. | Lander | Successful |
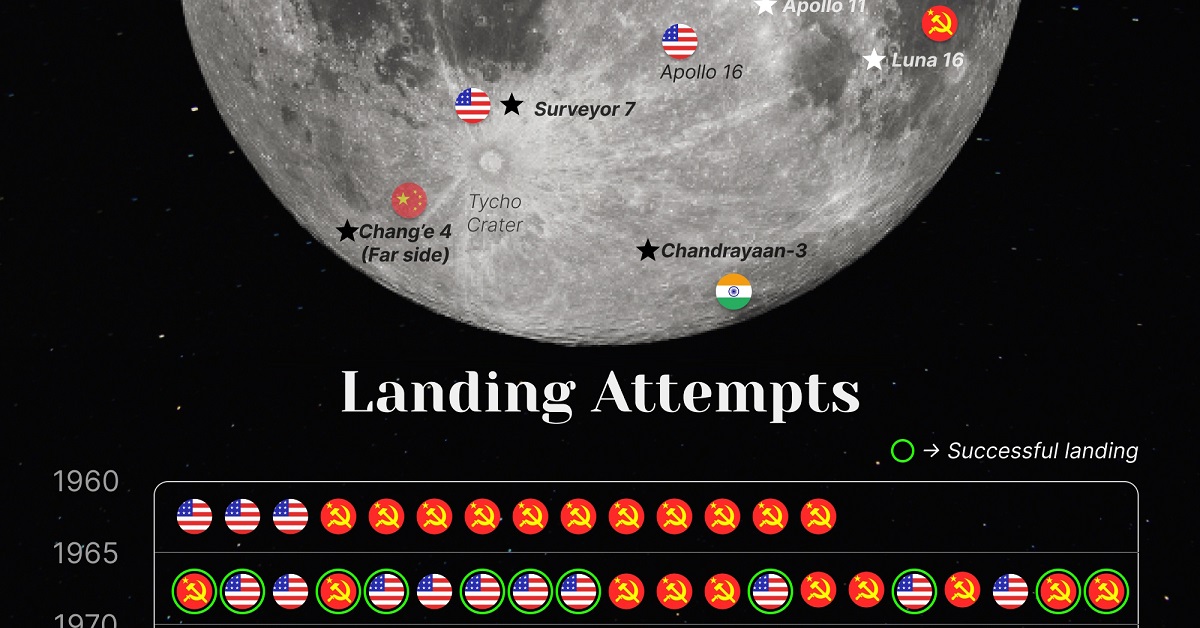
| Surveyor 7 | 7-Jan-68 | NASA | 🇺🇸 U.S. | Lander | Successful |
| Luna E-8 No.201 | 19-Feb-69 | Lavochkin | ☭ USSR | Lander | Launch failure |
| Luna E-8-5 No.402 | 14-Jun-69 | Lavochkin | ☭ USSR | Lander | Launch failure |
| Luna 15 | 13-Jul-69 | Lavochkin | ☭ USSR | Lander | Spacecraft failure |
| Apollo 11 | 16-Jul-69 | NASA | 🇺🇸 U.S. | Lander/ Launch Vehicle | Successful |
| Kosmos 300 | 23-Sep-69 | Lavochkin | ☭ USSR | Lander | Launch failure |
| Kosmos 305 | 22-Oct-69 | Lavochkin | ☭ USSR | Lander | Launch failure |
| Apollo 12 | 14-Nov-69 | NASA | 🇺🇸 U.S. | Lander/ Launch Vehicle | Successful |
| Luna E-8-5 No.405 | 6-Feb-70 | Lavochkin | ☭ USSR | Lander | Launch failure |
| Apollo 13 | 11-Apr-70 | NASA | 🇺🇸 U.S. | Lander/ Launch Vehicle | Partial failure |
| Luna 16 | 12-Sep-70 | Lavochkin | ☭ USSR | Lander | Successful |
| Luna 17 | 10-Nov-70 | Lavochkin | ☭ USSR | Lander | Successful |
| Apollo 14 | 31-Jan-71 | NASA | 🇺🇸 U.S. | Lander/ Launch Vehicle | Successful |
| Apollo 15 | 26-Jul-71 | NASA | 🇺🇸 U.S. | Lander/ Launch Vehicle | Successful |
| Luna 18 | 2-Sep-71 | Lavochkin | ☭ USSR | Lander | Spacecraft failure |
| Luna 20 | 14-Feb-72 | Lavochkin | ☭ USSR | Lander | Successful |
| Apollo 16 | 16-Apr-72 | NASA | 🇺🇸 U.S. | Lander/ Launch Vehicle | Successful |
| Apollo 17 | 7-Dec-72 | NASA | 🇺🇸 U.S. | Lander/ Launch Vehicle | Successful |
| Luna 21 | 8-Jan-73 | Lavochkin | ☭ USSR | Lander | Successful |
| Luna 23 | 16-Oct-75 | Lavochkin | ☭ USSR | Lander | Partial failure |
| Luna E-8-5M No.412 | 16-Oct-75 | Lavochkin | ☭ USSR | Lander | Launch failure |
| Luna 24 | 9-Aug-76 | Lavochkin | ☭ USSR | Lander | Successful |
| Chang'e 3 | 1-Dec-13 | CNSA | 🇨🇳 China | Lander | Operational |
| Chang'e 4 | 7-Dec-18 | CNSA | 🇨🇳 China | Lander | Operational |
| Beresheet | 22-Feb-19 | SpaceIL | 🇮🇱 Israel | Lander | Spacecraft failure |
| Chandrayaan-2 | 22-Jul-19 | ISRO | 🇮🇳 India | Lander | Spacecraft Failure |
| Chang'e 5 | 23-Nov-20 | CNSA | 🇨🇳 China | Lander | Successful |
| Hakuto-R Mission 1 | 11-Dec-22 | ispace | 🇯🇵 Japan | Lander | Spacecraft failure |
| Chandrayaan-3 | 14-Jul-23 | ISRO | 🇮🇳 India | Lander | Successful |
| Luna 25 | 10-Aug-23 | Roscosmos | 🇷🇺 Russia | Lander | Spacecraft failure |
After the Apollo missions, the fervor of lunar exploration waned. From 1976 to 2013, no moon landing attempts occurred due to budget constraints, shifting priorities, and advances in robotic missions.
However, a new chapter in space exploration has unfolded in recent years, with emerging players entering the cosmic arena. With its Chang’e missions, China has made significant strides, landing rovers on the moon and exploring the far side of the moon.
India, too, has asserted its presence with the Chandrayaan missions. In 2023, the country became the 4th nation to reach the moon as an unmanned spacecraft landed near the lunar south pole, advancing the country’s space ambitions to learn more about the lunar ice, potentially one of the moon’s most valuable resources.
Exploring Lunar Water
Since the 1960s, even before the historic Apollo landing, scientists had theorized the potential existence of water on the moon.
In 2008, Brown University researchers employed advanced technology to reexamine lunar samples, discovering hydrogen within beads of volcanic glass. And in 2009, a NASA instrument aboard the India’s Chandrayaan-1 probe confirmed the presence of water on the moon’s surface.
Water is deemed crucial for future space exploration. Beyond serving as a potential source of drinking water for future moon explorations, ice deposits could play a pivotal role in cooling equipment. Lunar ice could also be broken down to produce hydrogen for fuel and oxygen for breathing, essential for supporting extended space missions.
With a reinvigorated interest in exploring the moon, manned moon landings are on the horizon once again. In April 2023, NASA conducted tests for the launch of Artemis I, the first American spacecraft to aim for the moon since 1972. The agency aims to send astronauts to the moon around 2025 and build a base camp on the lunar surface.

-

 Debt1 week ago
How Debt-to-GDP Ratios Have Changed Since 2000
-

 Markets2 weeks ago
Ranked: The World’s Top Flight Routes, by Revenue
-

 Countries2 weeks ago
Population Projections: The World’s 6 Largest Countries in 2075
-

 Markets2 weeks ago
The Top 10 States by Real GDP Growth in 2023
-

 Demographics2 weeks ago
The Smallest Gender Wage Gaps in OECD Countries
-

 United States2 weeks ago
Where U.S. Inflation Hit the Hardest in March 2024
-

 Green2 weeks ago
Top Countries By Forest Growth Since 2001
-

 United States2 weeks ago
Ranked: The Largest U.S. Corporations by Number of Employees