Maps
Mapped: The Territorial Evolution of the U.S.
Mapped: The Territorial Evolution of the U.S.
The sun (almost) never sets on the American Empire.
The United States is the third largest country in the world, with a vast territory extending beyond the borders of the contiguous states. To be exact, the United States is made up of 50 states, nine uninhabited territories, five self-governing territories, one incorporated territory, and one federal district (Washington D.C.). The boundaries of the country haven’t changed much in recent years, but the lines on the map have shifted numerous times in history, through both negotiation and bloodshed.
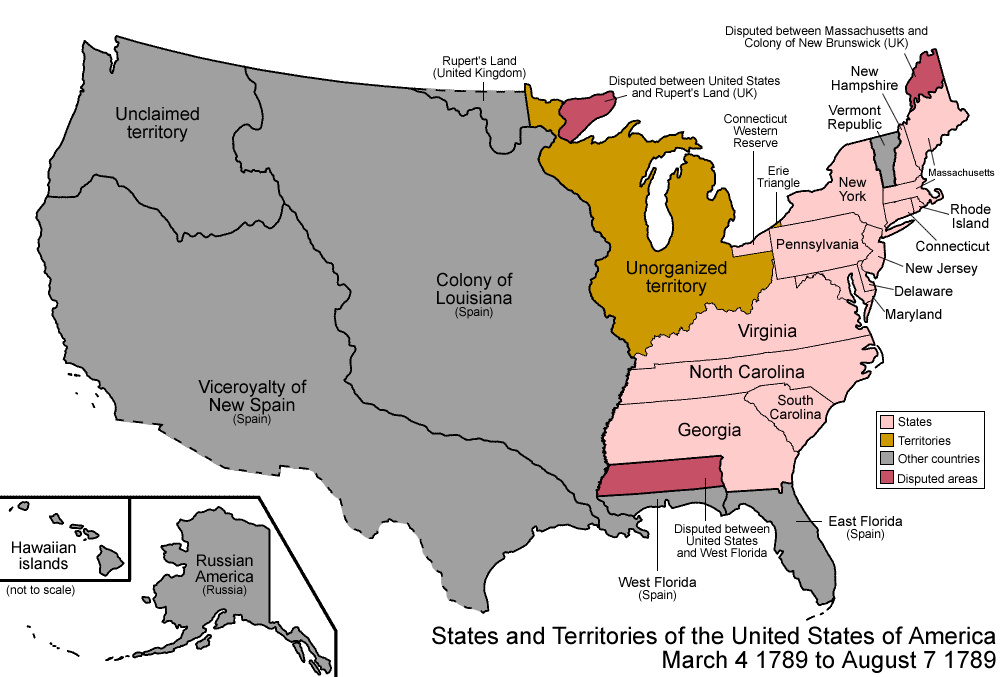
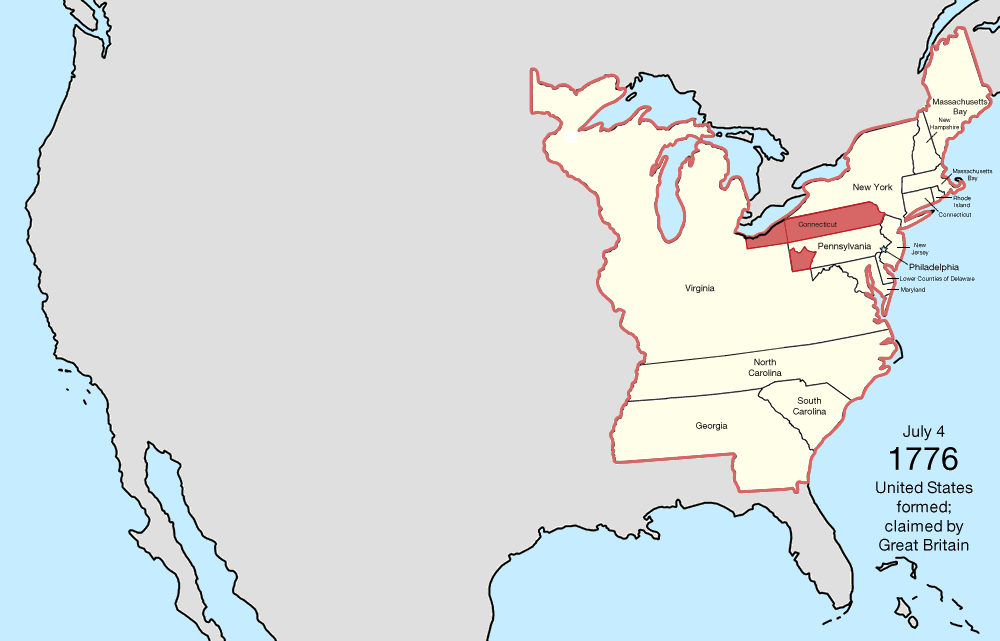
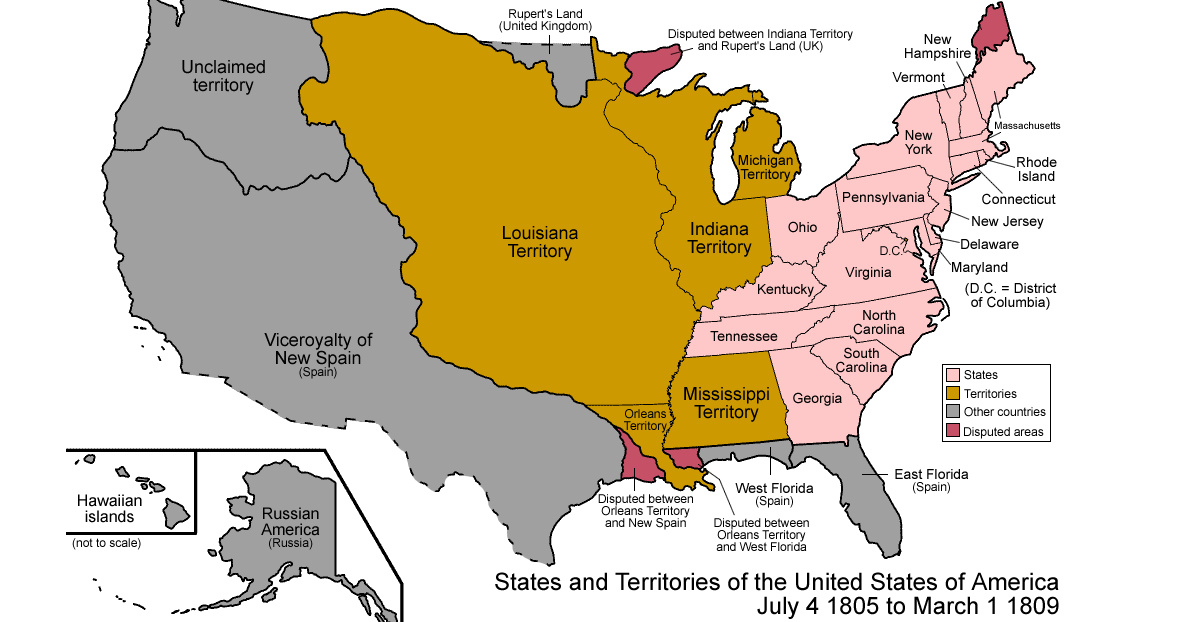
Today’s above animation, by u/Golbwiki, is the perfect visual aid to understand how the United States evolved from the Thirteen Colonies to its current form.
Here are five of the largest expansion events in U.S. history.
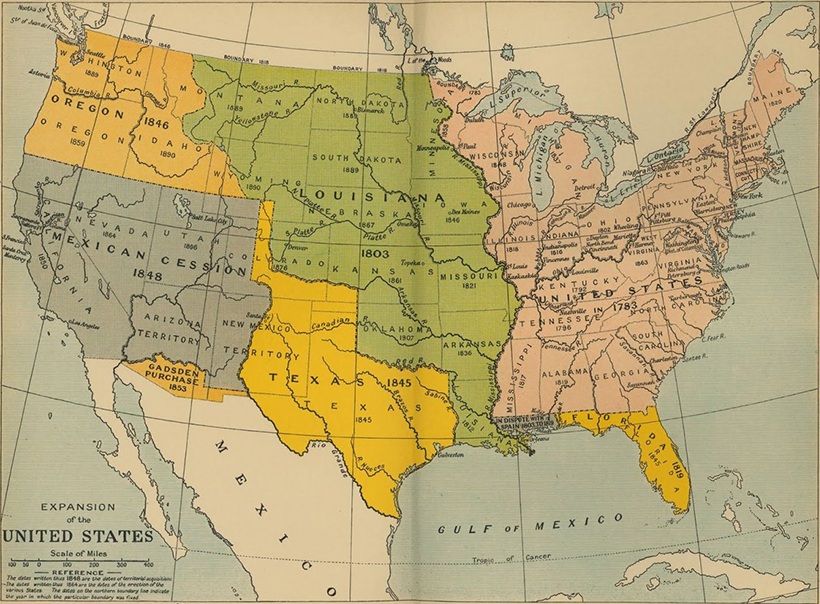
1803: Louisiana Purchase
Napoléon Bonaparte didn’t just have a huge impact on Europe, he also altered the course of history in the New World as well. The French General was waging an expensive war in Europe, and began to view the Louisiana Territory as a burden – as well as a potential source of income. In 1803, he offered up all 828,000 square miles for the famously low price of $15 million.
This massive land purchase comprises nearly 25% of the current territory of the United States, stretching from New Orleans all the way up to Montana and North Dakota.
1819: Adams–Onís Treaty
Spanish explorers first established a presence in Florida as far back as 1565, but 250 years later, Spain had done little to cement its foothold in the region. The Spanish realized they were in poor position to defend Florida should the U.S. decide to seize it.
In 1819, Secretary of State John Quincy Adams negotiated the signing of the Florida Purchase Treaty, which officially transferred Florida to the United States after years of negotiations. There was no official cost of purchase, but the U.S. government agreed to assume approximately $5 million of claims by U.S. citizens against Spain.
1845: Texas Annexation
The newly created Republic of Texas, which broke away from Mexico in the Texas Revolution, was peacefully annexed by the United States in 1845. In one fell swoop, the U.S. acquired 389,000 square miles of former Mexican territory.
1848: Mexican Cession
Shortly after the Texas Annexation, tensions between Mexico and the U.S. flared up anew.
Congress declared war on Mexico over a boundary dispute in 1846, and after a relatively brief armed conflict – known as the Mexican–American War – the two countries signed the Treaty of Guadalupe-Hidalgo.
The treaty recognized Texas as a U.S. state, and the United States took control of a huge parcel of land that includes the present-day states of California, Nevada, and Utah, as well as portions of Arizona, Colorado, New Mexico, and Wyoming. Mexico received $15 million in the arrangement, but saw the size of their territory halved.
1867: Alaska Purchase
In the aftermath of the Crimean War, Alexander II began exploring the possibility of selling Alaska. Similar to Spain’s foothold in Florida earlier in the century, the Russian Emperor recognized the possibility of American incursions into the territory, which they were not in a good position to defend against.
We must foresee that [the U.S.,] will take the afore-mentioned colonies from us and we shall not be able to regain them.
– Grand Duke Konstantin of Russia
After an all-night negotiation session on March 30, 1867, Alaska was sold to the United States for $7.2 million – the equivalent of $109 million in 2018. Alaska officially became a state in 1959.
Scratching the Surface
The examples above are only a brief overview of the complex evolution of shifting territorial claims in America.
For those who want to take a deep dive into the shifting borders of America, here is an extremely thorough animation, also by the same author:
Of course, colonial expansion in North America didn’t occur in a vacuum. For an Native American perspective on this topic, check out this animated map.
Maps
The Largest Earthquakes in the New York Area (1970-2024)
The earthquake that shook buildings across New York in April 2024 was the third-largest quake in the Northeast U.S. over the past 50 years.


The Largest Earthquakes in the New York Area
This was originally posted on our Voronoi app. Download the app for free on Apple or Android and discover incredible data-driven charts from a variety of trusted sources.
The 4.8 magnitude earthquake that shook buildings across New York on Friday, April 5th, 2024 was the third-largest quake in the U.S. Northeast area over the past 50 years.
In this map, we illustrate earthquakes with a magnitude of 4.0 or greater recorded in the Northeastern U.S. since 1970, according to the United States Geological Survey (USGS).
Shallow Quakes and Older Buildings
The earthquake that struck the U.S. Northeast in April 2024 was felt by millions of people from Washington, D.C., to north of Boston. It even caused a full ground stop at Newark Airport.
The quake, occurring just 5 km beneath the Earth’s surface, was considered shallow, which is what contributed to more intense shaking at the surface.
According to the USGS, rocks in the eastern U.S. are significantly older, denser, and harder than those on the western side, compressed by time. This makes them more efficient conduits for seismic energy. Additionally, buildings in the Northeast tend to be older and may not adhere to the latest earthquake codes.
Despite disrupting work and school life, the earthquake was considered minor, according to the Michigan Technological University magnitude scale:
| Magnitude | Earthquake Effects | Estimated Number Each Year |
|---|---|---|
| 2.5 or less | Usually not felt, but can be recorded by seismograph. | Millions |
| 2.5 to 5.4 | Often felt, but only causes minor damage. | 500,000 |
| 5.5 to 6.0 | Slight damage to buildings and other structures. | 350 |
| 6.1 to 6.9 | May cause a lot of damage in very populated areas. | 100 |
| 7.0 to 7.9 | Major earthquake. Serious damage. | 10-15 |
| 8.0 or greater | Great earthquake. Can totally destroy communities near the epicenter. | One every year or two |
The largest earthquake felt in the area over the past 50 years was a 5.3 magnitude quake that occurred in Au Sable Forks, New York, in 2002. It damaged houses and cracked roads in a remote corner of the Adirondack Mountains, but caused no injuries.
| Date | Magnitude | Location | State |
|---|---|---|---|
| April 20, 2002 | 5.3 | Au Sable Forks | New York |
| October 7, 1983 | 5.1 | Newcomb | New York |
| April 5, 2024 | 4.8 | Whitehouse Station | New Jersey |
| October 16, 2012 | 4.7 | Hollis Center | Maine |
| January 16, 1994 | 4.6 | Sinking Spring | Pennsylvania |
| January 19, 1982 | 4.5 | Sanbornton | New Hampshire |
| September 25, 1998 | 4.5 | Adamsville | Pennsylvania |
| June 9, 1975 | 4.2 | Altona | New York |
| May 29, 1983 | 4.2 | Peru | Maine |
| April 23, 1984 | 4.2 | Conestoga | Pennsylvania |
| January 16, 1994 | 4.2 | Sinking Spring | Pennsylvania |
| November 3, 1975 | 4 | Long Lake | New York |
| June 17, 1991 | 4 | Worcester | New York |
The largest earthquake in U.S. history, however, was the 1964 Good Friday quake in Alaska, measuring 9.2 magnitude and killing 131 people.

-

 Maps2 weeks ago
Mapped: Average Wages Across Europe
-

 Money1 week ago
Which States Have the Highest Minimum Wage in America?
-

 Real Estate1 week ago
Ranked: The Most Valuable Housing Markets in America
-

 Markets1 week ago
Charted: Big Four Market Share by S&P 500 Audits
-

 AI1 week ago
The Stock Performance of U.S. Chipmakers So Far in 2024
-

 Automotive2 weeks ago
Almost Every EV Stock is Down After Q1 2024
-

 Money2 weeks ago
Where Does One U.S. Tax Dollar Go?
-

 Green2 weeks ago
Ranked: Top Countries by Total Forest Loss Since 2001