Technology
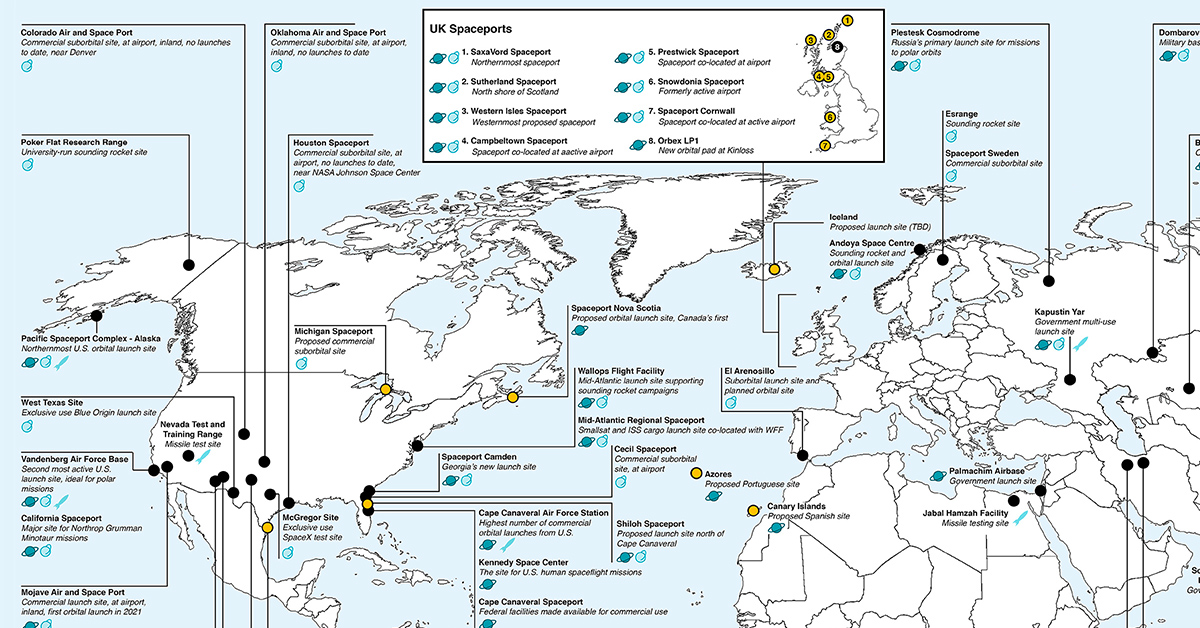
All of the World’s Spaceports on One Map
View the high-resolution map
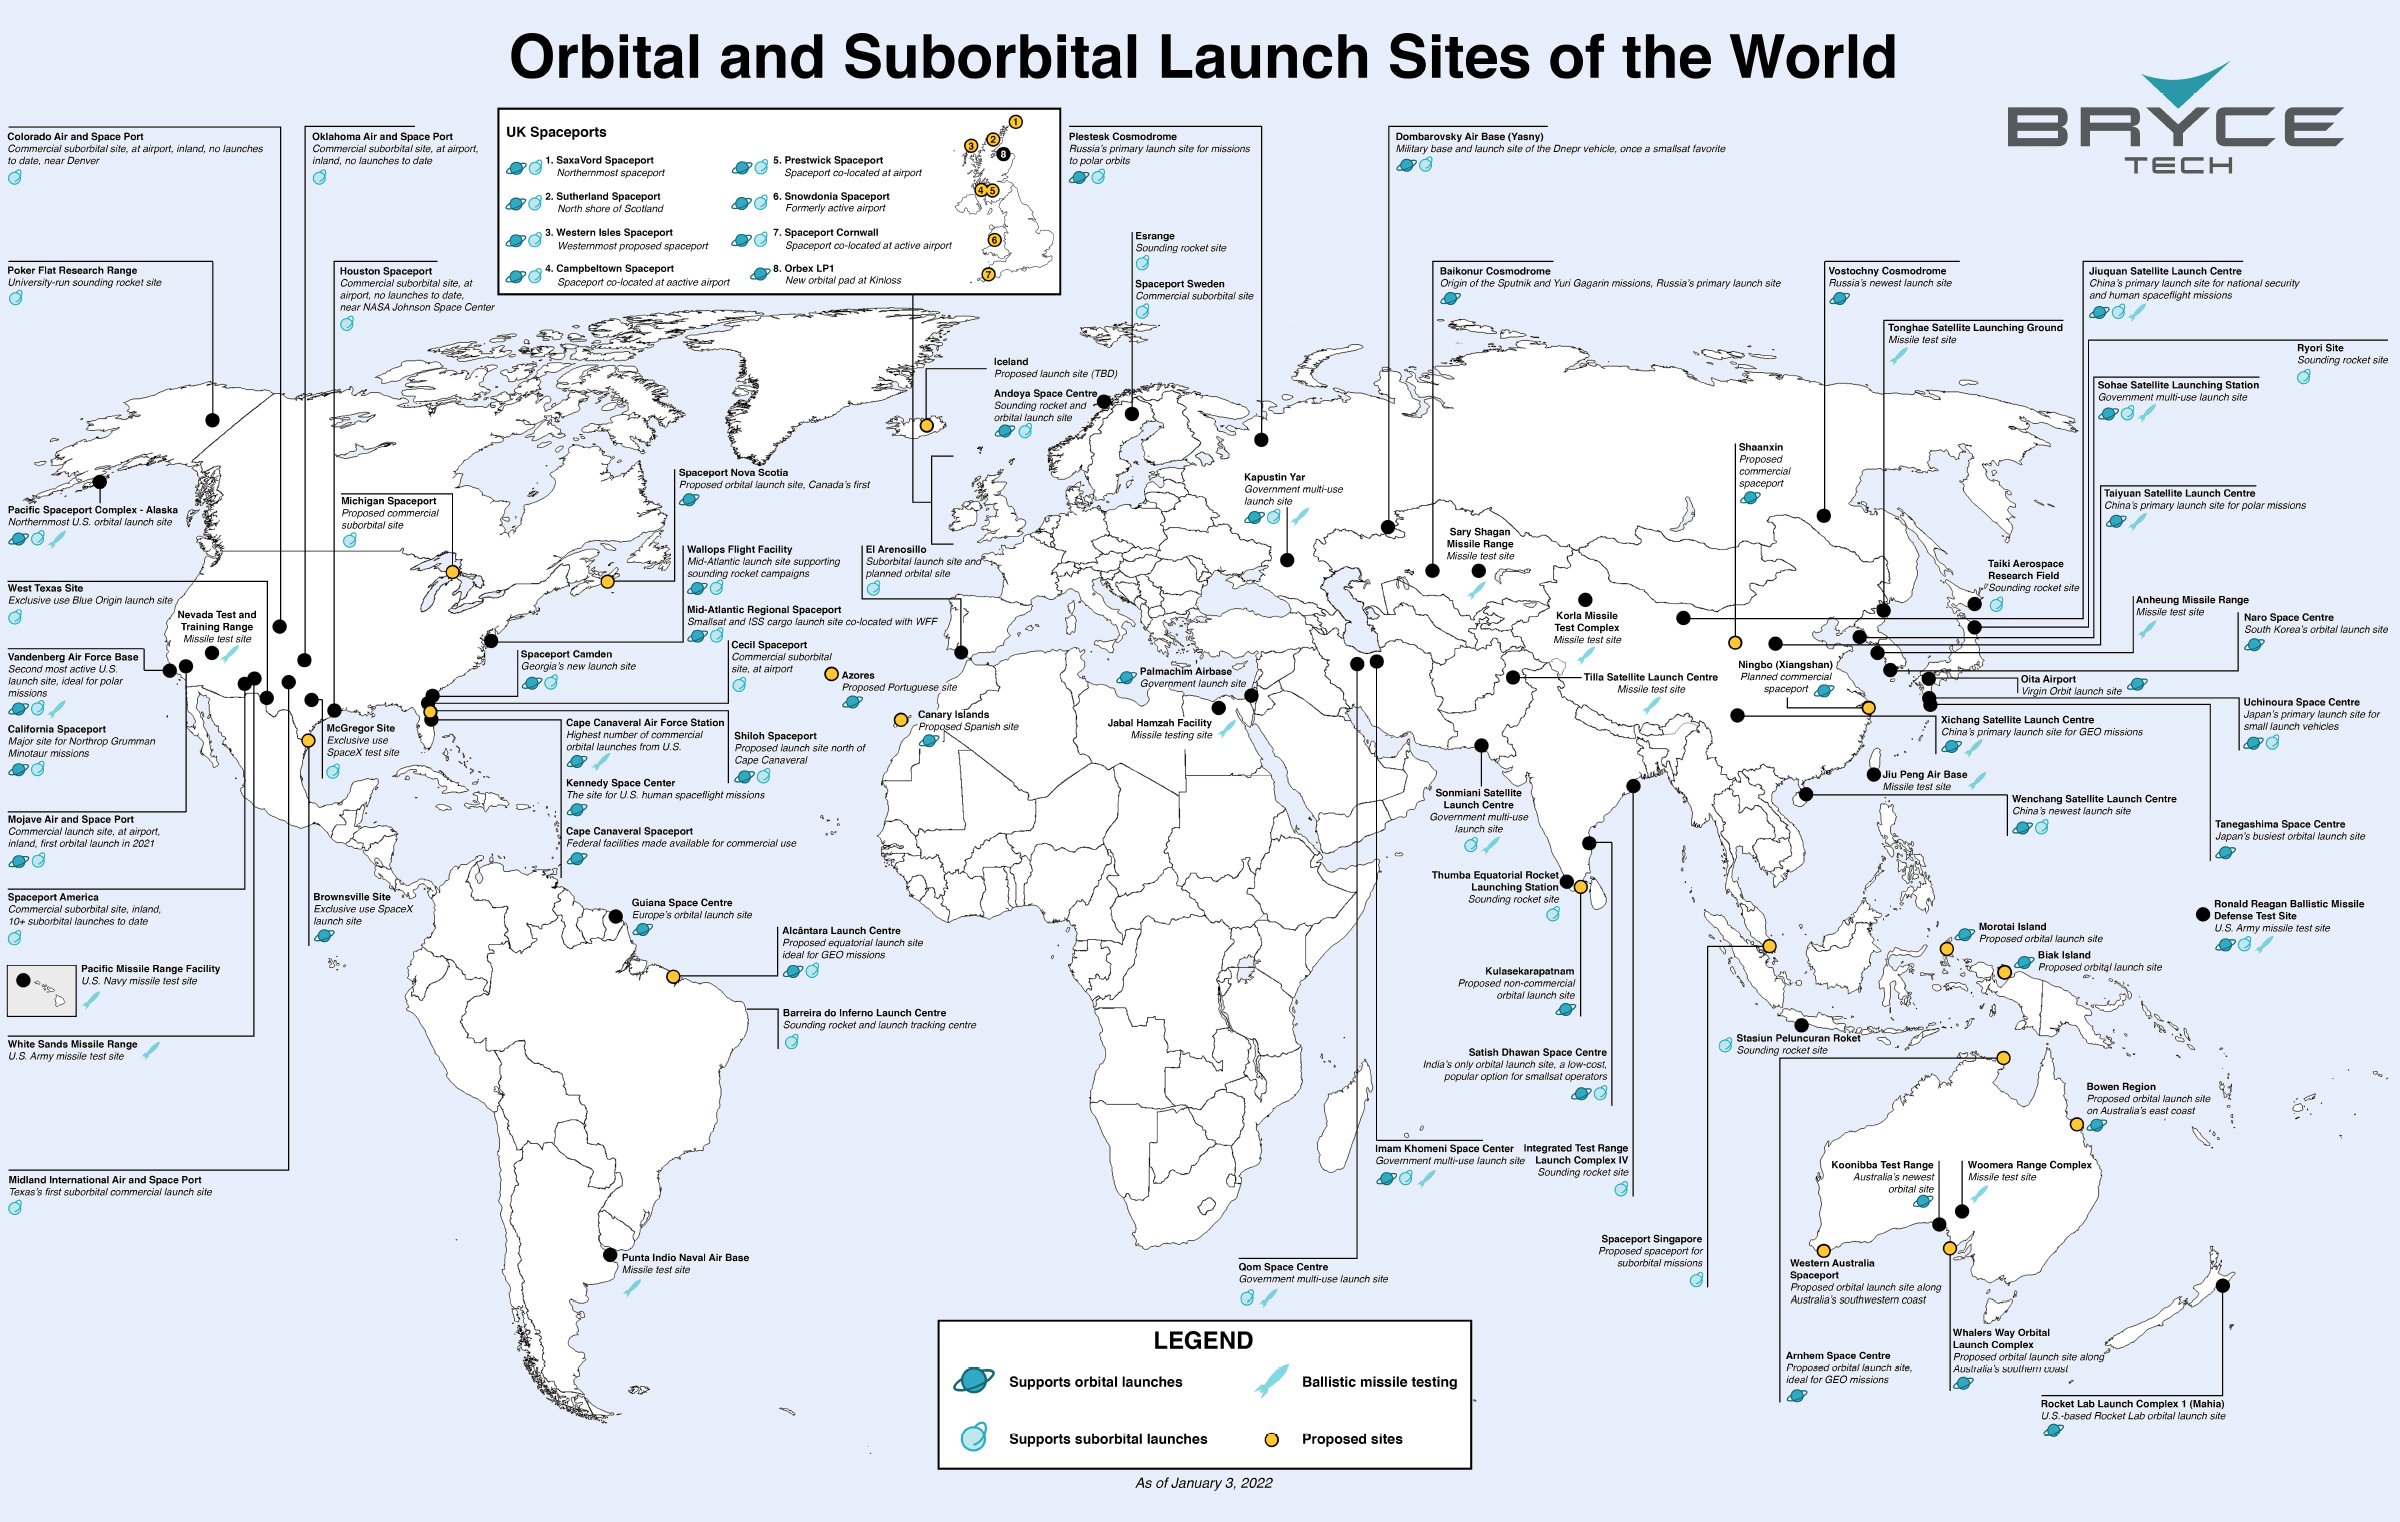
Mapped: The World’s Rocket Launch Sites
From Sputnik 1 to today’s massive satellite constellations, every object in space was launched from just a handful of locations.
The map above, from BryceTech, is a comprehensive look at the world’s spaceports (both orbital and sub-orbital) as well as ballistic missile test sites.
The World’s Major Spaceports
Though the graphic above is a detailed list of many types of rocket launch sites, we’ll focus on major sites that are sending satellites and passengers into sub-orbit, orbit, and beyond.
| Launch Facility | Location | Country |
|---|---|---|
| Cape Canaveral Space Force Station | Florida | 🇺🇸 U.S. |
| Cape Canaveral Spaceport | Florida | 🇺🇸 U.S. |
| Kennedy Space Center | Florida | 🇺🇸 U.S. |
| Cecil Field Spaceport | Florida | 🇺🇸 U.S. |
| Colorado Air & Space Port | Colorado | 🇺🇸 U.S. |
| Vandenberg Air Force Base | California | 🇺🇸 U.S. |
| Mojave Air and Space Port | California | 🇺🇸 U.S. |
| Oklahoma Air & Space Port | Oklahoma | 🇺🇸 U.S. |
| Poker Flat Research Range | Alaska | 🇺🇸 U.S. |
| Pacific Spaceport Complex | Alaska | 🇺🇸 U.S. |
| Spaceport America | New Mexico | 🇺🇸 U.S. |
| Launch Site One (Corn Ranch) | Texas | 🇺🇸 U.S. |
| Houston Spaceport | Texas | 🇺🇸 U.S. |
| Midland Air & Space Port | Texas | 🇺🇸 U.S. |
| SpaceX Development and Test Facility | Texas | 🇺🇸 U.S. |
| SpaceX Starbase | Texas | 🇺🇸 U.S. |
| Spaceport Camden | Georgia | 🇺🇸 U.S. |
| Mid-Atlantic Regional Spaceport | Virginia | 🇺🇸 U.S. |
| Wallops Flight Facility | Virginia | 🇺🇸 U.S. |
| Reagan Test Site | Kwajalein Atoll | 🇲🇭 Marshall Islands |
| Naro Space Center | Outer Naro Island | 🇰🇷 South Korea |
| Sohae Satellite Launching Station | North Pyongan Province | 🇰🇵 North Korea |
| Kapustin Yar | Astrakhan Oblast | 🇷🇺 Russia |
| Plesetsk Cosmodrome | Arkhangelsk Oblast | 🇷🇺 Russia |
| Vostochny Cosmodrome | Amur Oblast | 🇷🇺 Russia |
| Yasny Launch Base | Orenburg Oblast | 🇷🇺 Russia |
| Arnhem Space Centre | Northern Territory | 🇦🇺 Australia |
| Whalers Way Orbital Launch Complex | South Australia | 🇦🇺 Australia |
| Koonibba Test Range | South Australia | 🇦🇺 Australia |
| Bowen Orbital Spaceport | Queensland | 🇦🇺 Australia |
| Rocket Lab Launch Complex 1 | Wairoa District | 🇳🇿 New Zealand |
| Baikonur Cosmodrome | Baikonur | 🇰🇿 Kazakhstan |
| Space Port Oita | Ōita | 🇯🇵 Japan |
| Tanegashima Space Center | Kagoshima | 🇯🇵 Japan |
| Uchinoura Space Center | Kagoshima | 🇯🇵 Japan |
| Taiki Aerospace Research Field | Hokkaido | 🇯🇵 Japan |
| Hokkaido Spaceport | Hokkaido | 🇯🇵 Japan |
| Ryori Launch Site | Iwate | 🇯🇵 Japan |
| Sonmiani Satellite Launch Center | Balochistan | 🇵🇰 Pakistan |
| Integrated Test Range | Odisha | 🇮🇳 India |
| Thumba Equatorial Rocket Launching Station | Kerala | 🇮🇳 India |
| Satish Dhawan Space Centre | Sriharikota | 🇮🇳 India |
| Guiana Space Centre | Kourou | 🇬🇫 French Guiana |
| Barreira do Inferno Launch Center | Rio Grande do Norte | 🇧🇷 Brazil |
| Alcântara Space Center | Maranhão | 🇧🇷 Brazil |
| Stasiun Peluncuran Roket | West Java | 🇮🇩 Indonesia |
| Jiuquan Satellite Launch Center | Gansu Province | 🇨🇳 China |
| Taiyuan Satellite Launch Center | Shanxi Province | 🇨🇳 China |
| Wenchang Spacecraft Launch Site | Hainan Province | 🇨🇳 China |
| Xichang Satellite Launch Center | Sichuan Province | 🇨🇳 China |
| Palmachim Airbase | Central District | 🇮🇱 Israel |
| Imam Khomeini Space Launch Terminal | Semnan | 🇮🇷 Iran |
| Qom Lauch Facility | Qom | 🇮🇷 Iran |
| El Arenosillo Test Centre | Huelva | 🇪🇸 Spain |
| Spaceport Sweden | Lapland | 🇸🇪 Sweden |
| Esrange Space Center | Lapland | 🇸🇪 Sweden |
| Andøya Space | Nordland | 🇳🇴 Norway |
| SaxaVord Spaceport | Shetland Islands | 🇬🇧 UK |
| Sutherland Spaceport | Sutherland | 🇬🇧 UK |
| Western Isles Spaceport | Outer Hebrides | 🇬🇧 UK |
| Spaceport Machrihanish | Campbeltown | 🇬🇧 UK |
| Prestwick Spaceport | Glasgow | 🇬🇧 UK |
| Snowdonia Spaceport | North West Wales | 🇬🇧 UK |
| Spaceport Cornwall | Cornwall | 🇬🇧 UK |
| Orbex LP1 | Moray | 🇬🇧 UK |
| Spaceport Nova Scotia | Nova Scotia | 🇨🇦 Canada |
Editor’s note: The above table includes all sites that are operational, as well as under construction, as of publishing date.
The list above covers fixed locations, and does not include SpaceX’s autonomous spaceport drone ships. There are currently three active drone ships—one based near Los Angeles, and the other two based at Port Canaveral, Florida.
Two of the most famous launch sites on the list are the Baikonur Cosmodrome (Kazakhstan) and Cape Canaveral (United States). The former was constructed as the base of operations for the Soviet space program and was the launch point for Earth’s first artificial satellite, Sputnik 1. The latter was NASA’s primary base of operations and the first lunar-landing flight was launched from there in 1969.
The global roster of spaceports has grown immensely since Baikonur and Cape Canaveral were the only game in town. Now numerous countries have the ability to launch satellites, and many more are getting in on the action.
Wenchang Space Launch Site, on the island of Hainan, is China’s newest launch location. The site recorded its first successful launch in 2016.
Location, Location
One interesting quirk of the map above is the lack of spaceports in Europe. Europe’s ambitions for space are actually launched from the Guiana Space Centre in South America. Europe’s Spaceport has been operating in French Guiana since 1968.
Low altitude launch locations near the equator are the most desirable, as far less energy is required to take a spacecraft from surface level to an equatorial, geostationary orbit.
Islands and coastal areas are also common locations for launch sites. Since the open waters aren’t inhabited, there is minimal risk of harm from debris in the event of a launch failure.
As demand for satellites and space exploration grows, the number of launch locations will continue to grow as well.


Technology
All of the Grants Given by the U.S. CHIPS Act
Intel, TSMC, and more have received billions in subsidies from the U.S. CHIPS Act in 2024.


All of the Grants Given by the U.S. CHIPS Act
This was originally posted on our Voronoi app. Download the app for free on iOS or Android and discover incredible data-driven charts from a variety of trusted sources.
This visualization shows which companies are receiving grants from the U.S. CHIPS Act, as of April 25, 2024. The CHIPS Act is a federal statute signed into law by President Joe Biden that authorizes $280 billion in new funding to boost domestic research and manufacturing of semiconductors.
The grant amounts visualized in this graphic are intended to accelerate the production of semiconductor fabrication plants (fabs) across the United States.
Data and Company Highlights
The figures we used to create this graphic were collected from a variety of public news sources. The Semiconductor Industry Association (SIA) also maintains a tracker for CHIPS Act recipients, though at the time of writing it does not have the latest details for Micron.
| Company | Federal Grant Amount | Anticipated Investment From Company |
|---|---|---|
| 🇺🇸 Intel | $8,500,000,000 | $100,000,000,000 |
| 🇹🇼 TSMC | $6,600,000,000 | $65,000,000,000 |
| 🇰🇷 Samsung | $6,400,000,000 | $45,000,000,000 |
| 🇺🇸 Micron | $6,100,000,000 | $50,000,000,000 |
| 🇺🇸 GlobalFoundries | $1,500,000,000 | $12,000,000,000 |
| 🇺🇸 Microchip | $162,000,000 | N/A |
| 🇬🇧 BAE Systems | $35,000,000 | N/A |
BAE Systems was not included in the graphic due to size limitations
Intel’s Massive Plans
Intel is receiving the largest share of the pie, with $8.5 billion in grants (plus an additional $11 billion in government loans). This grant accounts for 22% of the CHIPS Act’s total subsidies for chip production.
From Intel’s side, the company is expected to invest $100 billion to construct new fabs in Arizona and Ohio, while modernizing and/or expanding existing fabs in Oregon and New Mexico. Intel could also claim another $25 billion in credits through the U.S. Treasury Department’s Investment Tax Credit.
TSMC Expands its U.S. Presence
TSMC, the world’s largest semiconductor foundry company, is receiving a hefty $6.6 billion to construct a new chip plant with three fabs in Arizona. The Taiwanese chipmaker is expected to invest $65 billion into the project.
The plant’s first fab will be up and running in the first half of 2025, leveraging 4 nm (nanometer) technology. According to TrendForce, the other fabs will produce chips on more advanced 3 nm and 2 nm processes.
The Latest Grant Goes to Micron
Micron, the only U.S.-based manufacturer of memory chips, is set to receive $6.1 billion in grants to support its plans of investing $50 billion through 2030. This investment will be used to construct new fabs in Idaho and New York.

-

 Education1 week ago
How Hard Is It to Get Into an Ivy League School?
-

 Technology2 weeks ago
Ranked: Semiconductor Companies by Industry Revenue Share
-

 Markets2 weeks ago
Ranked: The World’s Top Flight Routes, by Revenue
-

 Demographics2 weeks ago
Population Projections: The World’s 6 Largest Countries in 2075
-

 Markets2 weeks ago
The Top 10 States by Real GDP Growth in 2023
-

 Demographics2 weeks ago
The Smallest Gender Wage Gaps in OECD Countries
-

 Economy2 weeks ago
Where U.S. Inflation Hit the Hardest in March 2024
-

 Green2 weeks ago
Top Countries By Forest Growth Since 2001