Technology
The Global Fiber Optic Network Explained
The Global Fiber Optic Network Explained
As we scroll through Instagram or cue up another episode on Netflix, most of us give little thought to the hidden network of fiber optic cables that instantaneously shuttle information around the globe.
This extensive network of cables – which could stretch around the Equator 30 times – is the connective tissue that binds the internet, and thanks to our insatiable appetite for video streaming, it’s growing larger with every passing year.
Today’s video, by TED-Ed, explains how fiber optic cables work and introduces the next generation of cables that could drastically increase the speed of data transmission.
A Series of Tubes
The late Senator Ted Stevens drew laughter for describing the internet as a “series of tubes” in 2006, but as it turns out, most of the information moving around the world does, in fact, travel through a series of tubes. Undersea fiber optic tubes, to be exact.
The way this system functions is deceptively simple. Light, which is beamed into a fiber optic cable at a shallow angle, ricochets its way along the tube at close to light speed until being converted back into an electrical signal at its destination – generally a data center. To increase bandwidth further, some cables are able to carry multiple wavelengths concurrently.
Impressively, this simple method of bouncing light through a tube is what moves 99% of the world’s digital information.
The Glass Superhighway
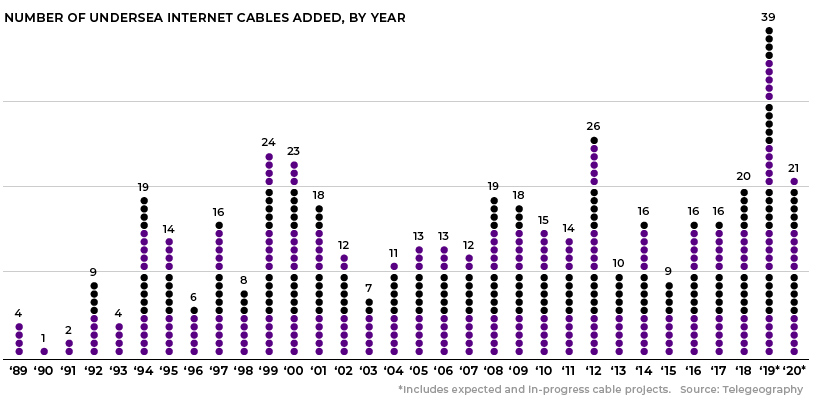
Since the first undersea fiber optic cable, TAT-8, was constructed by a consortium of companies in 1988, the number of cables snaking across the ocean floor has risen dramatically. In fact, over 100 new cables will have been laid between 2016 and 2020, with a value of nearly $14 billion.
Increasing bandwidth requirements have transformed content providers from customers to cable owners. As a result, tech giants like Google and Facebook are taking a more active role in the expansion of the global fiber optic network. Google alone has at least five cable projects set for completion in 2019.
The Last Mile
Much like Amazon struggles with the “last mile” of deliveries, the transmission of digital information is much less efficient at the data center level, where servers are connected by traditional electric cables. These short-range cables are far less efficient than their fiber optic counterparts, losing half their running power as heat.
If this inefficient use of energy isn’t solved, internet-related activity could comprise a fifth of the world’s power consumption by 2030.
Thankfully, a related technology – integrated photonics – could keep the high-definition videos of the future streaming. Although the silicon wires used in integrated photonics do not guide light as effectively as fiber optics, the ultra-thin wires are far more compact. Photonic chips paired with burgeoning terahertz (THz) wireless communications could eventually form the backbone of a 6G network. Short-range THz signals would hitch a ride on silicon wires via tiny photonic chips scattered around population centers.
Before this efficient, high-capacity future is realized, researchers must first solve the puzzle of manufacturing photonic devices at scale. Once this method of data transmission hits the mainstream market, it could drastically alter the course of both computing and global energy consumption.


Technology
Visualizing AI Patents by Country
See which countries have been granted the most AI patents each year, from 2012 to 2022.


Visualizing AI Patents by Country
This was originally posted on our Voronoi app. Download the app for free on iOS or Android and discover incredible data-driven charts from a variety of trusted sources.
This infographic shows the number of AI-related patents granted each year from 2010 to 2022 (latest data available). These figures come from the Center for Security and Emerging Technology (CSET), accessed via Stanford University’s 2024 AI Index Report.
From this data, we can see that China first overtook the U.S. in 2013. Since then, the country has seen enormous growth in the number of AI patents granted each year.
| Year | China | EU and UK | U.S. | RoW | Global Total |
|---|---|---|---|---|---|
| 2010 | 307 | 137 | 984 | 571 | 1,999 |
| 2011 | 516 | 129 | 980 | 581 | 2,206 |
| 2012 | 926 | 112 | 950 | 660 | 2,648 |
| 2013 | 1,035 | 91 | 970 | 627 | 2,723 |
| 2014 | 1,278 | 97 | 1,078 | 667 | 3,120 |
| 2015 | 1,721 | 110 | 1,135 | 539 | 3,505 |
| 2016 | 1,621 | 128 | 1,298 | 714 | 3,761 |
| 2017 | 2,428 | 144 | 1,489 | 1,075 | 5,136 |
| 2018 | 4,741 | 155 | 1,674 | 1,574 | 8,144 |
| 2019 | 9,530 | 322 | 3,211 | 2,720 | 15,783 |
| 2020 | 13,071 | 406 | 5,441 | 4,455 | 23,373 |
| 2021 | 21,907 | 623 | 8,219 | 7,519 | 38,268 |
| 2022 | 35,315 | 1,173 | 12,077 | 13,699 | 62,264 |
In 2022, China was granted more patents than every other country combined.
While this suggests that the country is very active in researching the field of artificial intelligence, it doesn’t necessarily mean that China is the farthest in terms of capability.
Key Facts About AI Patents
According to CSET, AI patents relate to mathematical relationships and algorithms, which are considered abstract ideas under patent law. They can also have different meaning, depending on where they are filed.
In the U.S., AI patenting is concentrated amongst large companies including IBM, Microsoft, and Google. On the other hand, AI patenting in China is more distributed across government organizations, universities, and tech firms (e.g. Tencent).
In terms of focus area, China’s patents are typically related to computer vision, a field of AI that enables computers and systems to interpret visual data and inputs. Meanwhile America’s efforts are more evenly distributed across research fields.
Learn More About AI From Visual Capitalist
If you want to see more data visualizations on artificial intelligence, check out this graphic that shows which job departments will be impacted by AI the most.

-

 Mining1 week ago
Gold vs. S&P 500: Which Has Grown More Over Five Years?
-

 Markets2 weeks ago
Ranked: The Most Valuable Housing Markets in America
-

 Money2 weeks ago
Which States Have the Highest Minimum Wage in America?
-

 AI2 weeks ago
Ranked: Semiconductor Companies by Industry Revenue Share
-

 Markets2 weeks ago
Ranked: The World’s Top Flight Routes, by Revenue
-

 Countries2 weeks ago
Population Projections: The World’s 6 Largest Countries in 2075
-

 Markets2 weeks ago
The Top 10 States by Real GDP Growth in 2023
-

 Demographics2 weeks ago
The Smallest Gender Wage Gaps in OECD Countries