Technology
Amazon’s Massive Distribution Network in One Giant Visualization
View a high resolution version of this graphic.
Amazon’s Massive Distribution Network in One Visualization
View the high resolution version of today’s graphic by clicking here.
Last year, Amazon shipped over 5 billion (with a “B”) Prime packages, and the retail giant’s ecommerce market share in the U.S. is on the verge of surpassing 50%.
Moving that kind of volume takes an impressive amount of technical sophistication, manpower, and distribution infrastructure. While Amazon does lean on third parties for deliveries and warehousing, the company is also building an increasingly expansive distribution network in an attempt to manage the entire process.
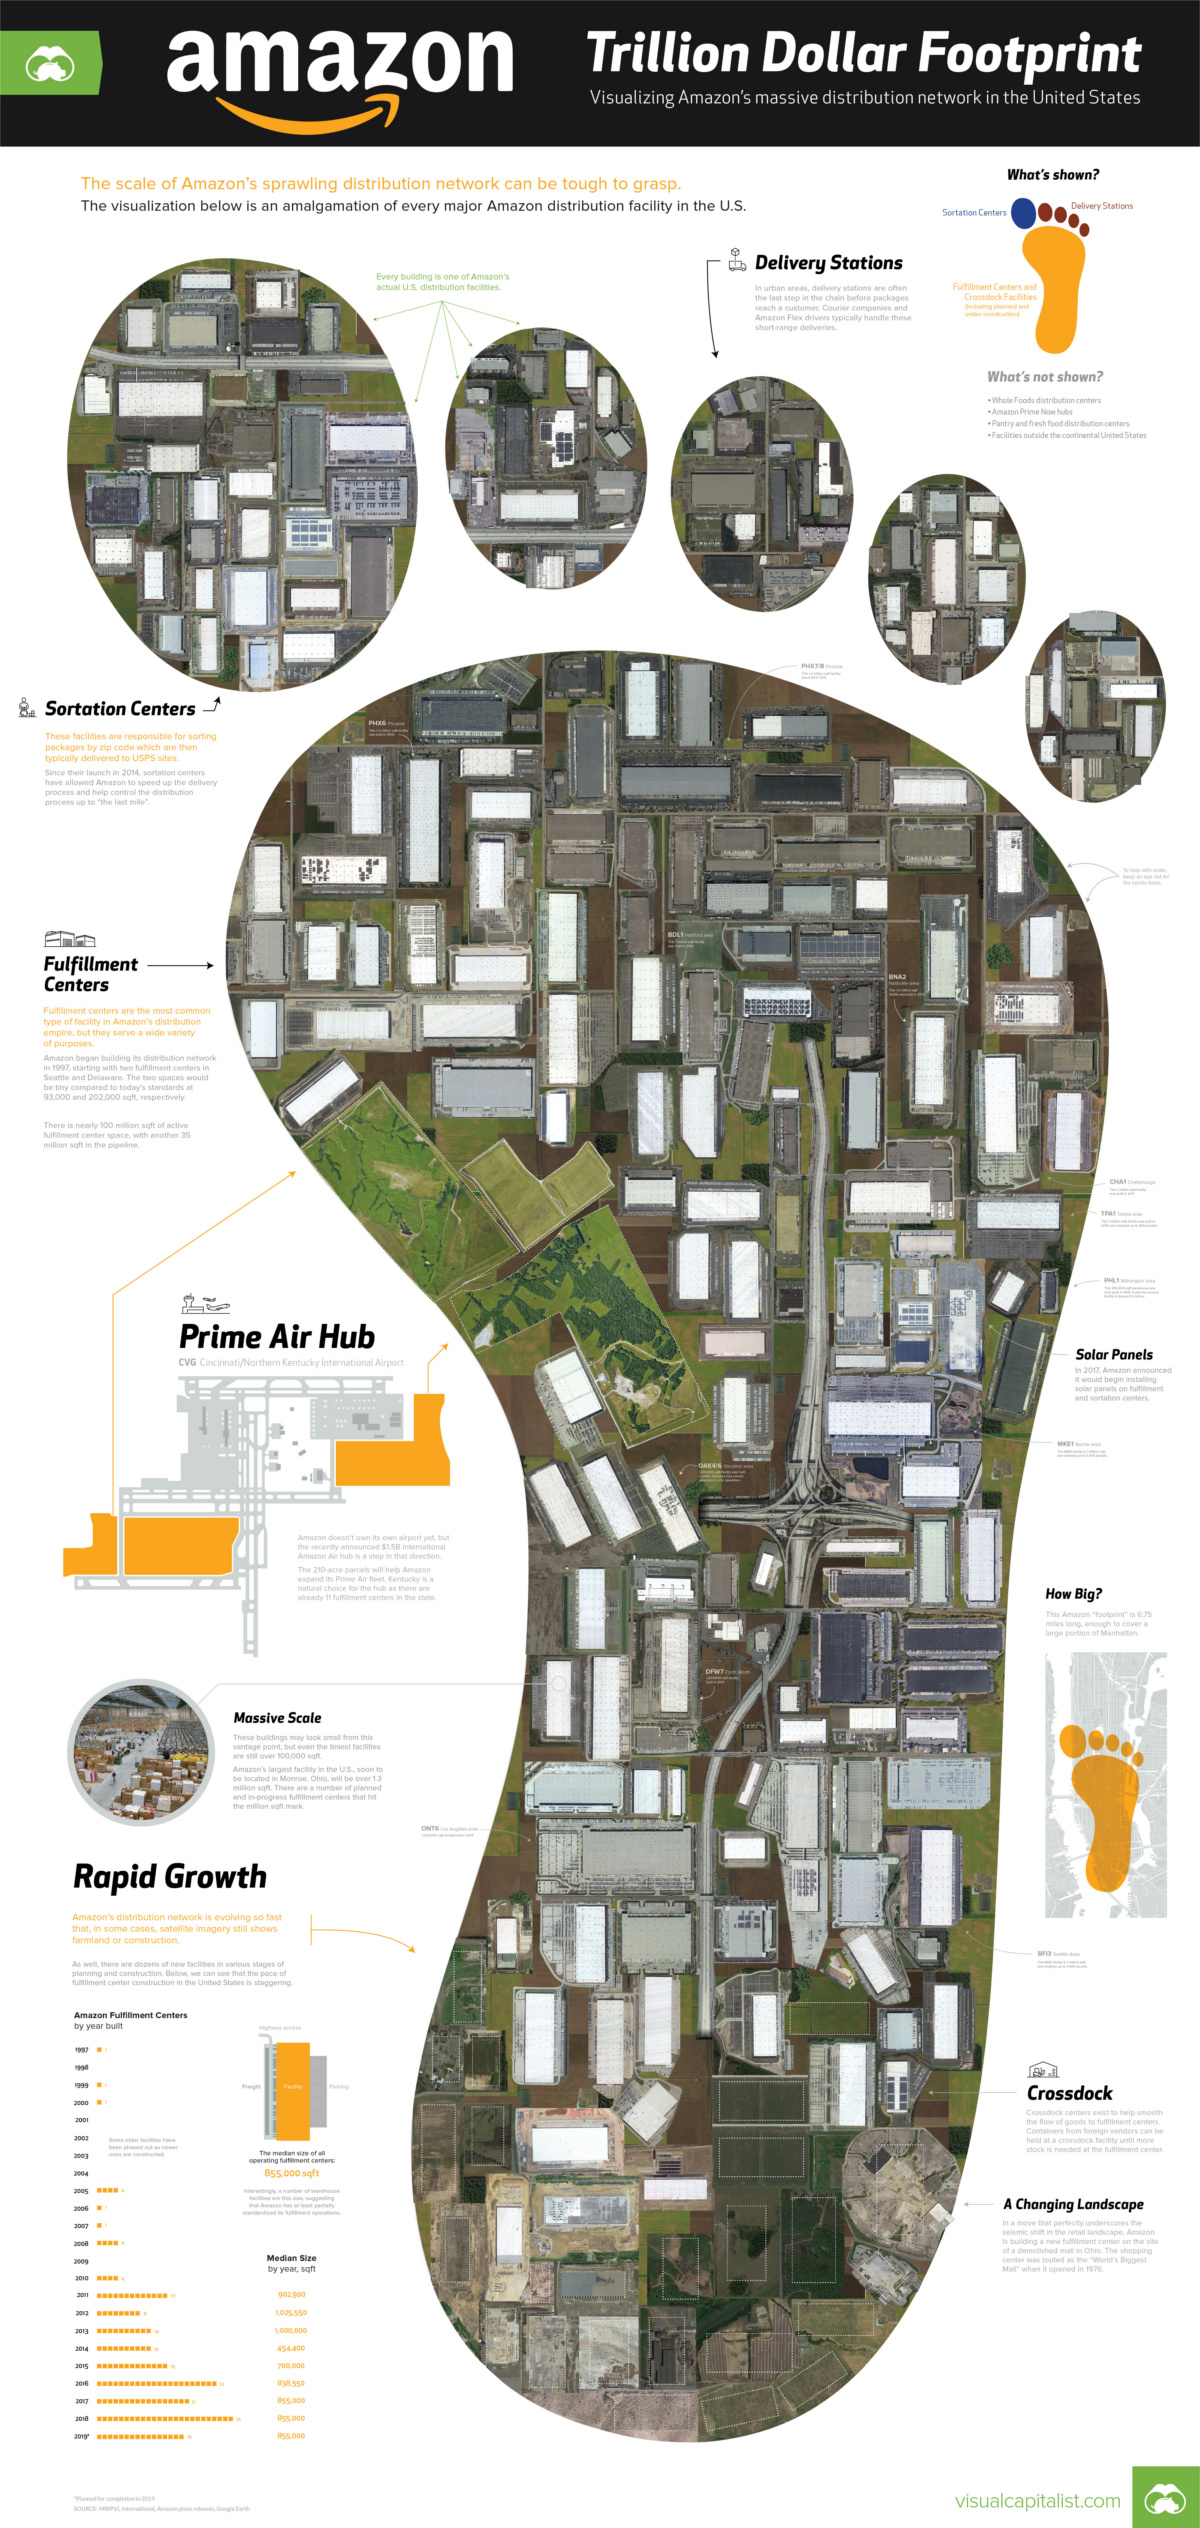
Today’s visualization, which uses comprehensive data from MWPVL International, examines the estimated 124 million square feet of active space in the U.S., as well as the 40 million in Amazon’s construction pipeline.
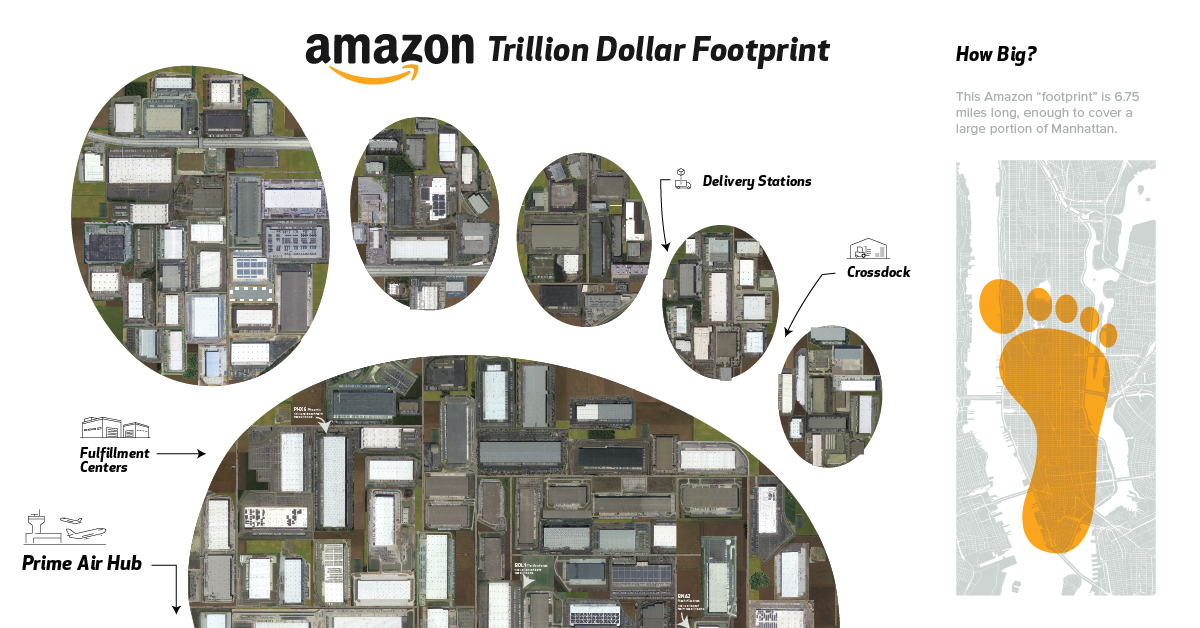
To create our graphical footprint of Amazon’s warehouses in the infographic, we’ve used satellite imagery of every Amazon facility in the U.S. and stitched it all together.
Pieces of the Puzzle
There are a few types of facilities that make up the vast network of Amazon’s warehouses:
Crossdock Centers
Containers from foreign vendors can be held at a crossdock facility until more stock is needed at the fulfillment center. This is the back-end of the distribution chain.
Fulfillment Centers
Fulfillment centers are the most common type of facility in Amazon’s distribution empire, but they serve a wide variety of purposes.
Amazon began building its distribution network in 1997, starting with two fulfillment centers in Seattle and Delaware. The two spaces would be tiny compared to today’s standards at 93,000 and 202,000 square feet, respectively. Now, there is nearly 100 million square feet of active fulfillment center space, with another 35 million on the way.
Sortation Centers
These facilities are responsible for sorting packages by zip code which are then typically delivered to USPS sites. Since being introduced in 2014, sortation centers have allowed Amazon to speed up the delivery process and to help control the distribution process up to “the last mile”.
Delivery Stations
In urban areas, delivery stations are often the last step in the chain before packages reach a customer. Courier companies – and increasingly Amazon Flex drivers – typically handle these short-range deliveries. These stations are often located near airports.
Prime Now Hubs
These smaller locations are specifically designed for speed. Prime Now hubs carry a more limited selection of items – including Whole Foods inventory – that are delivered within two hours of clicking “buy”. There are currently around 50 of these facilities in urban areas around the United States, but that number is expected to increase dramatically in the near future.
Prime Air Hub
Amazon doesn’t own its own airport yet, but the recently announced $1.5B international Prime Air Hub is a step in that direction.
The 210-acre parcels will help Amazon expand its Prime Air fleet while reducing its reliance on companies like UPS and FedEx. Kentucky is a natural choice for the hub as there are already 11 fulfillment centers in the state.
Fighting for the Last Mile
Over the years, Amazon has optimized every aspect of the distribution system, but one final hurdle remains.
Conquering the last mile – the final leg before a package reaches its destination – has proven tricky, in part because USPS already has a well-honed strategy for delivering to all the nation’s residents.
The company’s earnest recruitment drive for Amazon Flex is the latest in a long line of attempts to decrease reliance on third parties for package delivery. Also, by tapping into on-demand labor, Amazon hopes to reduce costs and have more flexibility during volume surges like Black Friday.
This desire to own the entire process is being reflected in the company’s roster of distribution facilities. The massive fulfillment centers aren’t going anywhere, but we may see a lot more smaller delivery hubs in cities and towns across America.


Technology
Visualizing AI Patents by Country
See which countries have been granted the most AI patents each year, from 2012 to 2022.


Visualizing AI Patents by Country
This was originally posted on our Voronoi app. Download the app for free on iOS or Android and discover incredible data-driven charts from a variety of trusted sources.
This infographic shows the number of AI-related patents granted each year from 2010 to 2022 (latest data available). These figures come from the Center for Security and Emerging Technology (CSET), accessed via Stanford University’s 2024 AI Index Report.
From this data, we can see that China first overtook the U.S. in 2013. Since then, the country has seen enormous growth in the number of AI patents granted each year.
| Year | China | EU and UK | U.S. | RoW | Global Total |
|---|---|---|---|---|---|
| 2010 | 307 | 137 | 984 | 571 | 1,999 |
| 2011 | 516 | 129 | 980 | 581 | 2,206 |
| 2012 | 926 | 112 | 950 | 660 | 2,648 |
| 2013 | 1,035 | 91 | 970 | 627 | 2,723 |
| 2014 | 1,278 | 97 | 1,078 | 667 | 3,120 |
| 2015 | 1,721 | 110 | 1,135 | 539 | 3,505 |
| 2016 | 1,621 | 128 | 1,298 | 714 | 3,761 |
| 2017 | 2,428 | 144 | 1,489 | 1,075 | 5,136 |
| 2018 | 4,741 | 155 | 1,674 | 1,574 | 8,144 |
| 2019 | 9,530 | 322 | 3,211 | 2,720 | 15,783 |
| 2020 | 13,071 | 406 | 5,441 | 4,455 | 23,373 |
| 2021 | 21,907 | 623 | 8,219 | 7,519 | 38,268 |
| 2022 | 35,315 | 1,173 | 12,077 | 13,699 | 62,264 |
In 2022, China was granted more patents than every other country combined.
While this suggests that the country is very active in researching the field of artificial intelligence, it doesn’t necessarily mean that China is the farthest in terms of capability.
Key Facts About AI Patents
According to CSET, AI patents relate to mathematical relationships and algorithms, which are considered abstract ideas under patent law. They can also have different meaning, depending on where they are filed.
In the U.S., AI patenting is concentrated amongst large companies including IBM, Microsoft, and Google. On the other hand, AI patenting in China is more distributed across government organizations, universities, and tech firms (e.g. Tencent).
In terms of focus area, China’s patents are typically related to computer vision, a field of AI that enables computers and systems to interpret visual data and inputs. Meanwhile America’s efforts are more evenly distributed across research fields.
Learn More About AI From Visual Capitalist
If you want to see more data visualizations on artificial intelligence, check out this graphic that shows which job departments will be impacted by AI the most.

-

 Mining1 week ago
Gold vs. S&P 500: Which Has Grown More Over Five Years?
-

 Markets2 weeks ago
Ranked: The Most Valuable Housing Markets in America
-

 Money2 weeks ago
Which States Have the Highest Minimum Wage in America?
-

 AI2 weeks ago
Ranked: Semiconductor Companies by Industry Revenue Share
-

 Markets2 weeks ago
Ranked: The World’s Top Flight Routes, by Revenue
-

 Countries2 weeks ago
Population Projections: The World’s 6 Largest Countries in 2075
-

 Markets2 weeks ago
The Top 10 States by Real GDP Growth in 2023
-

 Demographics2 weeks ago
The Smallest Gender Wage Gaps in OECD Countries